
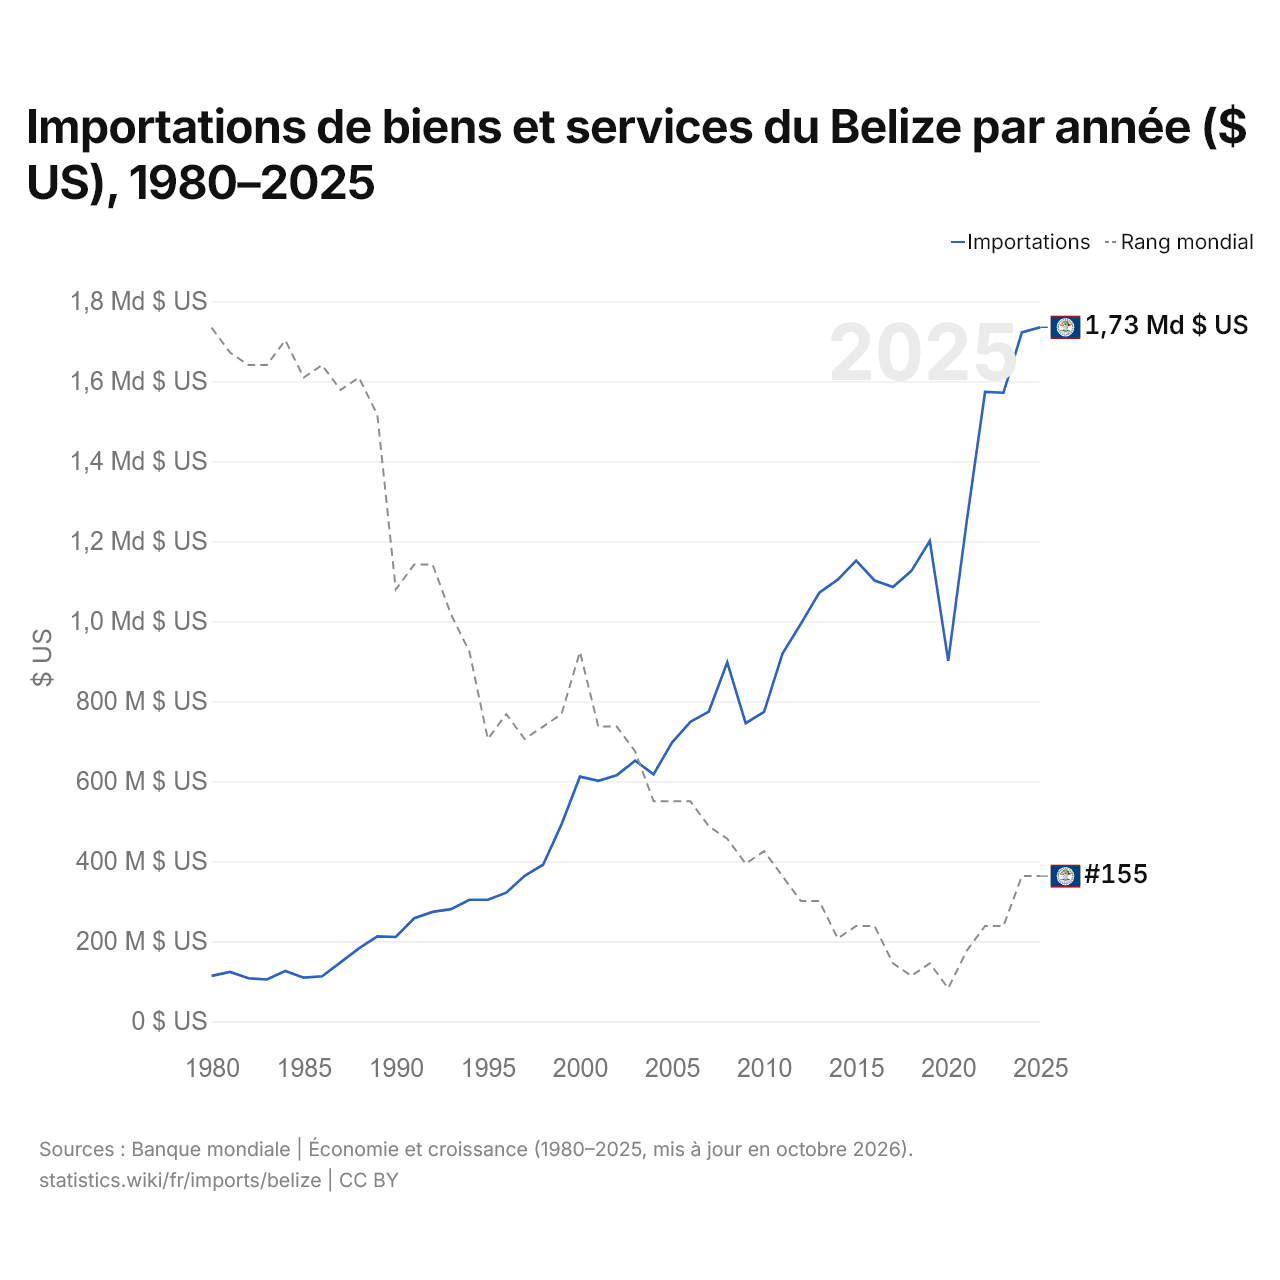
Importations de biens et services du Belize par année ($ US), 1980–2025
| Année | $ US | Rang mondial |
|---|---|---|
| Importations | Rang mondial | |
| 2025 | 1 734 665 363 $ US | #155 |
| 2024 | 1 721 921 750 $ US | #155 |
| 2023 | 1 571 040 800 $ US | #159 |
| 2022 | 1 573 075 200 $ US | #159 |
| 2021 | 1 248 326 800 $ US | #161 |
| 2020 | 900 924 400 $ US | #164 |
| 2019 | 1 200 664 850 $ US | #162 |
| 2018 | 1 125 906 300 $ US | #163 |
| 2017 | 1 085 374 500 $ US | #162 |
| 2016 | 1 101 719 200 $ US | #159 |
| 2015 | 1 151 466 850 $ US | #159 |
| 2014 | 1 103 766 000 $ US | #160 |
| 2013 | 1 071 503 100 $ US | #157 |
| 2012 | 993 819 400 $ US | #157 |
| 2011 | 919 321 650 $ US | #155 |
| 2010 | 773 629 000 $ US | #153 |
| 2009 | 745 030 750 $ US | #154 |
| 2008 | 897 427 350 $ US | #152 |
| 2007 | 774 193 100 $ US | #151 |
| 2006 | 748 768 800 $ US | #149 |
| 2005 | 696 869 050 $ US | #149 |
| 2004 | 617 492 500 $ US | #149 |
| 2003 | 651 445 950 $ US | #145 |
| 2002 | 615 211 850 $ US | #143 |
| 2001 | 600 977 650 $ US | #143 |
| 2000 | 611 537 800 $ US | #137 |
| 1999 | 492 338 700 $ US | #142 |
| 1998 | 391 283 650 $ US | #143 |
| 1997 | 363 622 750 $ US | #144 |
| 1996 | 321 621 300 $ US | #142 |
| 1995 | 303 824 250 $ US | #144 |
| 1994 | 303 861 450 $ US | #137 |
| 1993 | 280 285 400 $ US | #134 |
| 1992 | 273 588 250 $ US | #130 |
| 1991 | 257 770 650 $ US | #130 |
| 1990 | 210 784 513 $ US | #132 |
| 1989 | 212 186 146 $ US | #118 |
| 1988 | 182 372 058 $ US | #115 |
| 1987 | 147 241 619 $ US | #116 |
| 1986 | 112 664 082 $ US | #114 |
| 1985 | 109 048 964 $ US | #115 |
| 1984 | 125 848 629 $ US | #112 |
| 1983 | 104 498 169 $ US | #114 |
| 1982 | 107 602 917 $ US | #114 |
| 1981 | 123 637 027 $ US | #113 |
| 1980 | 113 599 759 $ US | #111 |
En 2025, les importations de biens et services du Belize s'élevaient à 1,73 milliard de dollars, contre 114 millions de dollars en 1980. Le minimum a été de 104 millions de dollars, en 1983. Elles se classaient au 155e rang mondial, un rang qu'elles occupent depuis 2024. Leur meilleur rang a été le 111e, occupé pour la dernière fois en 1980.
En 2025, les importations de biens et services du Belize étaient les 25es plus élevées de 26 pays situés en Amérique latine. Les exportations du Belize dépassent ses importations de 47,2 millions de dollars, soit un excédent commercial (2024). Le commerce du Belize, exportations et importations réunies, équivaut à 109,0 % de son PIB (2024), au 48e rang mondial.
Importations de biens du Belize par catégorie, 2025
Importations de biens, 2025: 1,46 Md $US
En 2025, la première catégorie des importations de biens du Belize était « machines, électronique et véhicules », avec 26,1 %, suivie de « pétrole, gaz, minerais et autres matières premières », avec 19,8 %.
Origines des importations de biens du Belize : les 10 premières, 2025
| Rang | Pays | Importations de biens | Part | |
|---|---|---|---|---|
| 1 |
 États-Unis |
620 M $US | 42,6 % | |
| 2 |
 Chine |
260 M $US | 17,9 % | |
| 3 |
 Mexique |
132 M $US | 9,09 % | |
| 4 |
 Guatemala |
117 M $US | 8 % | |
| 5 |
 Trinité-et-Tobago |
23,5 M $US | 1,61 % | |
| 6 |
 Corée du Sud |
20,1 M $US | 1,38 % | |
| 7 |
 Costa Rica |
19,1 M $US | 1,31 % | |
| 8 |
 Panama |
18,9 M $US | 1,3 % | |
| 9 |
 Vietnam |
16,6 M $US | 1,14 % | |
| 10 |
 Inde |
16,6 M $US | 1,14 % | |
| Autres partenaires et non précisés | 212 M $US | 14,6 % |
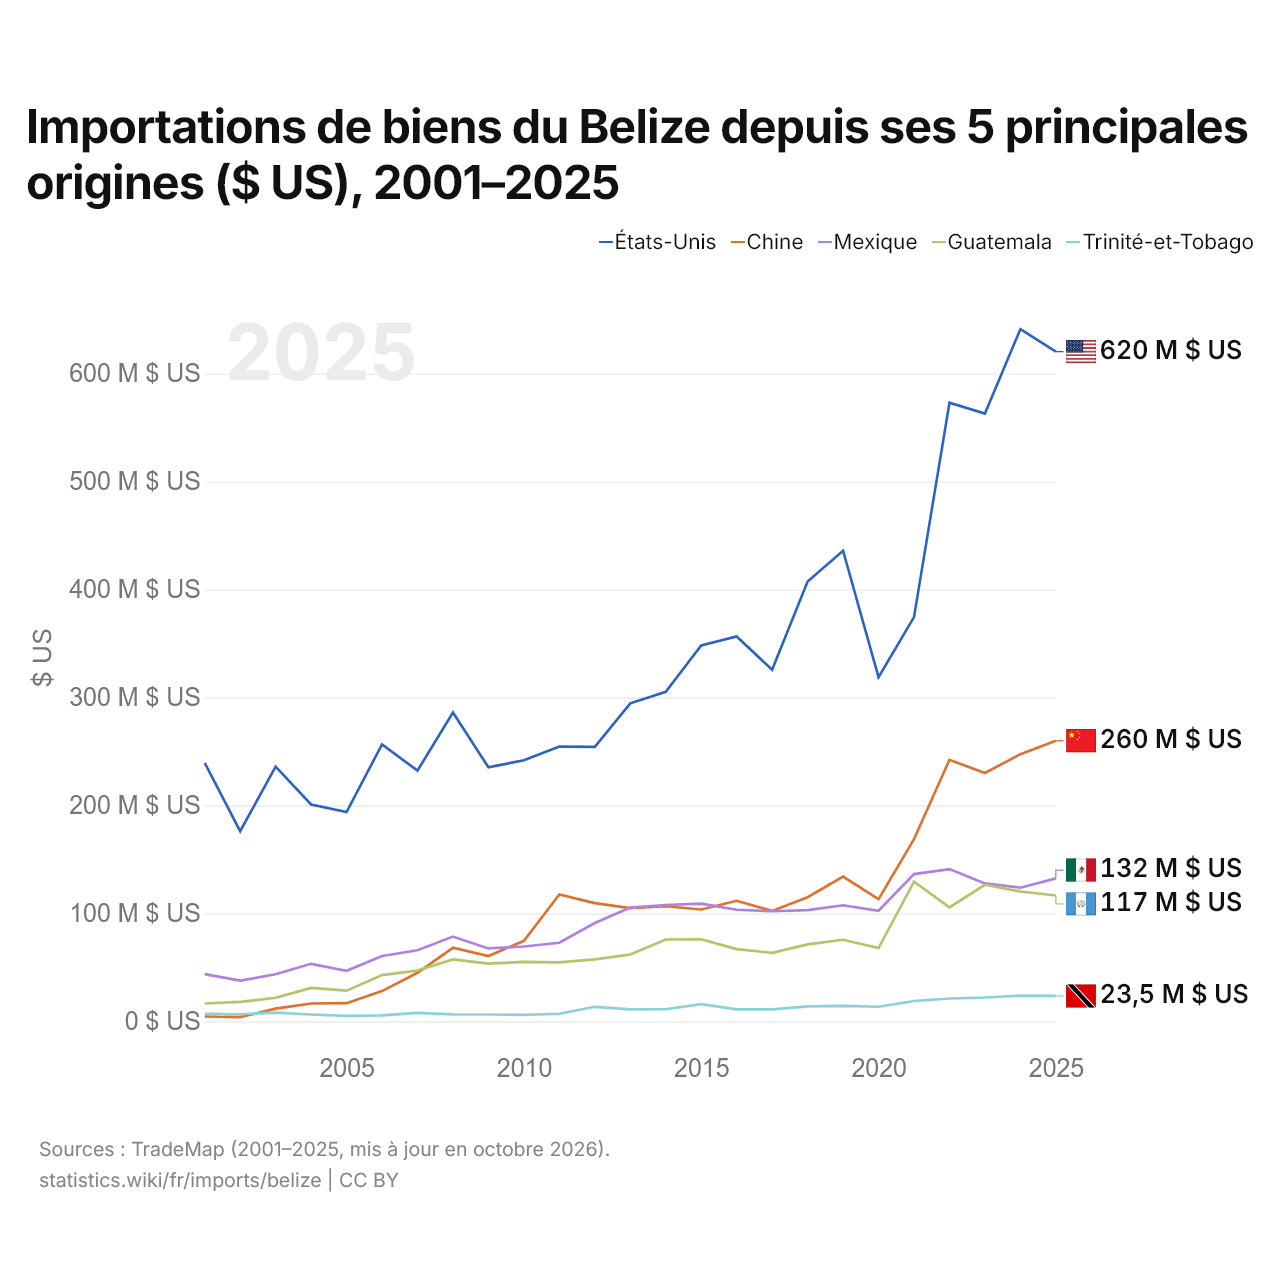
Importations de biens du Belize depuis ses 5 principales origines ($ US), 2001–2025
| Année | $ US | ||||
|---|---|---|---|---|---|
| États-Unis | Chine | Mexique | Guatemala | Trinité-et-Tobago | |
| 2025 | 620 170 000 $ US | 259 824 000 $ US | 132 359 000 $ US | 116 502 000 $ US | 23 498 000 $ US |
| 2024 | 641 052 000 $ US | 247 398 000 $ US | 123 746 000 $ US | 120 251 000 $ US | 23 795 000 $ US |
| 2023 | 562 732 000 $ US | 229 987 000 $ US | 127 699 000 $ US | 126 474 000 $ US | 22 082 000 $ US |
| 2022 | 572 851 000 $ US | 242 156 000 $ US | 140 981 000 $ US | 105 536 000 $ US | 21 165 000 $ US |
| 2021 | 374 303 000 $ US | 168 741 000 $ US | 136 336 000 $ US | 129 362 000 $ US | 18 791 000 $ US |
| 2020 | 318 710 000 $ US | 113 098 000 $ US | 102 377 000 $ US | 67 813 000 $ US | 13 517 000 $ US |
| 2019 | 435 796 000 $ US | 134 072 000 $ US | 107 502 000 $ US | 75 551 000 $ US | 14 365 000 $ US |
| 2018 | 407 216 000 $ US | 114 980 000 $ US | 102 971 000 $ US | 71 254 000 $ US | 13 803 000 $ US |
| 2017 | 325 478 000 $ US | 102 270 000 $ US | 101 901 000 $ US | 63 425 000 $ US | 11 090 000 $ US |
| 2016 | 356 463 000 $ US | 111 650 000 $ US | 103 326 000 $ US | 66 919 000 $ US | 11 050 000 $ US |
| 2015 | 348 060 000 $ US | 103 596 000 $ US | 109 005 000 $ US | 75 992 000 $ US | 15 897 000 $ US |
| 2014 | 305 107 000 $ US | 106 590 000 $ US | 107 730 000 $ US | 75 817 000 $ US | 11 218 000 $ US |
| 2013 | 294 493 000 $ US | 104 859 000 $ US | 105 335 000 $ US | 61 842 000 $ US | 11 148 000 $ US |
| 2012 | 254 147 000 $ US | 109 424 000 $ US | 91 078 000 $ US | 57 412 000 $ US | 13 462 000 $ US |
| 2011 | 254 402 000 $ US | 117 490 000 $ US | 72 794 000 $ US | 54 602 000 $ US | 7 034 000 $ US |
| 2010 | 241 752 000 $ US | 74 540 000 $ US | 69 301 000 $ US | 55 042 000 $ US | 5 970 000 $ US |
| 2009 | 235 237 000 $ US | 60 507 000 $ US | 67 491 000 $ US | 53 401 000 $ US | 6 357 000 $ US |
| 2008 | 286 009 000 $ US | 68 116 000 $ US | 78 507 000 $ US | 57 343 000 $ US | 6 390 000 $ US |
| 2007 | 232 145 000 $ US | 44 945 000 $ US | 65 809 000 $ US | 47 086 000 $ US | 7 845 000 $ US |
| 2006 | 256 435 000 $ US | 28 009 000 $ US | 60 459 000 $ US | 42 790 000 $ US | 5 521 000 $ US |
| 2005 | 193 823 000 $ US | 16 787 000 $ US | 46 766 000 $ US | 28 385 000 $ US | 5 117 000 $ US |
| 2004 | 200 810 000 $ US | 16 550 000 $ US | 53 258 000 $ US | 30 995 000 $ US | 6 315 000 $ US |
| 2003 | 235 851 000 $ US | 11 714 000 $ US | 43 598 000 $ US | 21 850 000 $ US | 8 042 000 $ US |
| 2002 | 176 046 000 $ US | 3 974 000 $ US | 37 650 000 $ US | 17 971 000 $ US | 6 461 000 $ US |
| 2001 | 239 365 000 $ US | 4 482 000 $ US | 43 665 000 $ US | 16 512 000 $ US | 6 991 000 $ US |
En 2025, les importations de biens s'élevaient à 620 millions de dollars en provenance des États-Unis, 260 millions de dollars en provenance de la Chine, 132 millions de dollars en provenance du Mexique, 117 millions de dollars en provenance du Guatemala et 23,5 millions de dollars en provenance de Trinité-et-Tobago. Le premier rang des cinq fournisseurs du Belize est occupé par les États-Unis chaque année depuis 2001. Le changement le plus récent dans leur ordre remonte à 2016, quand les importations du Belize en provenance de la Chine ont dépassé celles en provenance du Mexique.
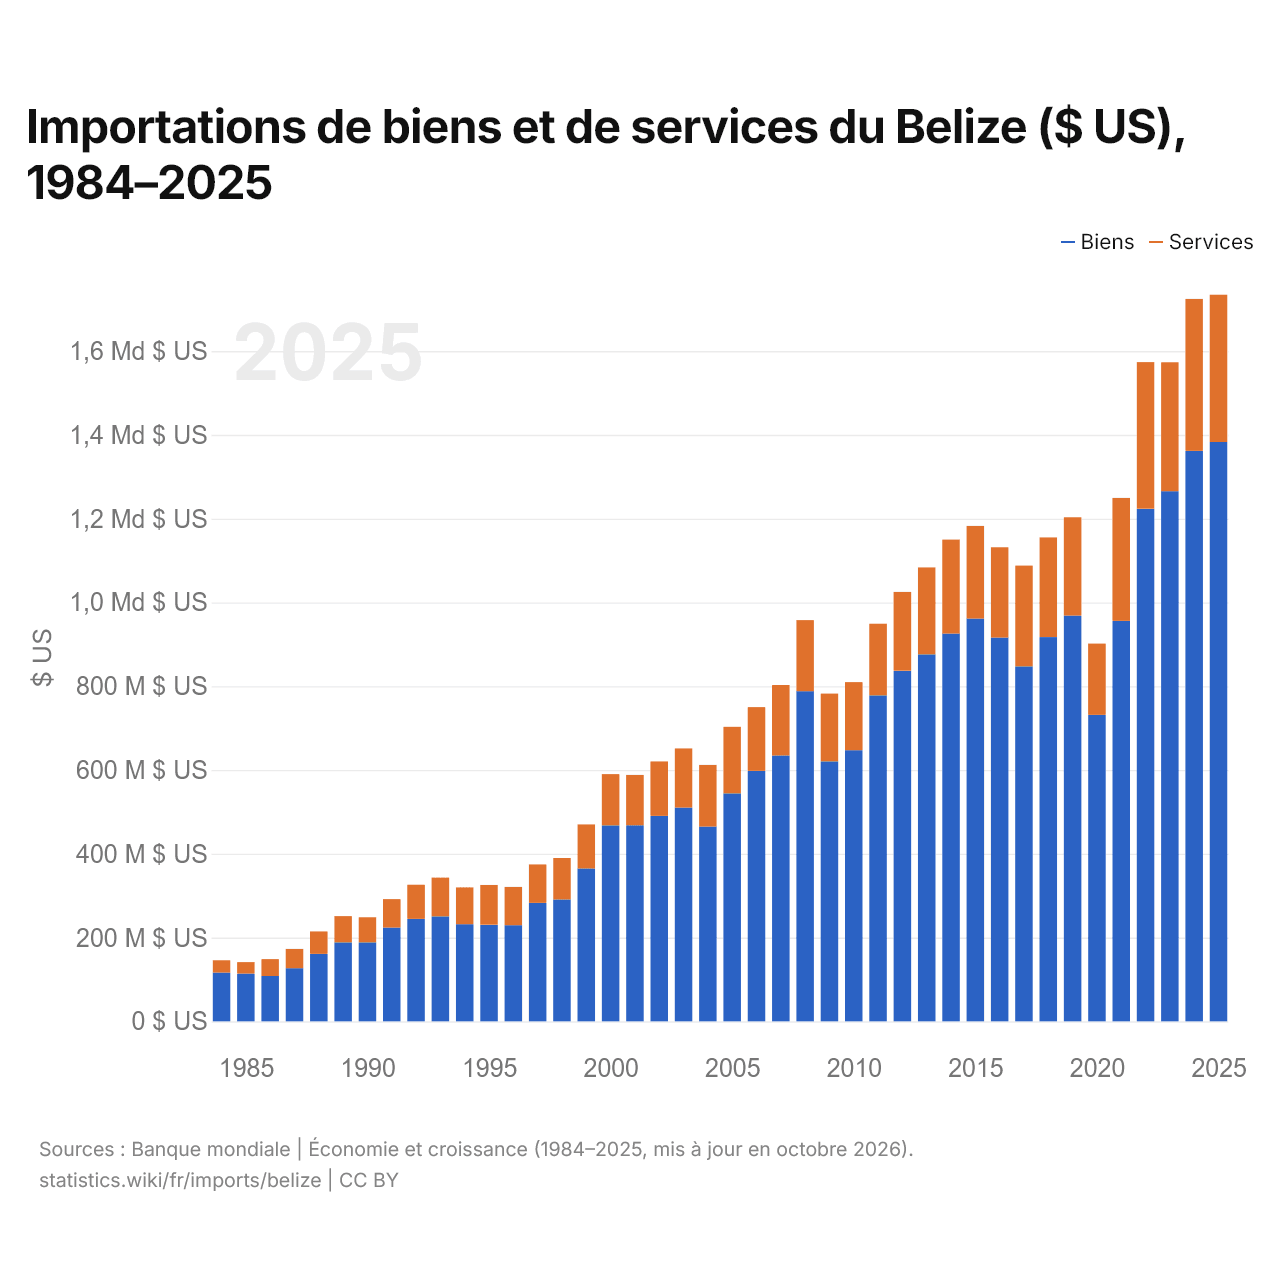
Importations de biens et de services du Belize ($ US), 1984–2025
| Année | $ US | |
|---|---|---|
| Biens | Services | |
| 2025 | 1 383 053 345 $ US | 351 612 018 $ US |
| 2024 | 1 362 002 497 $ US | 362 462 298 $ US |
| 2023 | 1 265 415 550 $ US | 307 893 287 $ US |
| 2022 | 1 223 635 879 $ US | 349 935 271 $ US |
| 2021 | 956 086 050 $ US | 293 363 528 $ US |
| 2020 | 731 431 930 $ US | 170 386 732 $ US |
| 2019 | 968 501 301 $ US | 234 691 298 $ US |
| 2018 | 917 235 593 $ US | 237 857 762 $ US |
| 2017 | 847 365 603 $ US | 240 520 708 $ US |
| 2016 | 916 128 466 $ US | 215 682 310 $ US |
| 2015 | 961 264 733 $ US | 221 357 660 $ US |
| 2014 | 925 532 396 $ US | 224 590 660 $ US |
| 2013 | 875 907 313 $ US | 207 790 831 $ US |
| 2012 | 836 979 650 $ US | 188 071 808 $ US |
| 2011 | 778 175 075 $ US | 171 083 254 $ US |
| 2010 | 647 223 348 $ US | 162 391 153 $ US |
| 2009 | 620 512 129 $ US | 161 746 827 $ US |
| 2008 | 788 239 254 $ US | 169 575 247 $ US |
| 2007 | 634 717 661 $ US | 168 156 306 $ US |
| 2006 | 597 872 245 $ US | 152 159 935 $ US |
| 2005 | 544 213 649 $ US | 158 792 476 $ US |
| 2004 | 465 054 152 $ US | 147 090 961 $ US |
| 2003 | 510 452 424 $ US | 140 983 790 $ US |
| 2002 | 490 485 756 $ US | 129 826 363 $ US |
| 2001 | 468 020 206 $ US | 120 177 622 $ US |
| 2000 | 467 658 722 $ US | 122 605 513 $ US |
| 1999 | 364 949 418 $ US | 105 168 439 $ US |
| 1998 | 290 907 500 $ US | 99 000 000 $ US |
| 1997 | 282 905 000 $ US | 91 650 000 $ US |
| 1996 | 229 510 000 $ US | 91 345 000 $ US |
| 1995 | 230 602 000 $ US | 94 899 500 $ US |
| 1994 | 231 850 000 $ US | 87 962 500 $ US |
| 1993 | 250 500 000 $ US | 92 500 000 $ US |
| 1992 | 244 500 000 $ US | 81 600 000 $ US |
| 1991 | 223 600 000 $ US | 68 200 000 $ US |
| 1990 | 188 400 000 $ US | 60 000 000 $ US |
| 1989 | 188 500 000 $ US | 62 500 000 $ US |
| 1988 | 161 250 000 $ US | 53 350 000 $ US |
| 1987 | 126 950 000 $ US | 45 950 000 $ US |
| 1986 | 108 300 000 $ US | 40 150 000 $ US |
| 1985 | 113 800 000 $ US | 27 550 000 $ US |
| 1984 | 116 300 000 $ US | 29 400 000 $ US |
En 2025, les importations de biens du Belize s'élevaient à 1,38 milliard de dollars et celles de services à 352 millions de dollars ; les services représentaient 20,3 % du total, contre 20,2 % en 1984.
Le Belize dans le classement mondial des importations, 2025
| Rang | Pays | Importations | Part mondiale | |
|---|---|---|---|---|
| 152 |
 Îles Caïmans |
2,59 Md $US (2020) | 0,01 % | |
| 153 |
 Seychelles |
2,21 Md $US | 0,007 % | |
| 154 |
 Sierra Leone |
2,11 Md $US | 0,006 % | |
| 155 |
 Belize |
1,73 Md $US | 0,005 % | |
| 156 |
 Cap-Vert |
1,63 Md $US | 0,005 % | |
| 157 |
 Bhoutan |
1,60 Md $US (2024) | 0,005 % | |
| 158 |
 Timor oriental |
1,58 Md $US (2024) | 0,005 % |
Importations de biens et services du Belize, % du PIB, 1980–2025
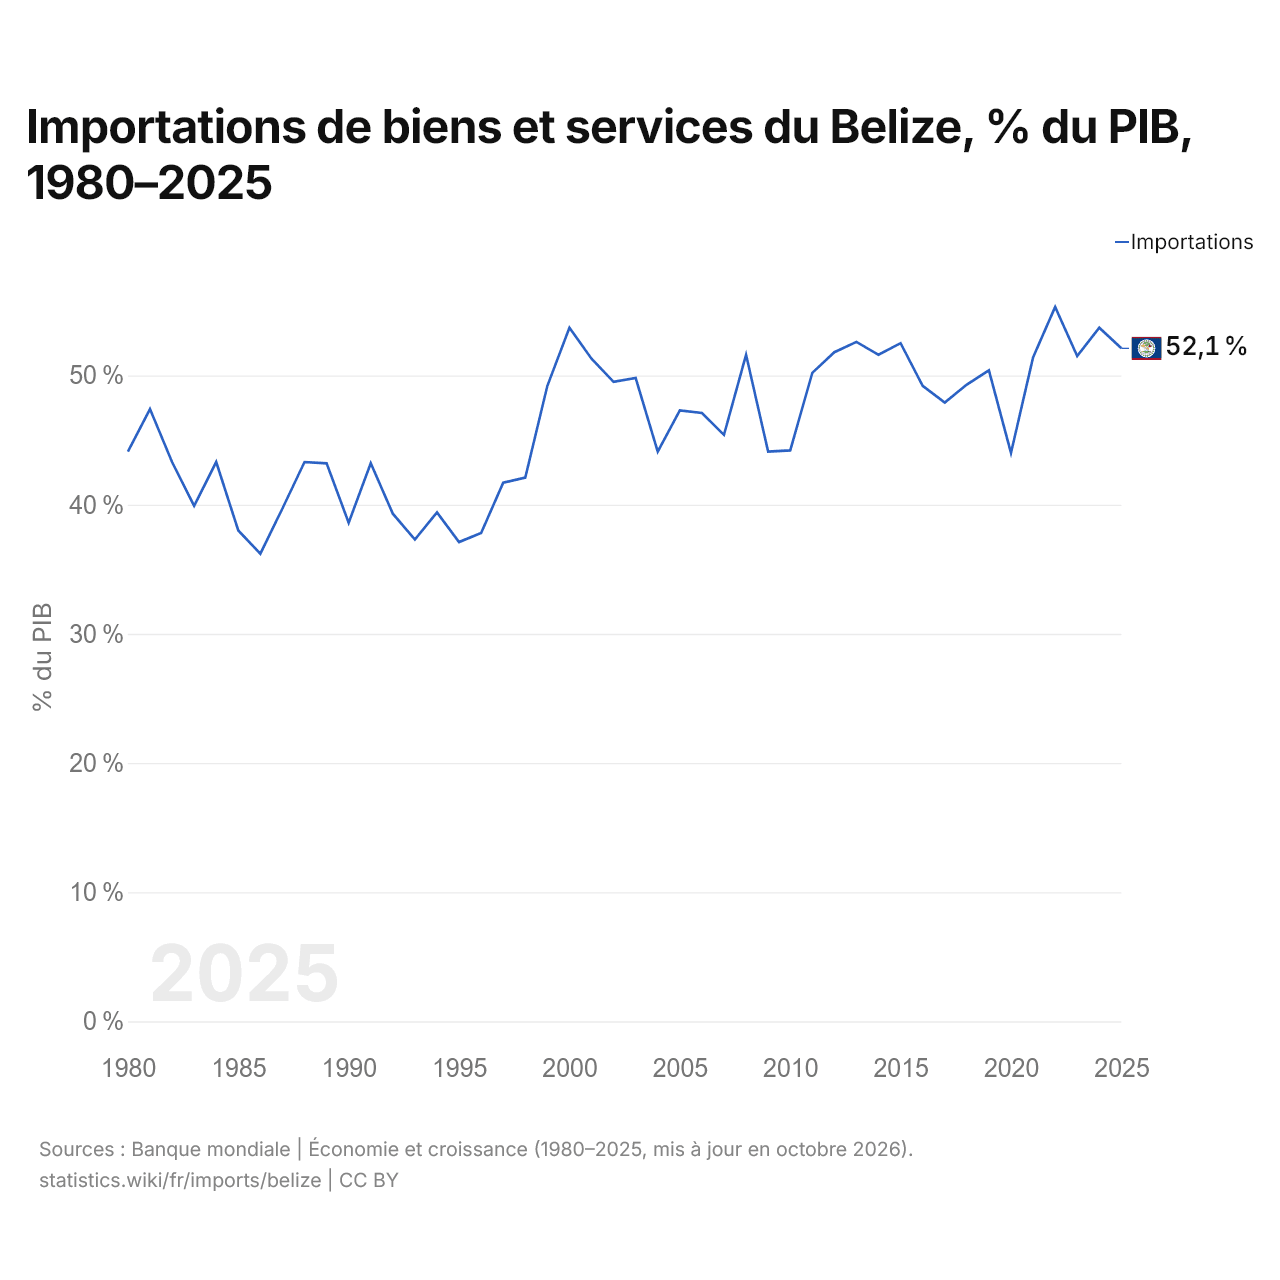
En 2025, les importations de biens et services du Belize équivalaient à 52,1 % de son PIB, contre 44,1 % en 1980. La part la plus élevée a été de 55,3 %, en 2022.
Comparer les importations du Belize avec celles d'autres pays
Sources :
- TradeMap (2001–2025, mis à jour en octobre 2026)
- Banque mondiale | Économie et croissance (1980–2025, mis à jour en octobre 2026)
Creative Commons Attribution (CC BY) : vous pouvez copier, partager, adapter et réutiliser ce contenu, y compris à des fins commerciales, à condition de citer statistics.wiki et d’indiquer les modifications apportées. Les sources citées ci-dessus peuvent avoir leurs propres conditions de licence.