
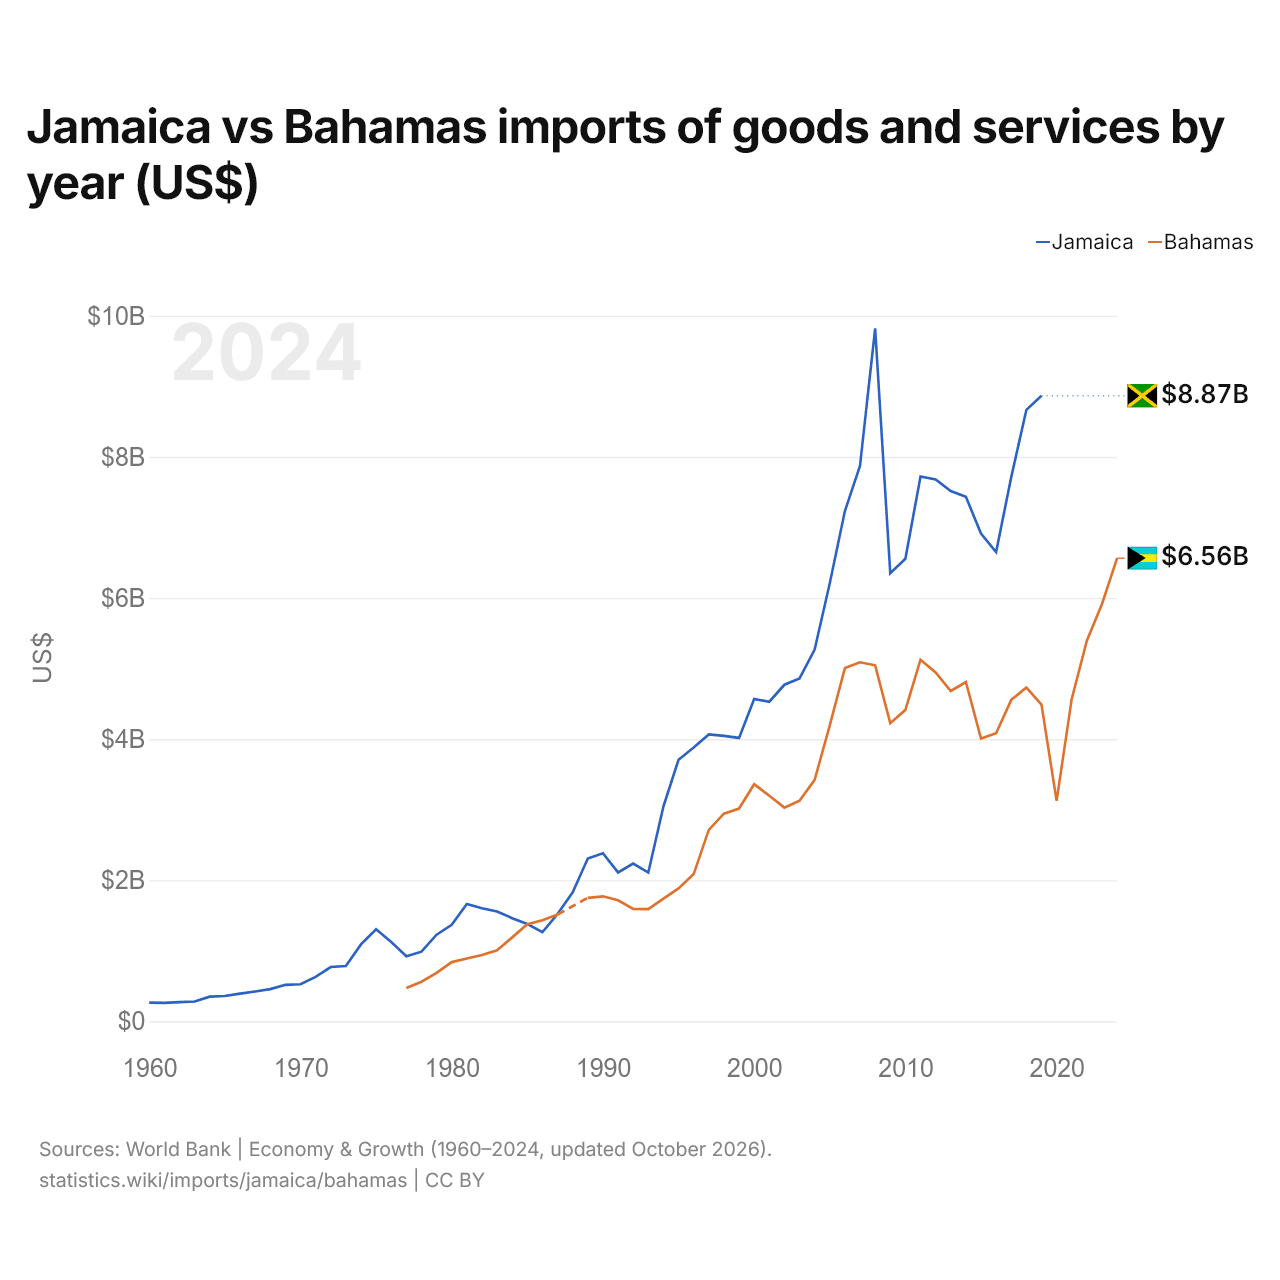
Jamaïque vs Bahamas : importations de biens et services par année ($ US)
1x
| Année | $ US | |
|---|---|---|
 Jamaïque |
 Bahamas |
|
| 2024 | - | 6 564 100 000 $ US |
| 2023 | - | 5 915 800 000 $ US |
| 2022 | - | 5 395 300 000 $ US |
| 2021 | - | 4 569 400 000 $ US |
| 2020 | - | 3 124 200 000 $ US |
| 2019 | 8 866 349 165 $ US | 4 488 400 000 $ US |
| 2018 | 8 666 069 763 $ US | 4 730 600 000 $ US |
| 2017 | 7 712 823 138 $ US | 4 556 600 000 $ US |
| 2016 | 6 651 173 740 $ US | 4 082 400 000 $ US |
| 2015 | 6 912 558 477 $ US | 4 006 600 000 $ US |
| 2014 | 7 434 187 504 $ US | 4 809 200 000 $ US |
| 2013 | 7 514 909 453 $ US | 4 681 600 000 $ US |
| 2012 | 7 678 417 130 $ US | 4 944 700 000 $ US |
| 2011 | 7 721 134 727 $ US | 5 125 700 000 $ US |
| 2010 | 6 555 427 347 $ US | 4 414 100 000 $ US |
| 2009 | 6 351 790 086 $ US | 4 225 400 000 $ US |
| 2008 | 9 820 605 949 $ US | 5 045 700 000 $ US |
| 2007 | 7 873 767 552 $ US | 5 088 400 000 $ US |
| 2006 | 7 231 367 529 $ US | 5 006 500 000 $ US |
| 2005 | 6 208 262 060 $ US | 4 193 800 000 $ US |
| 2004 | 5 267 839 051 $ US | 3 421 700 000 $ US |
| 2003 | 4 860 075 377 $ US | 3 127 000 000 $ US |
| 2002 | 4 770 556 772 $ US | 3 028 700 000 $ US |
| 2001 | 4 529 651 874 $ US | 3 196 400 000 $ US |
| 2000 | 4 567 635 283 $ US | 3 359 600 000 $ US |
| 1999 | 4 016 518 287 $ US | 3 015 600 000 $ US |
| 1998 | 4 045 800 274 $ US | 2 943 000 000 $ US |
| 1997 | 4 065 249 732 $ US | 2 713 700 000 $ US |
| 1996 | 3 879 895 337 $ US | 2 086 690 000 $ US |
| 1995 | 3 708 143 138 $ US | 1 883 080 000 $ US |
| 1994 | 3 045 100 768 $ US | 1 739 670 000 $ US |
| 1993 | 2 108 459 209 $ US | 1 589 080 000 $ US |
| 1992 | 2 235 110 186 $ US | 1 592 260 000 $ US |
| 1991 | 2 110 239 657 $ US | 1 716 350 000 $ US |
| 1990 | 2 382 299 630 $ US | 1 771 670 000 $ US |
| 1989 | 2 308 098 660 $ US | 1 750 510 000 $ US |
| 1988 | 1 829 425 309 $ US | - |
| 1987 | 1 520 814 039 $ US | 1 514 500 000 $ US |
| 1986 | 1 263 966 992 $ US | 1 431 700 000 $ US |
| 1985 | 1 379 728 376 $ US | 1 375 500 000 $ US |
| 1984 | 1 462 360 264 $ US | 1 190 100 000 $ US |
| 1983 | 1 557 278 453 $ US | 1 005 300 000 $ US |
| 1982 | 1 602 036 578 $ US | 939 900 000 $ US |
| 1981 | 1 662 493 965 $ US | 889 700 000 $ US |
| 1980 | 1 367 560 654 $ US | 839 600 000 $ US |
| 1979 | 1 227 859 821 $ US | 686 200 000 $ US |
| 1978 | 987 222 432 $ US | 562 000 000 $ US |
| 1977 | 922 350 922 $ US | 471 600 000 $ US |
| 1976 | 1 123 871 124 $ US | - |
| 1975 | 1 304 711 305 $ US | - |
| 1974 | 1 090 321 090 $ US | - |
| 1973 | 783 909 574 $ US | - |
| 1972 | 770 072 707 $ US | - |
| 1971 | 630 401 944 $ US | - |
| 1970 | 525 600 210 $ US | - |
| 1969 | 517 679 586 $ US | - |
| 1968 | 455 999 635 $ US | - |
| 1967 | 422 531 127 $ US | - |
| 1966 | 393 399 843 $ US | - |
| 1965 | 358 399 857 $ US | - |
| 1964 | 349 999 860 $ US | - |
| 1963 | 281 399 887 $ US | - |
| 1962 | 271 599 891 $ US | - |
| 1961 | 261 799 895 $ US | - |
| 1960 | 265 999 894 $ US | - |
Les importations de biens et services de la Jamaïque s'élèvent à 8,87 milliards de dollars (2019), et celles des Bahamas à 6,56 milliards de dollars (2024). En 1977, les importations de la Jamaïque étaient 2,0 fois plus élevées : 922 millions de dollars pour la Jamaïque et 472 millions de dollars pour les Bahamas.
Jamaïque vs Bahamas : chiffres des importations
|
Jamaïque
|
Bahamas
|
|
|---|---|---|
| Importations | 8,87 Md $US (2019) | 6,56 Md $US (2024) |
| Rang mondial | n.d. | 132/174 |
| Part mondiale | 0,04 % | 0,02 % |
| % du PIB | 52,1 % | 41,5 % |
| Première catégorie de biens | Pétrole, gaz, minerais et autres matières premières (26,9 %, 2025) | Machines, électronique et véhicules (28,6 %, 2025) |
| Première origine des biens | États-Unis (37,9 %, 2025) | États-Unis (82,2 %, 2025) |
Comparer les importations de 2 pays au choix
Sources :
- Banque mondiale | Économie et croissance (1960–2024, mis à jour en octobre 2026)
- TradeMap (2001–2025, mis à jour en octobre 2026)
Creative Commons Attribution (CC BY) : vous pouvez copier, partager, adapter et réutiliser ce contenu, y compris à des fins commerciales, à condition de citer statistics.wiki et d’indiquer les modifications apportées. Les sources citées ci-dessus peuvent avoir leurs propres conditions de licence.