
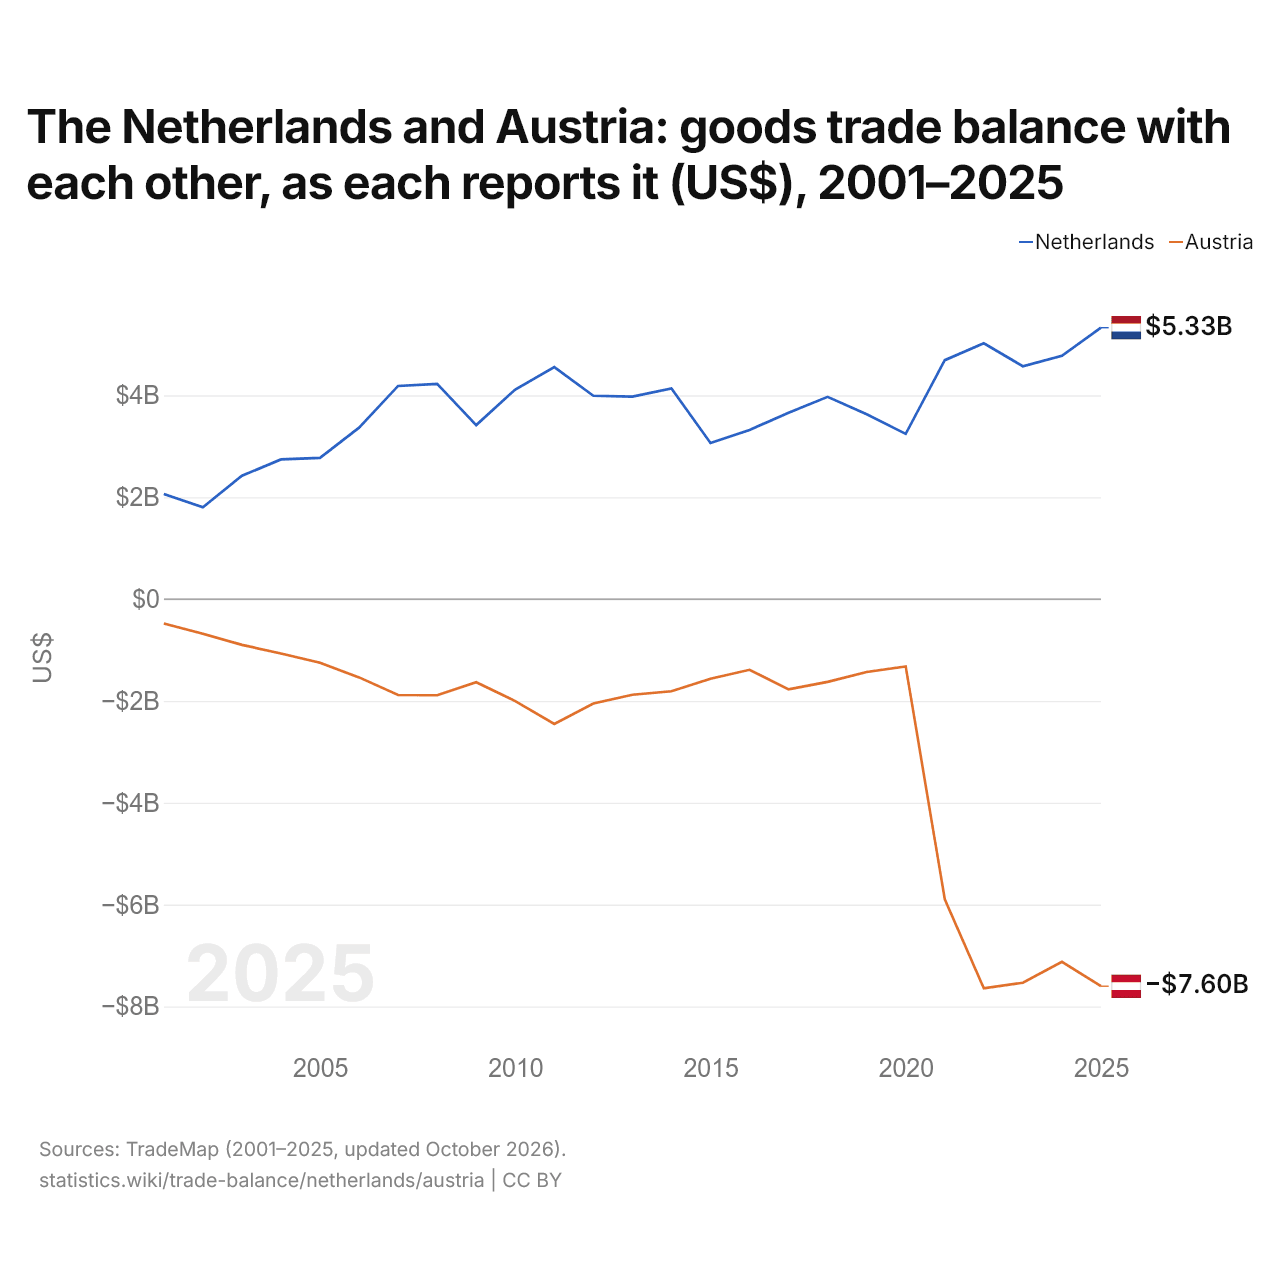
Les Pays-Bas et l'Autriche : solde de leur commerce de biens bilatéral, selon chacun ($ US), 2001–2025
| Année | $ US | |
|---|---|---|
| Pays-Bas | Autriche | |
| 2025 | 5 329 008 000 $ US | −7 602 464 000 $ US |
| 2024 | 4 778 634 000 $ US | −7 123 996 000 $ US |
| 2023 | 4 571 371 000 $ US | −7 534 876 000 $ US |
| 2022 | 5 023 068 000 $ US | −7 643 551 000 $ US |
| 2021 | 4 691 631 000 $ US | −5 894 995 000 $ US |
| 2020 | 3 244 860 000 $ US | −1 322 733 000 $ US |
| 2019 | 3 630 331 000 $ US | −1 432 841 000 $ US |
| 2018 | 3 970 817 000 $ US | −1 626 516 000 $ US |
| 2017 | 3 657 792 000 $ US | −1 773 899 000 $ US |
| 2016 | 3 321 971 000 $ US | −1 389 247 000 $ US |
| 2015 | 3 065 027 000 $ US | −1 564 584 000 $ US |
| 2014 | 4 136 702 000 $ US | −1 810 267 000 $ US |
| 2013 | 3 976 965 000 $ US | −1 878 188 000 $ US |
| 2012 | 3 992 685 000 $ US | −2 051 416 000 $ US |
| 2011 | 4 553 481 000 $ US | −2 451 683 000 $ US |
| 2010 | 4 115 787 000 $ US | −2 003 521 000 $ US |
| 2009 | 3 416 449 000 $ US | −1 633 356 000 $ US |
| 2008 | 4 224 691 000 $ US | −1 888 152 000 $ US |
| 2007 | 4 185 390 000 $ US | −1 883 247 000 $ US |
| 2006 | 3 366 431 000 $ US | −1 538 217 000 $ US |
| 2005 | 2 772 177 000 $ US | −1 251 030 000 $ US |
| 2004 | 2 742 120 000 $ US | −1 068 412 000 $ US |
| 2003 | 2 421 509 000 $ US | −899 925 000 $ US |
| 2002 | 1 803 105 000 $ US | −682 520 000 $ US |
| 2001 | 2 063 825 000 $ US | −479 865 000 $ US |
En 2025, selon les Pays-Bas, leur commerce de biens avec l'Autriche affichait un excédent de 5,33 milliards de dollars ; selon l'Autriche, son commerce de biens avec les Pays-Bas affichait un déficit de 7,6 milliards de dollars. En 2001, les chiffres étaient un excédent de 2,06 milliards de dollars pour les Pays-Bas et un déficit de 480 millions de dollars pour l'Autriche.
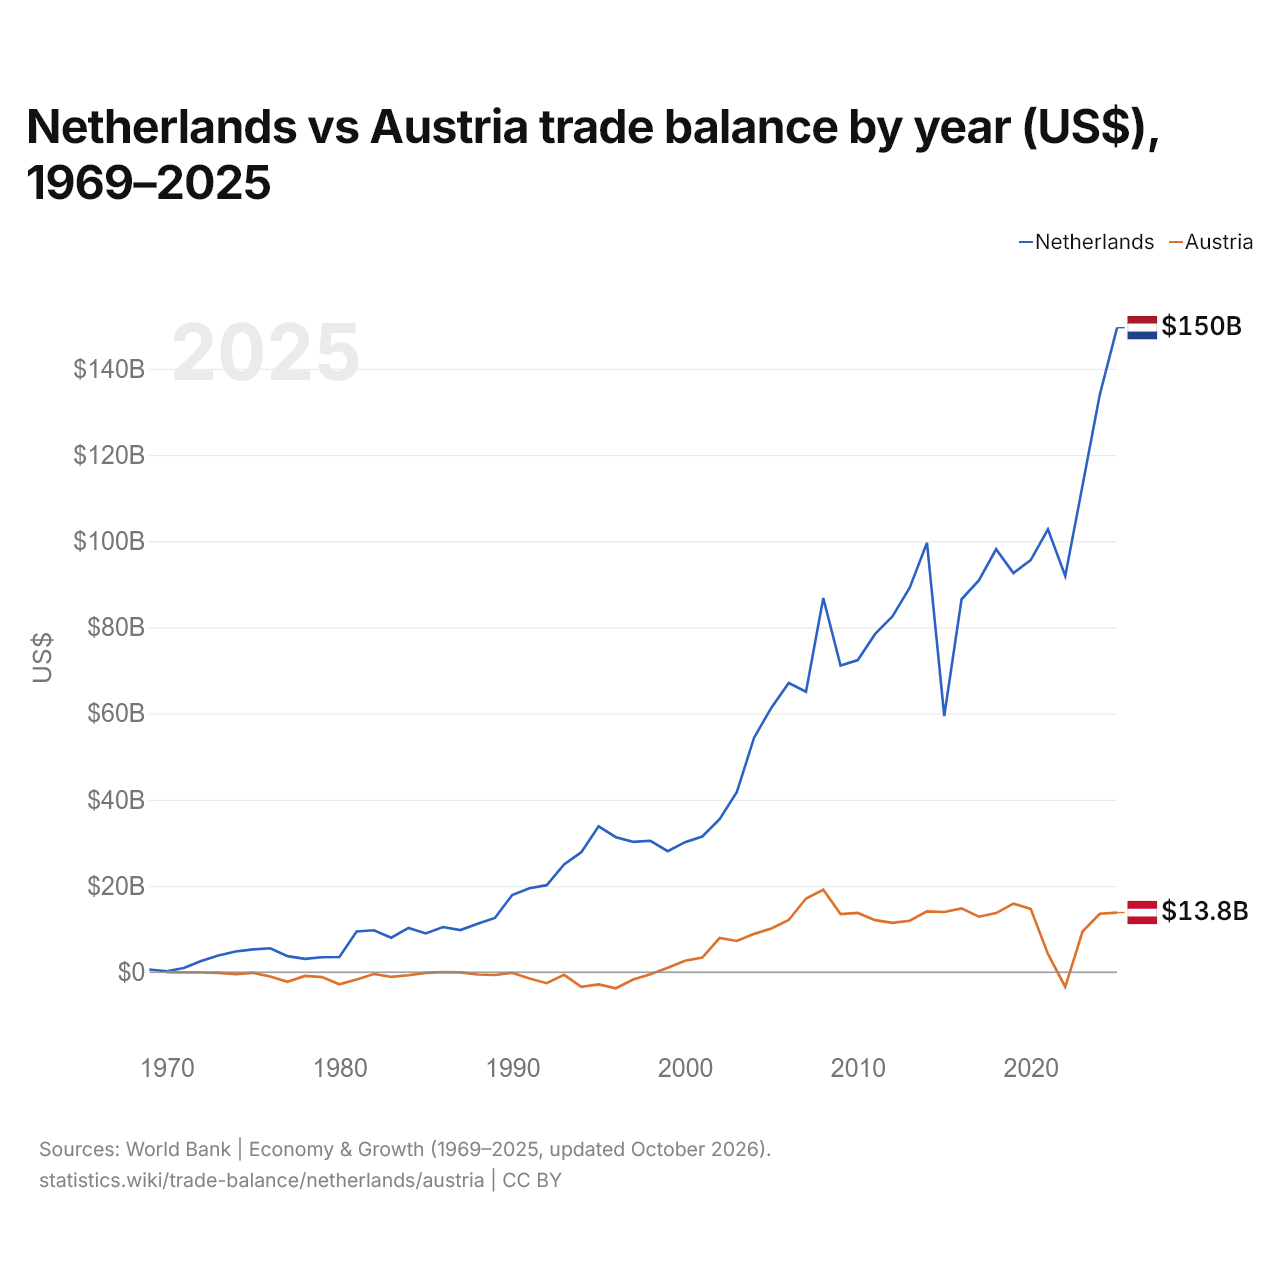
Pays-Bas vs Autriche : balance commerciale par année ($ US), 1969–2025
| Année | $ US | |
|---|---|---|
 Pays-Bas |
 Autriche |
|
| 2025 | 149 519 368 722 $ US | 13 814 886 820 $ US |
| 2024 | 134 007 361 075 $ US | 13 534 442 567 $ US |
| 2023 | 112 885 525 975 $ US | 9 406 525 619 $ US |
| 2022 | 91 883 758 920 $ US | −3 430 638 702 $ US |
| 2021 | 102 760 026 360 $ US | 4 203 878 935 $ US |
| 2020 | 95 585 823 574 $ US | 14 673 802 549 $ US |
| 2019 | 92 567 108 267 $ US | 15 877 995 063 $ US |
| 2018 | 98 121 967 356 $ US | 13 697 443 777 $ US |
| 2017 | 90 871 553 835 $ US | 12 846 082 513 $ US |
| 2016 | 86 519 974 912 $ US | 14 776 305 348 $ US |
| 2015 | 59 405 539 190 $ US | 13 946 204 239 $ US |
| 2014 | 99 609 660 307 $ US | 14 102 094 280 $ US |
| 2013 | 89 195 079 396 $ US | 11 919 802 293 $ US |
| 2012 | 82 521 976 395 $ US | 11 430 475 736 $ US |
| 2011 | 78 468 693 473 $ US | 12 049 576 179 $ US |
| 2010 | 72 400 038 600 $ US | 13 733 951 386 $ US |
| 2009 | 71 142 272 210 $ US | 13 469 366 425 $ US |
| 2008 | 86 778 984 923 $ US | 19 114 143 978 $ US |
| 2007 | 65 052 481 087 $ US | 17 079 360 546 $ US |
| 2006 | 67 090 411 938 $ US | 12 089 354 977 $ US |
| 2005 | 61 353 555 872 $ US | 10 132 963 489 $ US |
| 2004 | 54 443 116 593 $ US | 8 869 129 249 $ US |
| 2003 | 41 785 064 886 $ US | 7 221 564 356 $ US |
| 2002 | 35 473 198 312 $ US | 7 912 464 486 $ US |
| 2001 | 31 443 761 454 $ US | 3 354 580 395 $ US |
| 2000 | 30 149 484 438 $ US | 2 628 000 043 $ US |
| 1999 | 28 049 104 555 $ US | 986 217 302 $ US |
| 1998 | 30 467 673 850 $ US | −491 312 806 $ US |
| 1997 | 30 213 462 842 $ US | −1 726 846 319 $ US |
| 1996 | 31 287 581 699 $ US | −3 760 718 742 $ US |
| 1995 | 33 823 771 617 $ US | −2 869 134 707 $ US |
| 1994 | 27 817 382 250 $ US | −3 399 096 494 $ US |
| 1993 | 24 988 427 860 $ US | −642 069 088 $ US |
| 1992 | 20 174 407 268 $ US | −2 574 318 808 $ US |
| 1991 | 19 451 513 437 $ US | −1 507 547 437 $ US |
| 1990 | 17 883 441 849 $ US | −155 715 842 $ US |
| 1989 | 12 556 469 916 $ US | −676 119 605 $ US |
| 1988 | 11 195 472 182 $ US | −560 959 545 $ US |
| 1987 | 9 754 287 424 $ US | −51 301 698 $ US |
| 1986 | 10 457 692 031 $ US | −18 986 030 $ US |
| 1985 | 8 962 418 392 $ US | −166 890 130 $ US |
| 1984 | 10 259 458 104 $ US | −729 464 961 $ US |
| 1983 | 7 966 659 717 $ US | −1 093 202 850 $ US |
| 1982 | 9 708 016 011 $ US | −451 973 865 $ US |
| 1981 | 9 423 038 947 $ US | −1 701 433 385 $ US |
| 1980 | 3 500 606 296 $ US | −2 821 896 405 $ US |
| 1979 | 3 439 706 690 $ US | −1 150 221 307 $ US |
| 1978 | 3 075 533 714 $ US | −892 189 899 $ US |
| 1977 | 3 708 195 205 $ US | −2 252 386 979 $ US |
| 1976 | 5 533 782 297 $ US | −1 035 864 846 $ US |
| 1975 | 5 259 495 469 $ US | −164 188 986 $ US |
| 1974 | 4 786 280 843 $ US | −471 183 009 $ US |
| 1973 | 3 843 968 154 $ US | −182 431 654 $ US |
| 1972 | 2 565 120 846 $ US | −95 890 232 $ US |
| 1971 | 940 433 584 $ US | −55 318 868 $ US |
| 1970 | 195 855 604 $ US | −11 819 000 $ US |
| 1969 | 611 798 612 $ US | - |
En 2025, la balance commerciale des Pays-Bas affichait un excédent de 150 milliards de dollars et celle de l'Autriche un excédent de 13,8 milliards de dollars ; l'excédent des Pays-Bas était 11 fois plus grand. En 1970, la balance commerciale des Pays-Bas affichait un excédent de 196 millions de dollars et celle de l'Autriche un déficit de 11,8 millions de dollars.
De 1970 à 2025, la balance commerciale des Pays-Bas a été excédentaire chacune des 56 années, et celle de l'Autriche pendant 26. Les balances commerciales des Pays-Bas et de l'Autriche n'ont jamais été déficitaires la même année.
Pays-Bas vs Autriche : chiffres de la balance commerciale
|
Pays-Bas
|
Autriche
|
|
|---|---|---|
| Biens et services, $ US | +150 Md $US (2025) | +13,8 Md $US (2025) |
| % du PIB | +11,2 % (2025) | +2,4 % (2025) |
| Années d'excédent depuis 2000 | 26 sur 26 | 25 sur 26 |
| Solde des biens entre les deux, chiffres propres | +5,33 Md $US (2025) | −7,60 Md $US (2025) |
| Premier excédent en biens avec | Allemagne (+52,4 Md $US, 2025) | États-Unis (+9,24 Md $US, 2025) |
| Premier déficit en biens avec | Chine (−33,7 Md $US, 2025) | Allemagne (−25,6 Md $US, 2025) |
Comparer la balance commerciale de 2 pays au choix
Sources :
- Banque mondiale | Économie et croissance (1969–2025, mis à jour en octobre 2026)
- TradeMap (2001–2025, mis à jour en octobre 2026)
Creative Commons Attribution (CC BY) : vous pouvez copier, partager, adapter et réutiliser ce contenu, y compris à des fins commerciales, à condition de citer statistics.wiki et d’indiquer les modifications apportées. Les sources citées ci-dessus peuvent avoir leurs propres conditions de licence.