
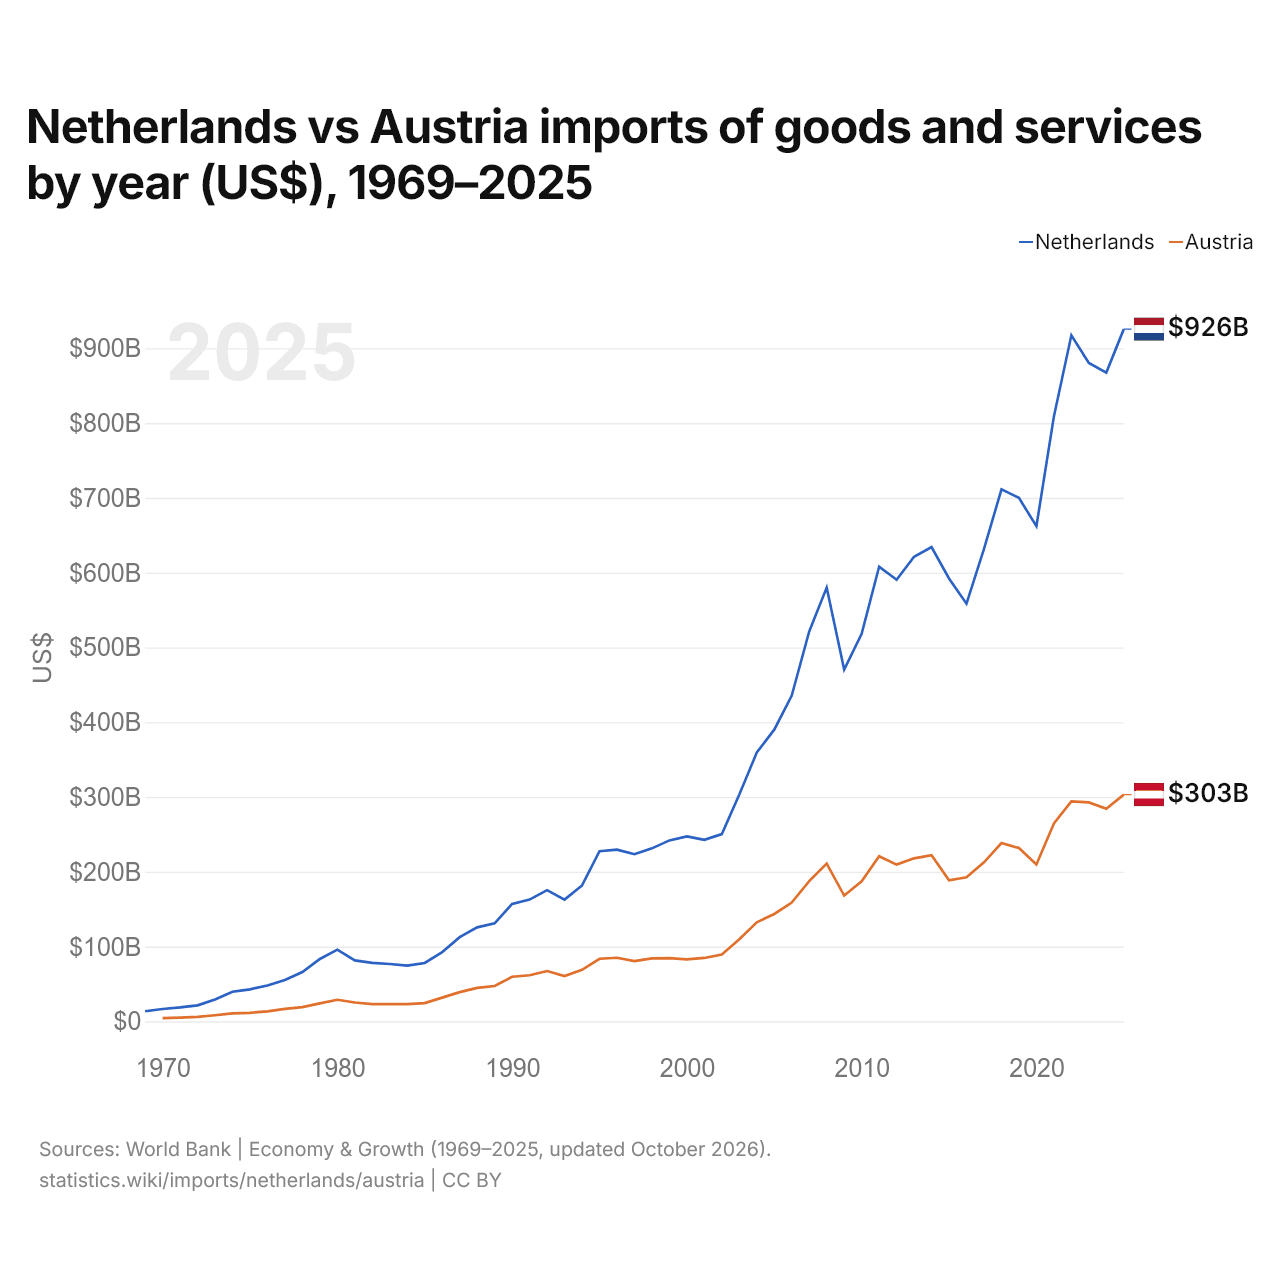
Pays-Bas vs Autriche : importations de biens et services par année ($ US), 1969–2025
| Année | $ US | |
|---|---|---|
 Pays-Bas |
 Autriche |
|
| 2025 | 925 615 517 034 $ US | 303 166 499 175 $ US |
| 2024 | 867 461 920 495 $ US | 284 227 859 384 $ US |
| 2023 | 880 497 587 437 $ US | 292 777 313 124 $ US |
| 2022 | 917 438 087 562 $ US | 294 117 763 031 $ US |
| 2021 | 808 831 153 930 $ US | 264 636 005 985 $ US |
| 2020 | 662 040 850 865 $ US | 209 749 421 171 $ US |
| 2019 | 699 981 663 067 $ US | 231 731 288 459 $ US |
| 2018 | 711 271 186 937 $ US | 238 401 029 983 $ US |
| 2017 | 631 649 933 012 $ US | 212 566 814 420 $ US |
| 2016 | 558 461 399 909 $ US | 192 552 851 879 $ US |
| 2015 | 592 155 905 830 $ US | 188 716 276 455 $ US |
| 2014 | 634 097 409 855 $ US | 222 087 325 387 $ US |
| 2013 | 621 247 134 614 $ US | 217 963 667 008 $ US |
| 2012 | 590 440 051 624 $ US | 209 538 729 662 $ US |
| 2011 | 607 986 567 101 $ US | 220 838 859 462 $ US |
| 2010 | 518 250 485 050 $ US | 187 354 745 673 $ US |
| 2009 | 470 309 474 397 $ US | 168 155 373 268 $ US |
| 2008 | 579 974 770 036 $ US | 210 948 589 023 $ US |
| 2007 | 521 387 406 195 $ US | 187 479 966 356 $ US |
| 2006 | 435 548 397 900 $ US | 158 881 044 290 $ US |
| 2005 | 389 965 072 237 $ US | 143 550 311 539 $ US |
| 2004 | 359 456 671 940 $ US | 132 415 630 675 $ US |
| 2003 | 303 246 002 571 $ US | 109 674 880 760 $ US |
| 2002 | 250 343 480 545 $ US | 89 249 970 295 $ US |
| 2001 | 242 665 446 715 $ US | 84 769 003 460 $ US |
| 2000 | 247 348 982 303 $ US | 82 889 700 573 $ US |
| 1999 | 241 942 977 209 $ US | 84 520 551 775 $ US |
| 1998 | 231 284 159 076 $ US | 84 196 219 431 $ US |
| 1997 | 223 487 689 180 $ US | 80 519 035 968 $ US |
| 1996 | 229 597 385 621 $ US | 85 017 444 762 $ US |
| 1995 | 227 502 058 743 $ US | 83 696 839 088 $ US |
| 1994 | 181 718 131 735 $ US | 68 853 045 416 $ US |
| 1993 | 162 828 808 733 $ US | 60 542 949 249 $ US |
| 1992 | 175 443 091 479 $ US | 67 252 992 737 $ US |
| 1991 | 162 784 113 626 $ US | 61 623 800 825 $ US |
| 1990 | 157 018 155 634 $ US | 59 578 839 405 $ US |
| 1989 | 130 992 629 118 $ US | 47 283 386 375 $ US |
| 1988 | 125 626 371 948 $ US | 44 657 532 598 $ US |
| 1987 | 112 600 253 481 $ US | 39 047 896 169 $ US |
| 1986 | 92 542 898 003 $ US | 31 708 294 727 $ US |
| 1985 | 78 045 086 253 $ US | 24 397 668 263 $ US |
| 1984 | 74 599 745 192 $ US | 22 995 356 578 $ US |
| 1983 | 76 616 167 091 $ US | 23 074 389 459 $ US |
| 1982 | 78 148 994 801 $ US | 23 075 815 923 $ US |
| 1981 | 81 551 200 212 $ US | 25 143 197 684 $ US |
| 1980 | 95 852 206 828 $ US | 28 828 885 344 $ US |
| 1979 | 83 387 729 320 $ US | 23 982 630 983 $ US |
| 1978 | 65 956 646 975 $ US | 18 958 762 437 $ US |
| 1977 | 55 216 125 528 $ US | 16 661 466 156 $ US |
| 1976 | 47 989 441 574 $ US | 13 387 942 778 $ US |
| 1975 | 42 810 922 795 $ US | 11 418 676 622 $ US |
| 1974 | 39 595 393 885 $ US | 10 716 325 824 $ US |
| 1973 | 29 099 110 043 $ US | 8 127 808 701 $ US |
| 1972 | 21 388 128 261 $ US | 6 036 690 874 $ US |
| 1971 | 18 597 748 747 $ US | 4 883 423 835 $ US |
| 1970 | 16 429 307 847 $ US | 4 222 755 226 $ US |
| 1969 | 13 496 027 480 $ US | - |
En 2025, les importations de biens et services des Pays-Bas s'élevaient à 926 milliards de dollars et celles de l'Autriche à 303 milliards de dollars : celles des Pays-Bas étaient 3,1 fois plus élevées. En 1970, les importations des Pays-Bas étaient 3,9 fois plus élevées : 16,4 milliards de dollars pour les Pays-Bas et 4,22 milliards de dollars pour l'Autriche.
Les importations de biens et services des Pays-Bas sont supérieures à celles de l'Autriche chaque année depuis 1970.
Pays-Bas vs Autriche : chiffres des importations
|
Pays-Bas
|
Autriche
|
|
|---|---|---|
| Importations | 926 Md $US (2025) | 303 Md $US (2025) |
| Rang mondial | 8/174 | 30/174 |
| Part mondiale | 2,74 % | 0,9 % |
| % du PIB | 69,5 % | 52,3 % |
| Première catégorie de biens | Machines, électronique et véhicules (36,4 %, 2025) | Machines, électronique et véhicules (38,8 %, 2025) |
| Première origine des biens | Allemagne (16,9 %, 2025) | Allemagne (39,2 %, 2025) |
Comparer les importations de 2 pays au choix
Sources :
- Banque mondiale | Économie et croissance (1969–2025, mis à jour en octobre 2026)
- TradeMap (2001–2025, mis à jour en octobre 2026)
Creative Commons Attribution (CC BY) : vous pouvez copier, partager, adapter et réutiliser ce contenu, y compris à des fins commerciales, à condition de citer statistics.wiki et d’indiquer les modifications apportées. Les sources citées ci-dessus peuvent avoir leurs propres conditions de licence.