
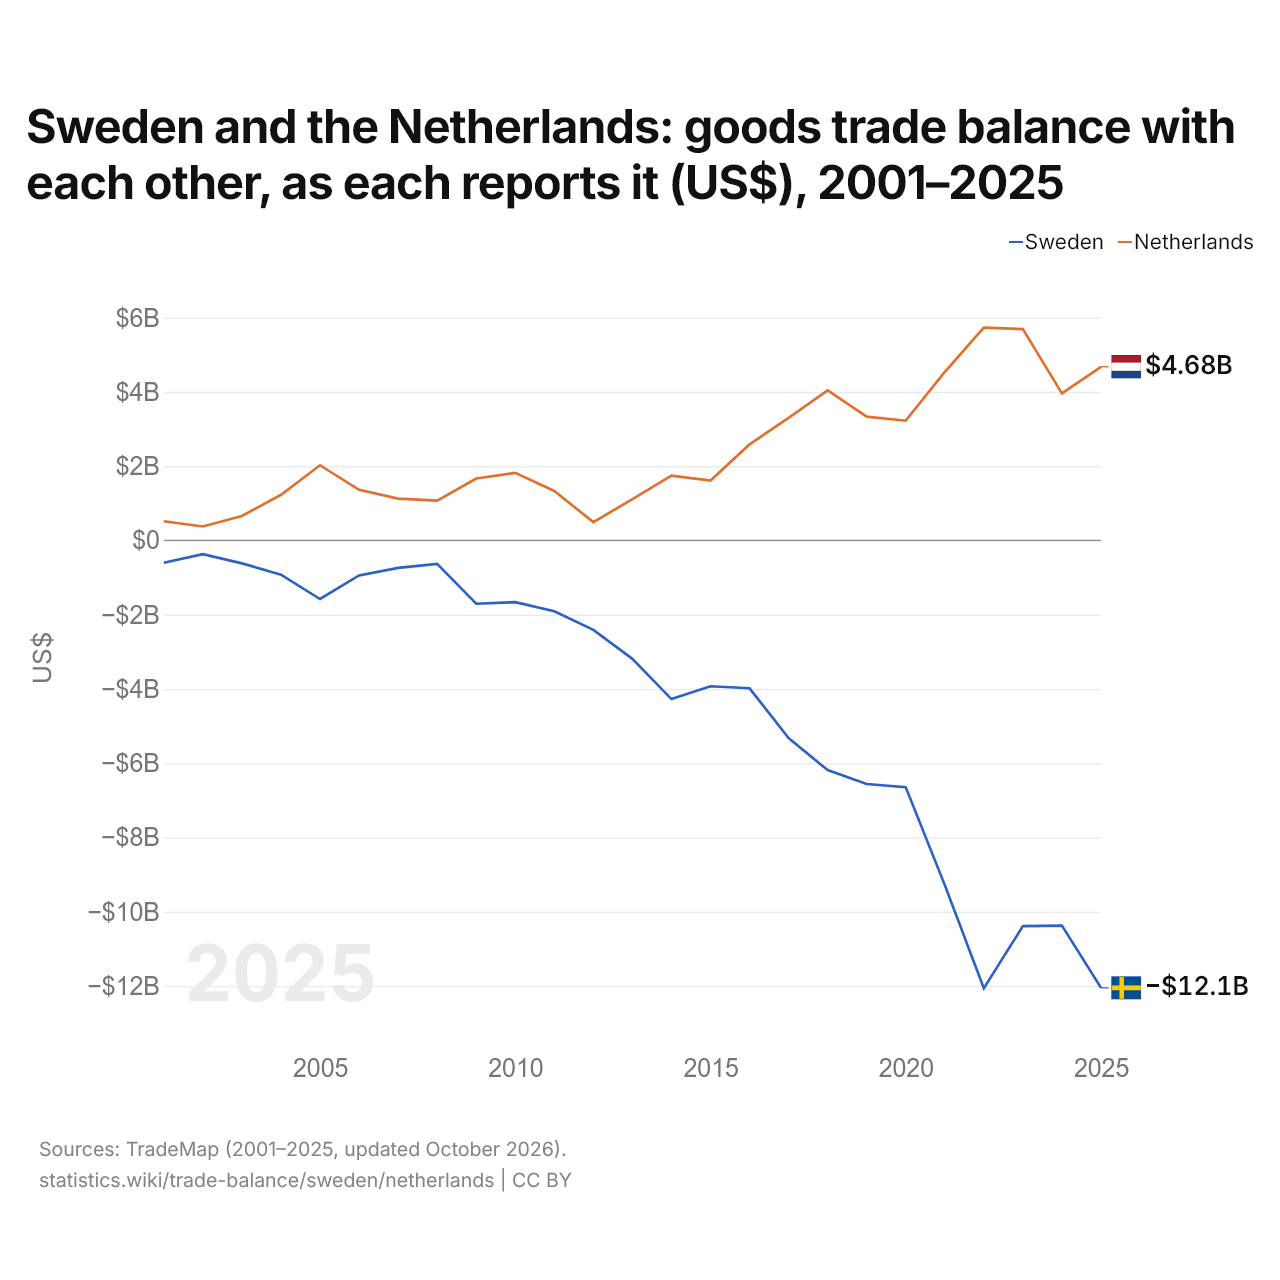
La Suède et les Pays-Bas : solde de leur commerce de biens bilatéral, selon chacun ($ US), 2001–2025
| Année | $ US | |
|---|---|---|
| Suède | Pays-Bas | |
| 2025 | −12 050 100 000 $ US | 4 675 381 000 $ US |
| 2024 | −10 373 429 000 $ US | 3 957 966 000 $ US |
| 2023 | −10 387 243 000 $ US | 5 690 614 000 $ US |
| 2022 | −12 062 732 000 $ US | 5 727 576 000 $ US |
| 2021 | −9 279 776 000 $ US | 4 535 103 000 $ US |
| 2020 | −6 646 100 000 $ US | 3 222 818 000 $ US |
| 2019 | −6 559 719 000 $ US | 3 332 723 000 $ US |
| 2018 | −6 186 912 000 $ US | 4 039 205 000 $ US |
| 2017 | −5 323 860 000 $ US | 3 296 698 000 $ US |
| 2016 | −3 983 105 000 $ US | 2 584 990 000 $ US |
| 2015 | −3 928 951 000 $ US | 1 609 759 000 $ US |
| 2014 | −4 274 312 000 $ US | 1 745 037 000 $ US |
| 2013 | −3 191 456 000 $ US | 1 110 028 000 $ US |
| 2012 | −2 409 371 000 $ US | 490 101 000 $ US |
| 2011 | −1 906 342 000 $ US | 1 329 678 000 $ US |
| 2010 | −1 661 519 000 $ US | 1 817 377 000 $ US |
| 2009 | −1 706 966 000 $ US | 1 665 763 000 $ US |
| 2008 | −633 924 000 $ US | 1 070 694 000 $ US |
| 2007 | −741 472 000 $ US | 1 124 010 000 $ US |
| 2006 | −943 021 000 $ US | 1 362 001 000 $ US |
| 2005 | −1 579 228 000 $ US | 2 023 904 000 $ US |
| 2004 | −923 097 000 $ US | 1 228 757 000 $ US |
| 2003 | −618 792 000 $ US | 657 534 000 $ US |
| 2002 | −372 487 000 $ US | 374 072 000 $ US |
| 2001 | −602 740 000 $ US | 513 927 000 $ US |
En 2025, selon la Suède, son commerce de biens avec les Pays-Bas affichait un déficit de 12,1 milliards de dollars ; selon les Pays-Bas, leur commerce de biens avec la Suède affichait un excédent de 4,68 milliards de dollars. En 2001, les chiffres étaient un déficit de 603 millions de dollars pour la Suède et un excédent de 514 millions de dollars pour les Pays-Bas.
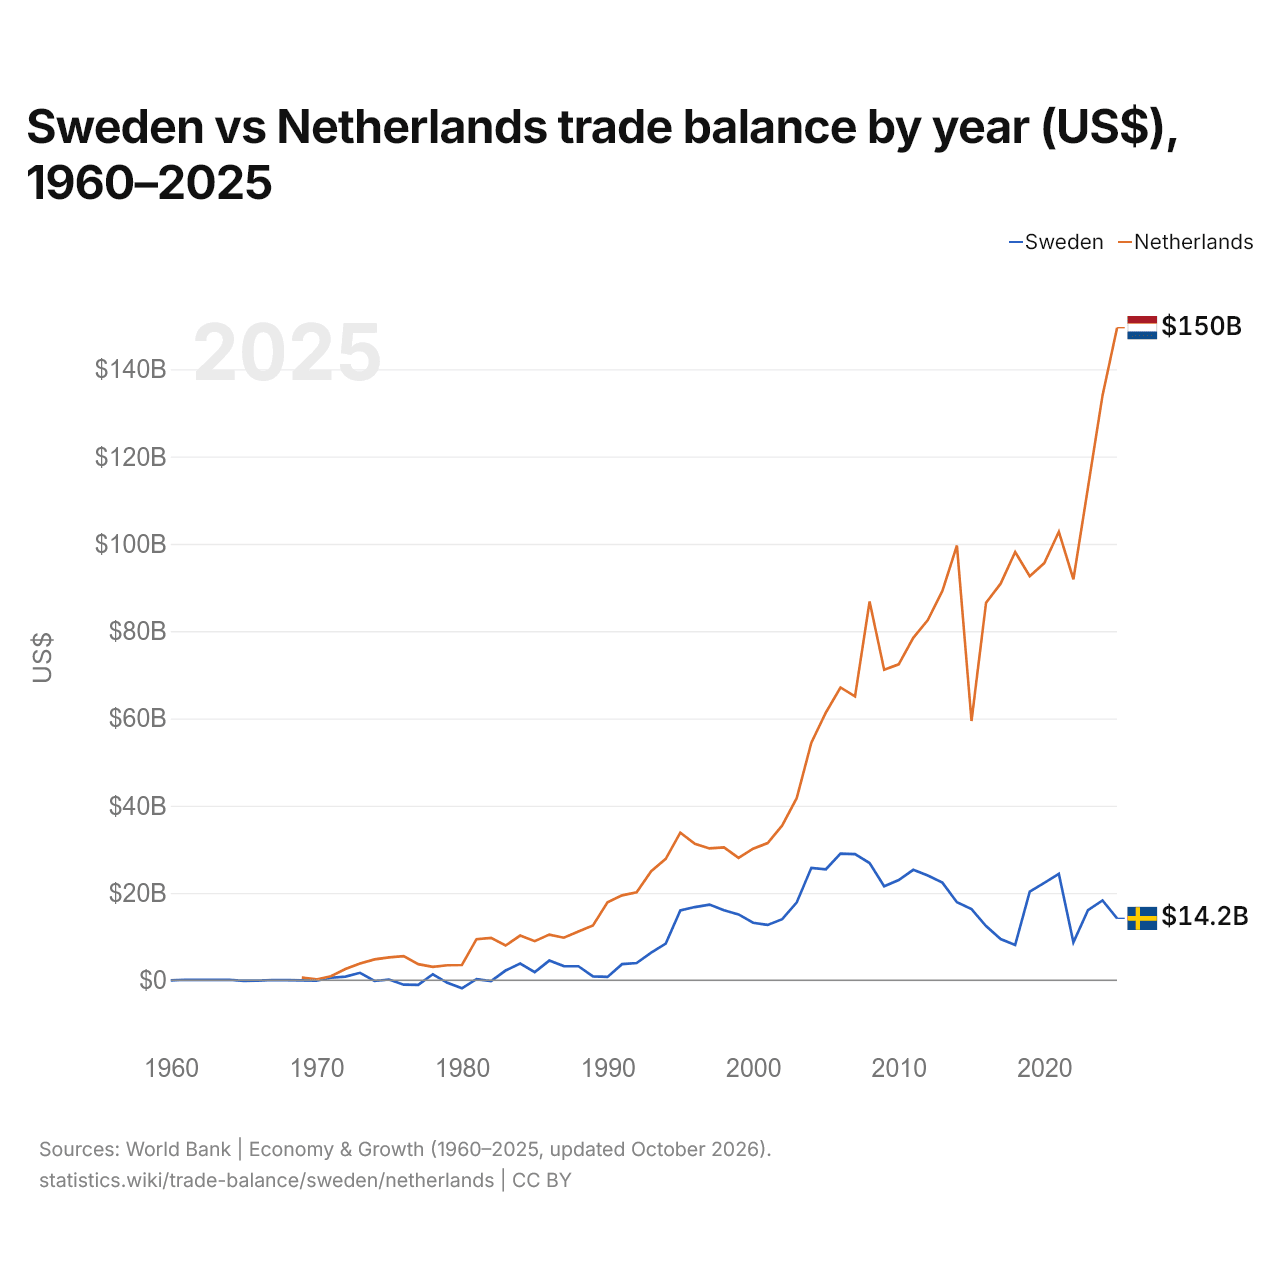
Suède vs Pays-Bas : balance commerciale par année ($ US), 1960–2025
| Année | $ US | |
|---|---|---|
 Suède |
 Pays-Bas |
|
| 2025 | 14 196 128 478 $ US | 149 519 368 722 $ US |
| 2024 | 18 306 837 219 $ US | 134 007 361 075 $ US |
| 2023 | 16 049 897 380 $ US | 112 885 525 975 $ US |
| 2022 | 8 697 233 002 $ US | 91 883 758 920 $ US |
| 2021 | 24 372 223 399 $ US | 102 760 026 360 $ US |
| 2020 | 22 315 755 027 $ US | 95 585 823 574 $ US |
| 2019 | 20 312 952 780 $ US | 92 567 108 267 $ US |
| 2018 | 8 096 272 829 $ US | 98 121 967 356 $ US |
| 2017 | 9 452 136 557 $ US | 90 871 553 835 $ US |
| 2016 | 12 432 154 123 $ US | 86 519 974 912 $ US |
| 2015 | 16 301 315 308 $ US | 59 405 539 190 $ US |
| 2014 | 17 877 691 838 $ US | 99 609 660 307 $ US |
| 2013 | 22 385 421 285 $ US | 89 195 079 396 $ US |
| 2012 | 24 018 541 654 $ US | 82 521 976 395 $ US |
| 2011 | 25 317 610 365 $ US | 78 468 693 473 $ US |
| 2010 | 22 974 879 608 $ US | 72 400 038 600 $ US |
| 2009 | 21 541 587 185 $ US | 71 142 272 210 $ US |
| 2008 | 26 861 980 550 $ US | 86 778 984 923 $ US |
| 2007 | 28 918 299 106 $ US | 65 052 481 087 $ US |
| 2006 | 29 012 631 807 $ US | 67 090 411 938 $ US |
| 2005 | 25 441 383 094 $ US | 61 353 555 872 $ US |
| 2004 | 25 772 156 377 $ US | 54 443 116 593 $ US |
| 2003 | 17 852 664 383 $ US | 41 785 064 886 $ US |
| 2002 | 14 004 991 219 $ US | 35 473 198 312 $ US |
| 2001 | 12 682 227 880 $ US | 31 443 761 454 $ US |
| 2000 | 13 194 320 141 $ US | 30 149 484 438 $ US |
| 1999 | 15 103 238 768 $ US | 28 049 104 555 $ US |
| 1998 | 16 052 151 599 $ US | 30 467 673 850 $ US |
| 1997 | 17 351 373 299 $ US | 30 213 462 842 $ US |
| 1996 | 16 777 214 435 $ US | 31 287 581 699 $ US |
| 1995 | 16 019 373 922 $ US | 33 823 771 617 $ US |
| 1994 | 8 403 317 781 $ US | 27 817 382 250 $ US |
| 1993 | 6 320 502 608 $ US | 24 988 427 860 $ US |
| 1992 | 3 951 423 126 $ US | 20 174 407 268 $ US |
| 1991 | 3 696 628 193 $ US | 19 451 513 437 $ US |
| 1990 | 765 436 406 $ US | 17 883 441 849 $ US |
| 1989 | 900 996 913 $ US | 12 556 469 916 $ US |
| 1988 | 3 219 573 867 $ US | 11 195 472 182 $ US |
| 1987 | 3 256 319 475 $ US | 9 754 287 424 $ US |
| 1986 | 4 508 620 922 $ US | 10 457 692 031 $ US |
| 1985 | 1 866 005 300 $ US | 8 962 418 392 $ US |
| 1984 | 3 828 967 697 $ US | 10 259 458 104 $ US |
| 1983 | 2 235 418 607 $ US | 7 966 659 717 $ US |
| 1982 | −162 813 007 $ US | 9 708 016 011 $ US |
| 1981 | 249 949 836 $ US | 9 423 038 947 $ US |
| 1980 | −1 835 547 570 $ US | 3 500 606 296 $ US |
| 1979 | −592 112 384 $ US | 3 439 706 690 $ US |
| 1978 | 1 384 036 517 $ US | 3 075 533 714 $ US |
| 1977 | −1 053 723 001 $ US | 3 708 195 205 $ US |
| 1976 | −1 007 174 637 $ US | 5 533 782 297 $ US |
| 1975 | 181 173 595 $ US | 5 259 495 469 $ US |
| 1974 | −154 147 182 $ US | 4 786 280 843 $ US |
| 1973 | 1 709 666 842 $ US | 3 843 968 154 $ US |
| 1972 | 834 119 352 $ US | 2 565 120 846 $ US |
| 1971 | 572 532 043 $ US | 940 433 584 $ US |
| 1970 | −66 959 136 $ US | 195 855 604 $ US |
| 1969 | −7 331 231 $ US | 611 798 612 $ US |
| 1968 | 38 934 046 $ US | - |
| 1967 | 72 387 548 $ US | - |
| 1966 | −88 089 598 $ US | - |
| 1965 | −120 298 999 $ US | - |
| 1964 | 120 311 370 $ US | - |
| 1963 | 107 403 524 $ US | - |
| 1962 | 114 250 337 $ US | - |
| 1961 | 127 693 054 $ US | - |
| 1960 | −37 486 009 $ US | - |
En 2025, la balance commerciale de la Suède affichait un excédent de 14,2 milliards de dollars et celle des Pays-Bas un excédent de 150 milliards de dollars ; l'excédent des Pays-Bas était 11 fois plus grand. En 1969, la balance commerciale de la Suède affichait un déficit de 7,33 millions de dollars et celle des Pays-Bas un excédent de 612 millions de dollars.
De 1969 à 2025, la balance commerciale de la Suède a été excédentaire pendant 49 des 57 années, et celle des Pays-Bas chacune d'elles. Les balances commerciales de la Suède et des Pays-Bas n'ont jamais été déficitaires la même année.
Suède vs Pays-Bas : chiffres de la balance commerciale
|
Suède
|
Pays-Bas
|
|
|---|---|---|
| Biens et services, $ US | +14,2 Md $US (2025) | +150 Md $US (2025) |
| % du PIB | +2,1 % (2025) | +11,2 % (2025) |
| Années d'excédent depuis 2000 | 26 sur 26 | 26 sur 26 |
| Solde des biens entre les deux, chiffres propres | −12,1 Md $US (2025) | +4,68 Md $US (2025) |
| Premier excédent en biens avec | États-Unis (+7,89 Md $US, 2025) | Allemagne (+52,4 Md $US, 2025) |
| Premier déficit en biens avec | Pays-Bas (−12,1 Md $US, 2025) | Chine (−33,7 Md $US, 2025) |
Comparer la balance commerciale de 2 pays au choix
Sources :
- Banque mondiale | Économie et croissance (1960–2025, mis à jour en octobre 2026)
- TradeMap (2001–2025, mis à jour en octobre 2026)
Creative Commons Attribution (CC BY) : vous pouvez copier, partager, adapter et réutiliser ce contenu, y compris à des fins commerciales, à condition de citer statistics.wiki et d’indiquer les modifications apportées. Les sources citées ci-dessus peuvent avoir leurs propres conditions de licence.