
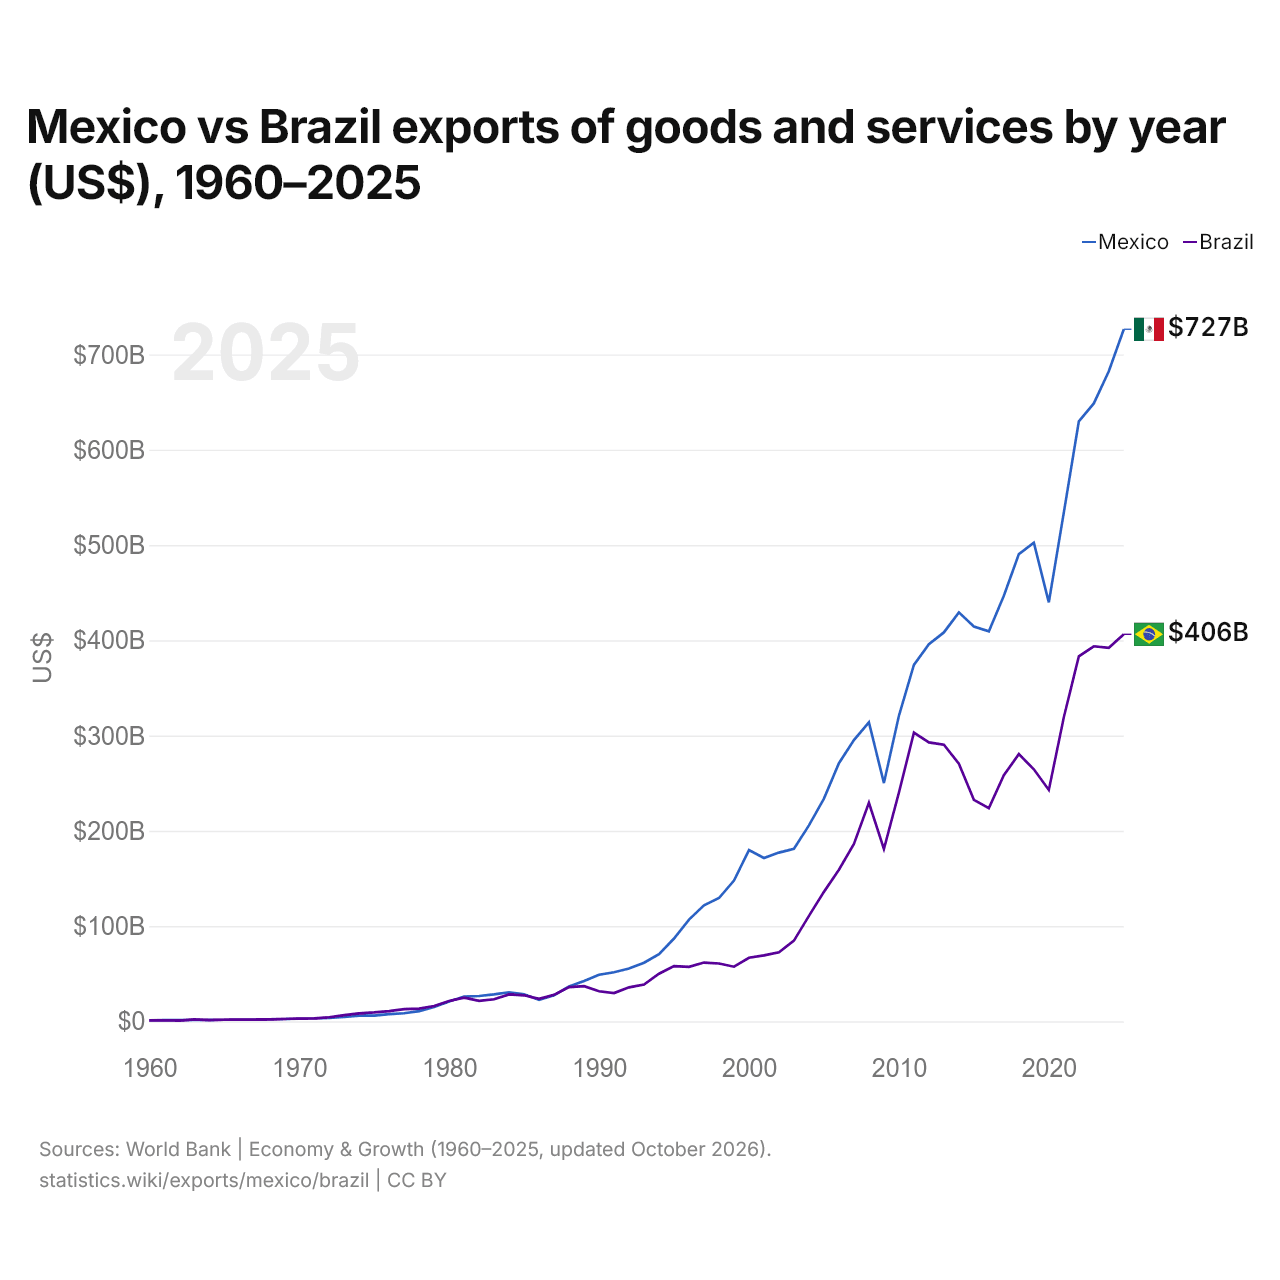
Mexique vs Brésil : exportations de biens et services par année ($ US), 1960–2025
| Année | $ US | |
|---|---|---|
 Mexique |
 Brésil |
|
| 2025 | 726 556 896 247 $ US | 406 298 241 937 $ US |
| 2024 | 682 472 609 894 $ US | 392 105 346 047 $ US |
| 2023 | 648 642 274 777 $ US | 393 731 572 888 $ US |
| 2022 | 629 788 673 074 $ US | 383 177 602 116 $ US |
| 2021 | 534 121 610 565 $ US | 319 251 201 403 $ US |
| 2020 | 439 853 932 828 $ US | 242 872 071 018 $ US |
| 2019 | 502 467 566 320 $ US | 264 562 979 421 $ US |
| 2018 | 490 508 969 545 $ US | 280 543 266 303 $ US |
| 2017 | 446 688 309 687 $ US | 258 330 777 007 $ US |
| 2016 | 409 476 294 705 $ US | 223 863 343 103 $ US |
| 2015 | 414 495 031 034 $ US | 232 488 824 445 $ US |
| 2014 | 429 314 956 761 $ US | 270 458 130 850 $ US |
| 2013 | 408 263 658 324 $ US | 290 364 173 325 $ US |
| 2012 | 395 854 929 793 $ US | 292 808 395 454 $ US |
| 2011 | 374 148 226 662 $ US | 303 016 626 326 $ US |
| 2010 | 320 766 037 581 $ US | 240 003 137 742 $ US |
| 2009 | 250 136 106 516 $ US | 180 891 970 354 $ US |
| 2008 | 313 852 456 087 $ US | 229 517 035 698 $ US |
| 2007 | 295 222 517 229 $ US | 186 202 879 575 $ US |
| 2006 | 270 928 816 793 $ US | 159 213 742 532 $ US |
| 2005 | 233 862 215 739 $ US | 135 919 140 236 $ US |
| 2004 | 205 711 767 188 $ US | 110 739 032 053 $ US |
| 2003 | 181 095 388 469 $ US | 84 744 257 516 $ US |
| 2002 | 177 144 829 752 $ US | 72 546 876 638 $ US |
| 2001 | 171 481 946 818 $ US | 69 279 555 096 $ US |
| 2000 | 179 810 168 051 $ US | 66 777 380 518 $ US |
| 1999 | 147 818 774 072 $ US | 57 355 149 556 $ US |
| 1998 | 129 452 220 228 $ US | 60 723 187 855 $ US |
| 1997 | 121 731 183 210 $ US | 61 680 024 620 $ US |
| 1996 | 106 842 978 990 $ US | 57 235 482 141 $ US |
| 1995 | 86 926 529 245 $ US | 57 922 124 038 $ US |
| 1994 | 70 611 769 311 $ US | 49 978 798 948 $ US |
| 1993 | 61 477 360 985 $ US | 38 682 712 856 $ US |
| 1992 | 55 406 062 494 $ US | 35 668 919 611 $ US |
| 1991 | 51 459 461 044 $ US | 29 723 863 636 $ US |
| 1990 | 48 866 118 135 $ US | 31 556 066 667 $ US |
| 1989 | 42 359 282 023 $ US | 36 878 468 232 $ US |
| 1988 | 36 496 678 772 $ US | 35 921 688 764 $ US |
| 1987 | 27 349 325 162 $ US | 27 820 190 341 $ US |
| 1986 | 22 446 879 807 $ US | 23 640 555 933 $ US |
| 1985 | 28 439 428 976 $ US | 27 305 943 481 $ US |
| 1984 | 30 521 772 291 $ US | 28 317 692 073 $ US |
| 1983 | 28 289 706 397 $ US | 23 221 079 049 $ US |
| 1982 | 26 632 371 193 $ US | 21 435 129 573 $ US |
| 1981 | 26 014 603 304 $ US | 24 828 388 399 $ US |
| 1980 | 20 850 899 743 $ US | 21 276 141 968 $ US |
| 1979 | 15 052 992 765 $ US | 16 026 612 550 $ US |
| 1978 | 10 748 302 367 $ US | 13 404 621 905 $ US |
| 1977 | 8 452 576 086 $ US | 12 776 590 679 $ US |
| 1976 | 7 545 416 829 $ US | 10 741 988 183 $ US |
| 1975 | 6 067 120 000 $ US | 9 325 921 437 $ US |
| 1974 | 6 054 240 000 $ US | 8 424 673 828 $ US |
| 1973 | 4 650 160 000 $ US | 6 557 708 238 $ US |
| 1972 | 3 643 200 000 $ US | 4 249 449 496 $ US |
| 1971 | 2 995 040 000 $ US | 3 155 632 739 $ US |
| 1970 | 2 754 440 000 $ US | 2 975 391 707 $ US |
| 1969 | 2 451 096 000 $ US | 2 479 930 322 $ US |
| 1968 | 2 066 336 000 $ US | 2 032 731 103 $ US |
| 1967 | 1 824 072 000 $ US | 1 764 834 055 $ US |
| 1966 | 1 816 952 000 $ US | 1 846 958 712 $ US |
| 1965 | 1 667 320 000 $ US | 1 685 625 122 $ US |
| 1964 | 1 532 720 000 $ US | 1 354 466 135 $ US |
| 1963 | 1 411 096 000 $ US | 2 080 325 262 $ US |
| 1962 | 1 302 504 000 $ US | 770 900 520 $ US |
| 1961 | 1 191 208 000 $ US | 1 109 152 823 $ US |
| 1960 | 1 109 120 000 $ US | 1 069 822 094 $ US |
En 2025, les exportations de biens et services du Mexique s'élevaient à 727 milliards de dollars et celles du Brésil à 406 milliards de dollars : celles du Mexique étaient 1,8 fois plus élevées. En 1960, les exportations du Mexique étaient supérieures de 3,7 % : 1,11 milliard de dollars pour le Mexique et 1,07 milliard de dollars pour le Brésil.
Les exportations de biens et services du Mexique sont supérieures à celles du Brésil chaque année depuis 1988.
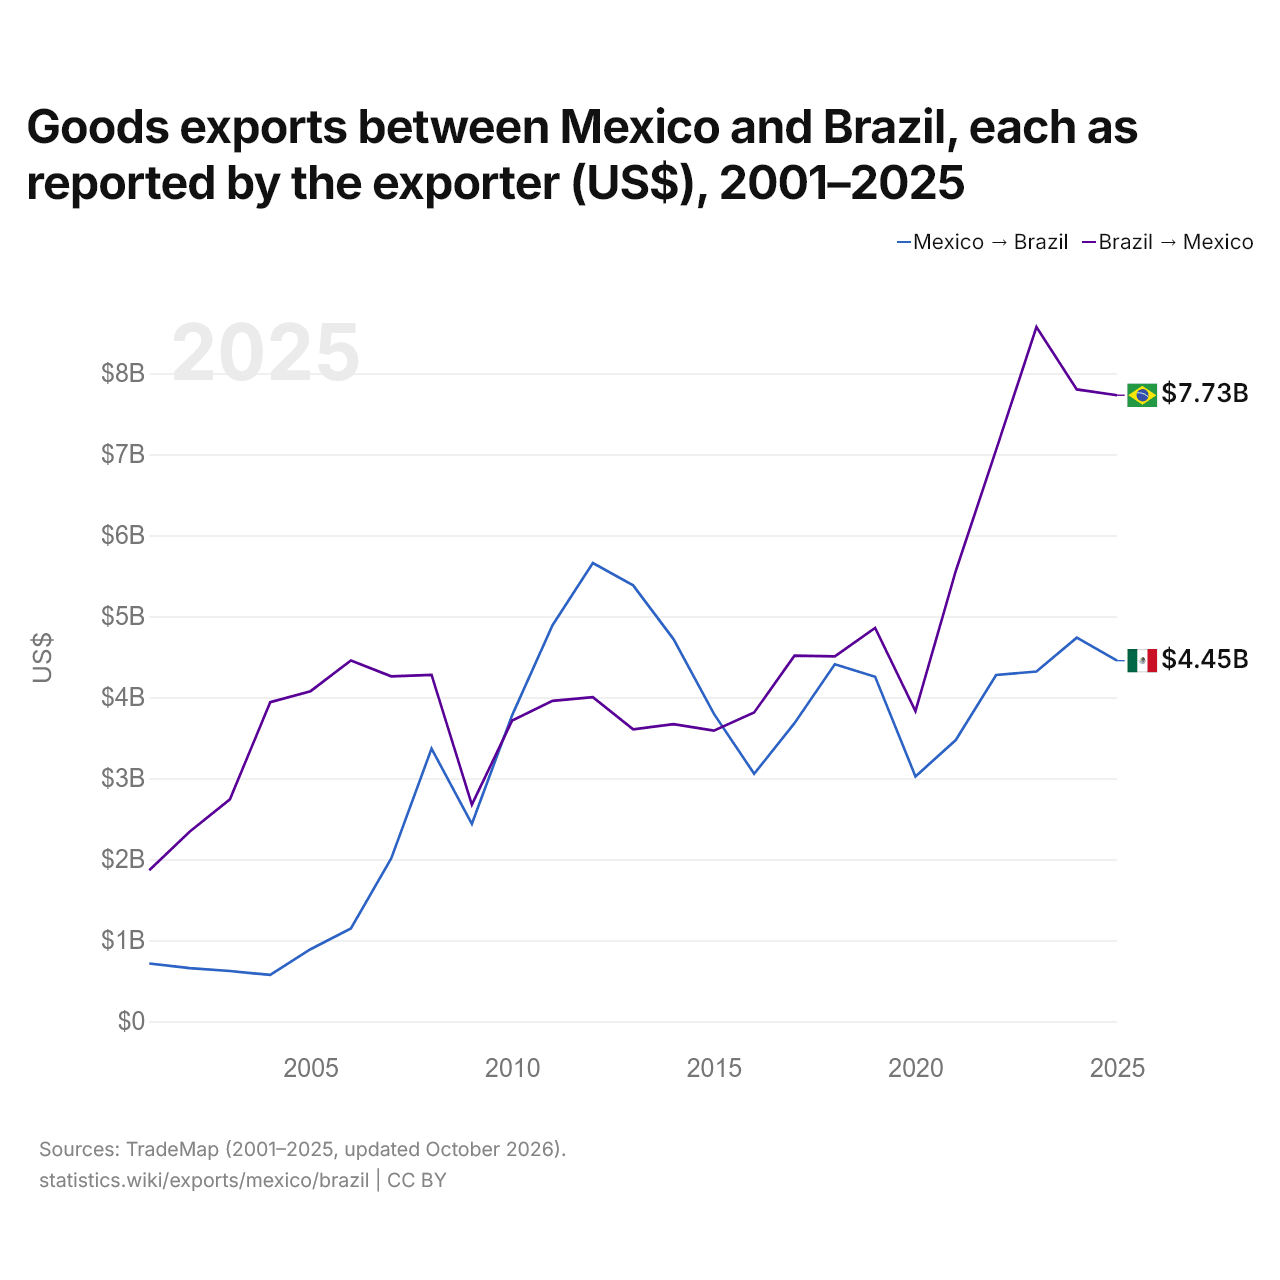
Exportations de biens entre le Mexique et le Brésil, selon chaque exportateur ($ US), 2001–2025
| Année | $ US | |
|---|---|---|
| Mexique → Brésil | Brésil → Mexique | |
| 2025 | 4 452 741 000 $ US | 7 730 096 000 $ US |
| 2024 | 4 737 610 000 $ US | 7 802 032 000 $ US |
| 2023 | 4 318 754 000 $ US | 8 571 678 000 $ US |
| 2022 | 4 276 292 000 $ US | 7 055 354 000 $ US |
| 2021 | 3 472 956 000 $ US | 5 560 487 000 $ US |
| 2020 | 3 023 478 000 $ US | 3 829 385 000 $ US |
| 2019 | 4 253 701 000 $ US | 4 856 980 000 $ US |
| 2018 | 4 407 881 000 $ US | 4 505 140 000 $ US |
| 2017 | 3 681 328 000 $ US | 4 514 103 000 $ US |
| 2016 | 3 055 948 000 $ US | 3 813 344 000 $ US |
| 2015 | 3 798 814 000 $ US | 3 588 346 000 $ US |
| 2014 | 4 718 981 000 $ US | 3 668 565 000 $ US |
| 2013 | 5 382 926 000 $ US | 3 604 587 000 $ US |
| 2012 | 5 657 554 000 $ US | 4 002 462 000 $ US |
| 2011 | 4 891 226 000 $ US | 3 956 543 000 $ US |
| 2010 | 3 781 080 000 $ US | 3 714 482 000 $ US |
| 2009 | 2 438 208 000 $ US | 2 674 595 000 $ US |
| 2008 | 3 366 874 000 $ US | 4 278 344 000 $ US |
| 2007 | 2 010 046 000 $ US | 4 259 403 000 $ US |
| 2006 | 1 147 290 000 $ US | 4 455 575 000 $ US |
| 2005 | 890 236 000 $ US | 4 076 225 000 $ US |
| 2004 | 572 643 000 $ US | 3 940 170 000 $ US |
| 2003 | 620 976 000 $ US | 2 740 366 000 $ US |
| 2002 | 657 550 000 $ US | 2 340 990 000 $ US |
| 2001 | 713 648 000 $ US | 1 866 454 000 $ US |
En 2025, les exportations de biens du Mexique vers le Brésil, selon le Mexique, s'élevaient à 4,45 milliards de dollars, et celles du Brésil vers le Mexique, selon le Brésil, à 7,73 milliards de dollars : 1,7 fois plus pour celles du Brésil. En 2001, elles s'élevaient à 714 millions de dollars pour le Mexique et à 1,87 milliard de dollars pour le Brésil.
Mexique vs Brésil : chiffres des exportations
|
Mexique
|
Brésil
|
|
|---|---|---|
| Exportations | 727 Md $US (2025) | 406 Md $US (2025) |
| Rang mondial | 15/176 | 25/176 |
| Part mondiale | 2,08 % | 1,16 % |
| % du PIB | 39,6 % | 17,8 % |
| Première catégorie de biens | Machines, électronique et véhicules (70,3 %, 2025) | Pétrole, gaz, minerais et autres matières premières (28,9 %, 2025) |
| Première destination des biens | États-Unis (81,9 %, 2025) | Chine (28,7 %, 2025) |
Comparer les exportations de 2 pays au choix
Sources :
- Banque mondiale | Économie et croissance (1960–2025, mis à jour en octobre 2026)
- TradeMap (2001–2025, mis à jour en octobre 2026)
Creative Commons Attribution (CC BY) : vous pouvez copier, partager, adapter et réutiliser ce contenu, y compris à des fins commerciales, à condition de citer statistics.wiki et d’indiquer les modifications apportées. Les sources citées ci-dessus peuvent avoir leurs propres conditions de licence.