
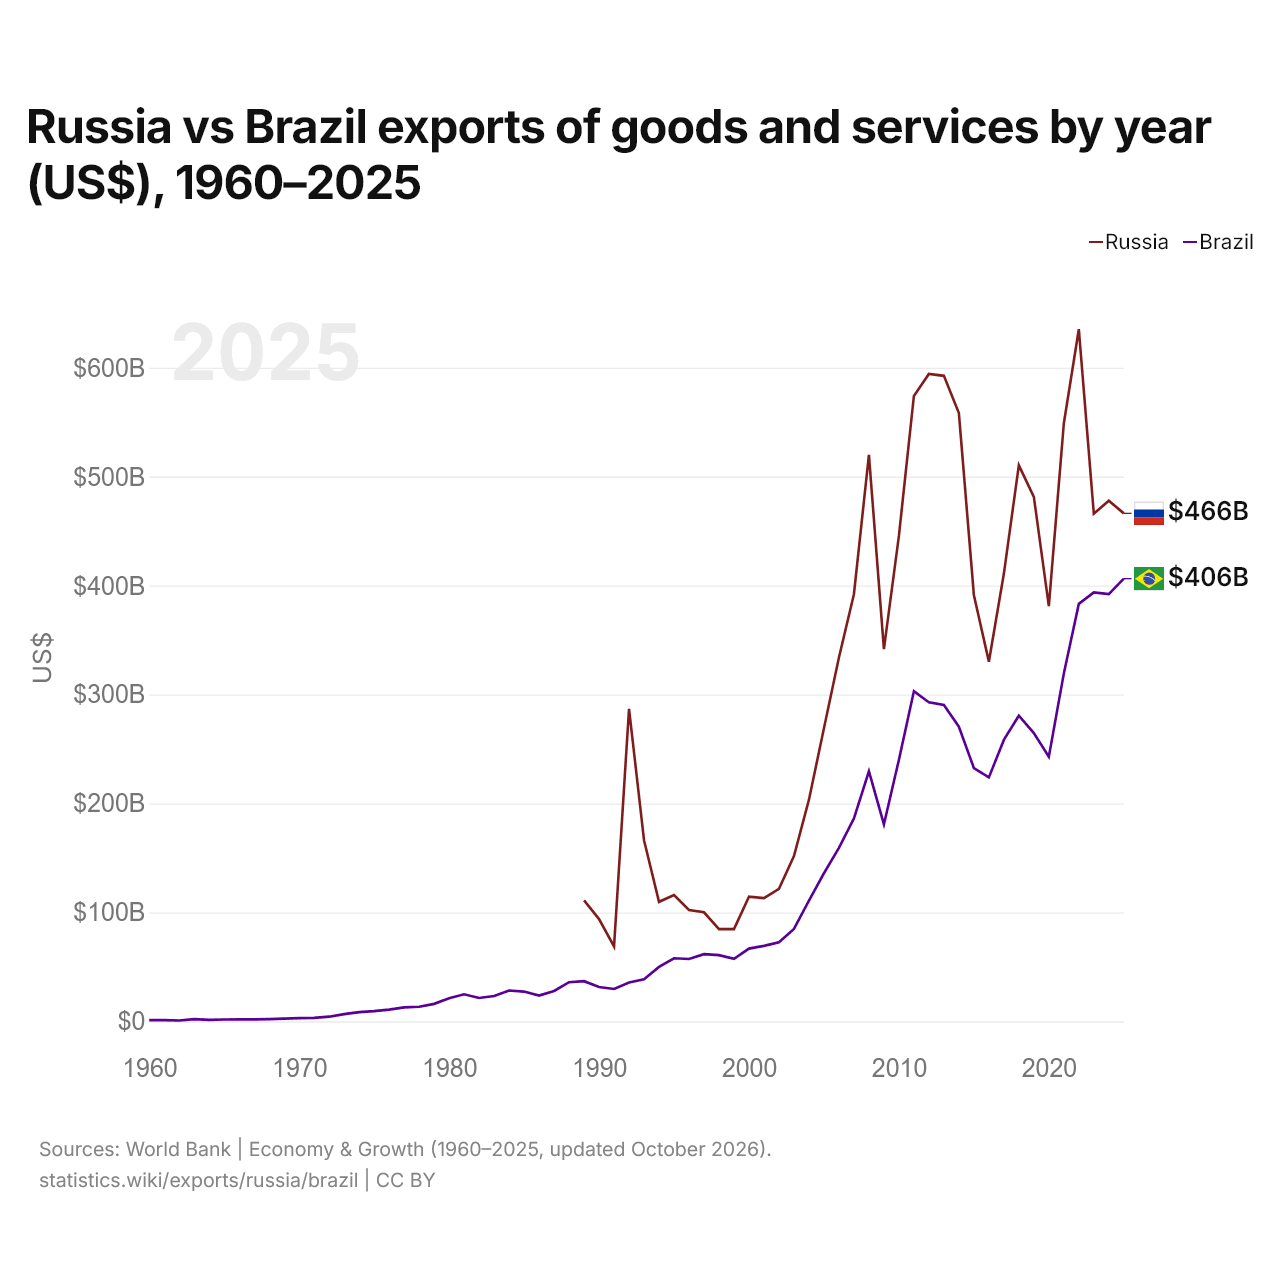
Russie vs Brésil : exportations de biens et services par année ($ US), 1960–2025
| Année | $ US | |
|---|---|---|
 Russie |
 Brésil |
|
| 2025 | 466 237 273 304 $ US | 406 298 241 937 $ US |
| 2024 | 477 881 194 057 $ US | 392 105 346 047 $ US |
| 2023 | 465 937 815 839 $ US | 393 731 572 888 $ US |
| 2022 | 635 241 831 701 $ US | 383 177 602 116 $ US |
| 2021 | 548 800 273 711 $ US | 319 251 201 403 $ US |
| 2020 | 381 065 599 584 $ US | 242 872 071 018 $ US |
| 2019 | 481 410 680 627 $ US | 264 562 979 421 $ US |
| 2018 | 510 345 505 267 $ US | 280 543 266 303 $ US |
| 2017 | 410 722 481 425 $ US | 258 330 777 007 $ US |
| 2016 | 330 106 509 740 $ US | 223 863 343 103 $ US |
| 2015 | 391 365 600 741 $ US | 232 488 824 445 $ US |
| 2014 | 558 282 985 966 $ US | 270 458 130 850 $ US |
| 2013 | 592 496 613 390 $ US | 290 364 173 325 $ US |
| 2012 | 594 192 620 576 $ US | 292 808 395 454 $ US |
| 2011 | 573 991 024 064 $ US | 303 016 626 326 $ US |
| 2010 | 445 512 969 857 $ US | 240 003 137 742 $ US |
| 2009 | 341 584 048 926 $ US | 180 891 970 354 $ US |
| 2008 | 520 004 224 863 $ US | 229 517 035 698 $ US |
| 2007 | 392 043 343 369 $ US | 186 202 879 575 $ US |
| 2006 | 333 908 794 240 $ US | 159 213 742 532 $ US |
| 2005 | 268 957 047 129 $ US | 135 919 140 236 $ US |
| 2004 | 203 415 480 736 $ US | 110 739 032 053 $ US |
| 2003 | 151 697 387 188 $ US | 84 744 257 516 $ US |
| 2002 | 121 649 122 807 $ US | 72 546 876 638 $ US |
| 2001 | 113 116 215 290 $ US | 69 279 555 096 $ US |
| 2000 | 114 429 434 767 $ US | 66 777 380 518 $ US |
| 1999 | 84 670 999 188 $ US | 57 355 149 556 $ US |
| 1998 | 84 595 569 294 $ US | 60 723 187 855 $ US |
| 1997 | 100 138 288 678 $ US | 61 680 024 620 $ US |
| 1996 | 102 134 384 267 $ US | 57 235 482 141 $ US |
| 1995 | 115 848 931 222 $ US | 57 922 124 038 $ US |
| 1994 | 109 667 054 790 $ US | 49 978 798 948 $ US |
| 1993 | 166 221 968 544 $ US | 38 682 712 856 $ US |
| 1992 | 286 864 406 780 $ US | 35 668 919 611 $ US |
| 1991 | 68 740 740 741 $ US | 29 723 863 636 $ US |
| 1990 | 93 900 481 541 $ US | 31 556 066 667 $ US |
| 1989 | 110 963 748 895 $ US | 36 878 468 232 $ US |
| 1988 | - | 35 921 688 764 $ US |
| 1987 | - | 27 820 190 341 $ US |
| 1986 | - | 23 640 555 933 $ US |
| 1985 | - | 27 305 943 481 $ US |
| 1984 | - | 28 317 692 073 $ US |
| 1983 | - | 23 221 079 049 $ US |
| 1982 | - | 21 435 129 573 $ US |
| 1981 | - | 24 828 388 399 $ US |
| 1980 | - | 21 276 141 968 $ US |
| 1979 | - | 16 026 612 550 $ US |
| 1978 | - | 13 404 621 905 $ US |
| 1977 | - | 12 776 590 679 $ US |
| 1976 | - | 10 741 988 183 $ US |
| 1975 | - | 9 325 921 437 $ US |
| 1974 | - | 8 424 673 828 $ US |
| 1973 | - | 6 557 708 238 $ US |
| 1972 | - | 4 249 449 496 $ US |
| 1971 | - | 3 155 632 739 $ US |
| 1970 | - | 2 975 391 707 $ US |
| 1969 | - | 2 479 930 322 $ US |
| 1968 | - | 2 032 731 103 $ US |
| 1967 | - | 1 764 834 055 $ US |
| 1966 | - | 1 846 958 712 $ US |
| 1965 | - | 1 685 625 122 $ US |
| 1964 | - | 1 354 466 135 $ US |
| 1963 | - | 2 080 325 262 $ US |
| 1962 | - | 770 900 520 $ US |
| 1961 | - | 1 109 152 823 $ US |
| 1960 | - | 1 069 822 094 $ US |
En 2025, les exportations de biens et services de la Russie s'élevaient à 466 milliards de dollars et celles du Brésil à 406 milliards de dollars : celles de la Russie étaient supérieures de 15 %. En 1989, les exportations de la Russie étaient 3,0 fois plus élevées : 111 milliards de dollars pour la Russie et 36,9 milliards de dollars pour le Brésil.
Les exportations de biens et services de la Russie sont supérieures à celles du Brésil chaque année depuis 1989.
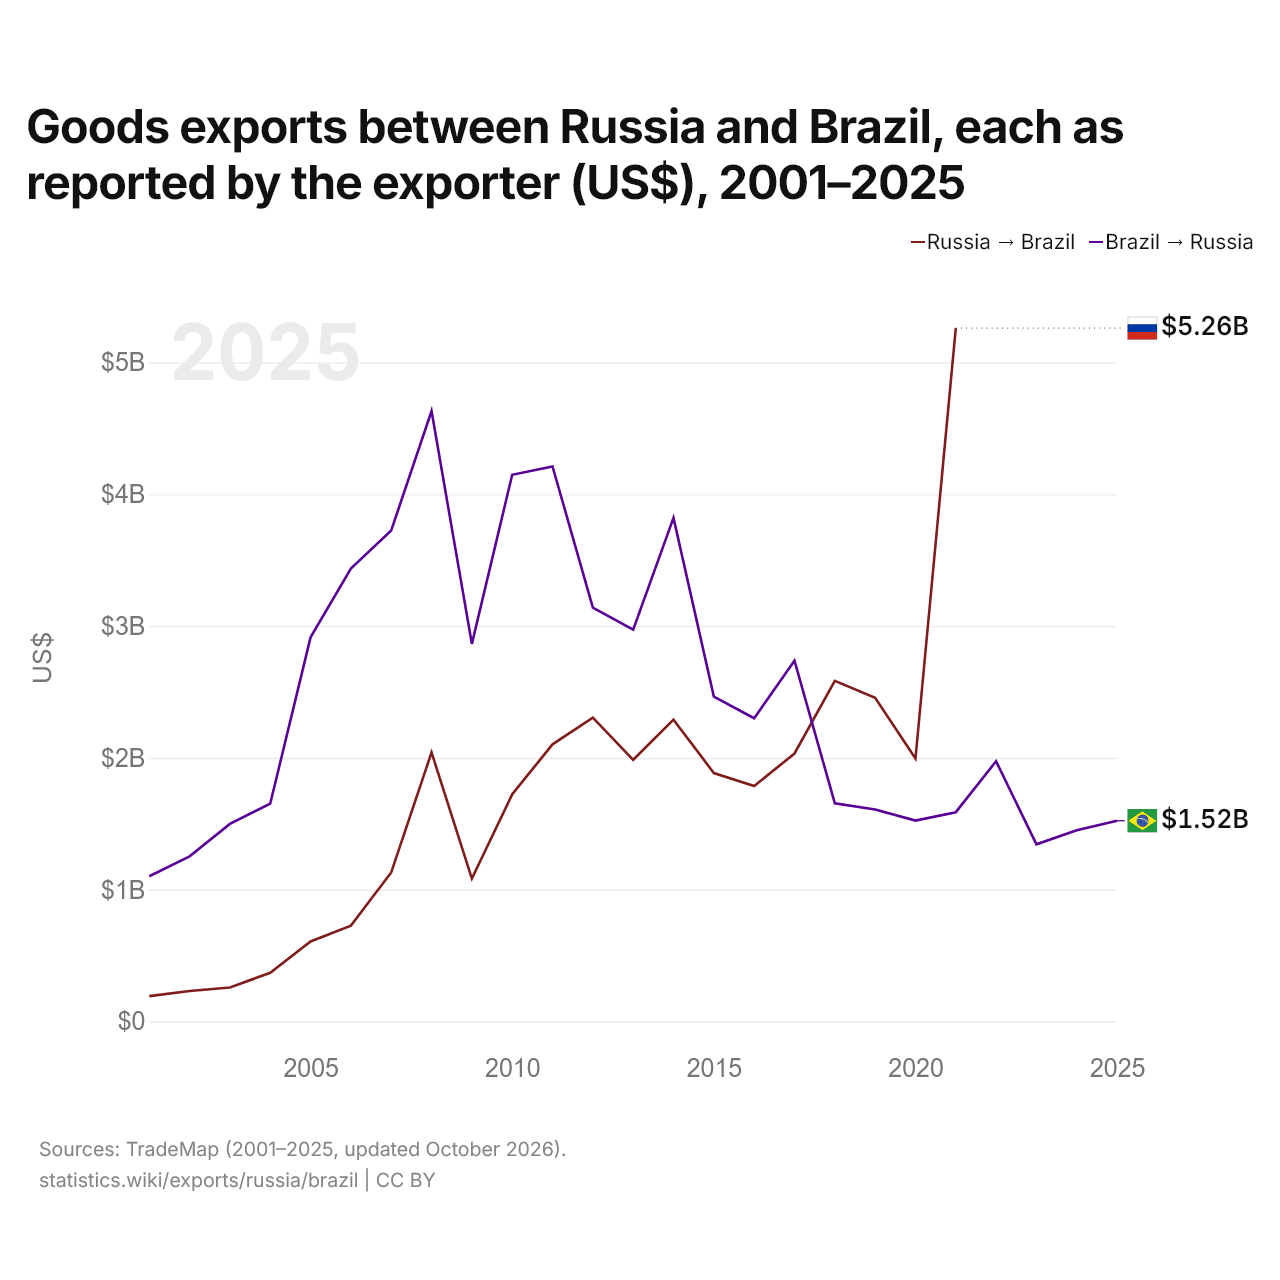
Exportations de biens entre la Russie et le Brésil, selon chaque exportateur ($ US), 2001–2025
| Année | $ US | |
|---|---|---|
| Russie → Brésil | Brésil → Russie | |
| 2025 | - | 1 522 597 000 $ US |
| 2024 | - | 1 450 041 000 $ US |
| 2023 | - | 1 343 314 000 $ US |
| 2022 | - | 1 973 629 000 $ US |
| 2021 | 5 261 220 000 $ US | 1 587 205 000 $ US |
| 2020 | 1 994 237 000 $ US | 1 523 730 000 $ US |
| 2019 | 2 454 835 000 $ US | 1 607 828 000 $ US |
| 2018 | 2 584 351 000 $ US | 1 655 276 000 $ US |
| 2017 | 2 032 493 000 $ US | 2 736 532 000 $ US |
| 2016 | 1 785 571 000 $ US | 2 299 894 000 $ US |
| 2015 | 1 884 738 000 $ US | 2 464 430 000 $ US |
| 2014 | 2 289 530 000 $ US | 3 821 011 000 $ US |
| 2013 | 1 984 660 000 $ US | 2 972 651 000 $ US |
| 2012 | 2 304 867 000 $ US | 3 139 765 000 $ US |
| 2011 | 2 102 530 000 $ US | 4 210 902 000 $ US |
| 2010 | 1 722 941 000 $ US | 4 147 691 000 $ US |
| 2009 | 1 083 000 000 $ US | 2 865 000 000 $ US |
| 2008 | 2 040 699 000 $ US | 4 631 439 000 $ US |
| 2007 | 1 129 761 000 $ US | 3 725 109 000 $ US |
| 2006 | 725 852 000 $ US | 3 435 715 000 $ US |
| 2005 | 605 634 000 $ US | 2 913 724 000 $ US |
| 2004 | 368 603 000 $ US | 1 651 987 000 $ US |
| 2003 | 256 848 000 $ US | 1 498 306 000 $ US |
| 2002 | 229 980 000 $ US | 1 251 491 000 $ US |
| 2001 | 191 162 000 $ US | 1 100 947 000 $ US |
Les exportations de biens de la Russie vers le Brésil, selon la Russie, s'élevaient à 5,26 milliards de dollars, et celles du Brésil vers la Russie, selon le Brésil, à 1,59 milliard de dollars : 3,3 fois plus pour celles de la Russie. En 2001, elles s'élevaient à 191 millions de dollars pour la Russie et à 1,1 milliard de dollars pour le Brésil.
Russie vs Brésil : chiffres des exportations
|
Russie
|
Brésil
|
|
|---|---|---|
| Exportations | 466 Md $US (2025) | 406 Md $US (2025) |
| Rang mondial | 22/176 | 25/176 |
| Part mondiale | 1,34 % | 1,16 % |
| % du PIB | 18,2 % | 17,8 % |
| Première catégorie de biens | Pétrole, gaz, minerais et autres matières premières (49,1 %, 2021) | Pétrole, gaz, minerais et autres matières premières (28,9 %, 2025) |
| Première destination des biens | Chine (14 %, 2021) | Chine (28,7 %, 2025) |
Comparer les exportations de 2 pays au choix
Sources :
- Banque mondiale | Économie et croissance (1960–2025, mis à jour en octobre 2026)
- TradeMap (2001–2025, mis à jour en octobre 2026)
Creative Commons Attribution (CC BY) : vous pouvez copier, partager, adapter et réutiliser ce contenu, y compris à des fins commerciales, à condition de citer statistics.wiki et d’indiquer les modifications apportées. Les sources citées ci-dessus peuvent avoir leurs propres conditions de licence.