
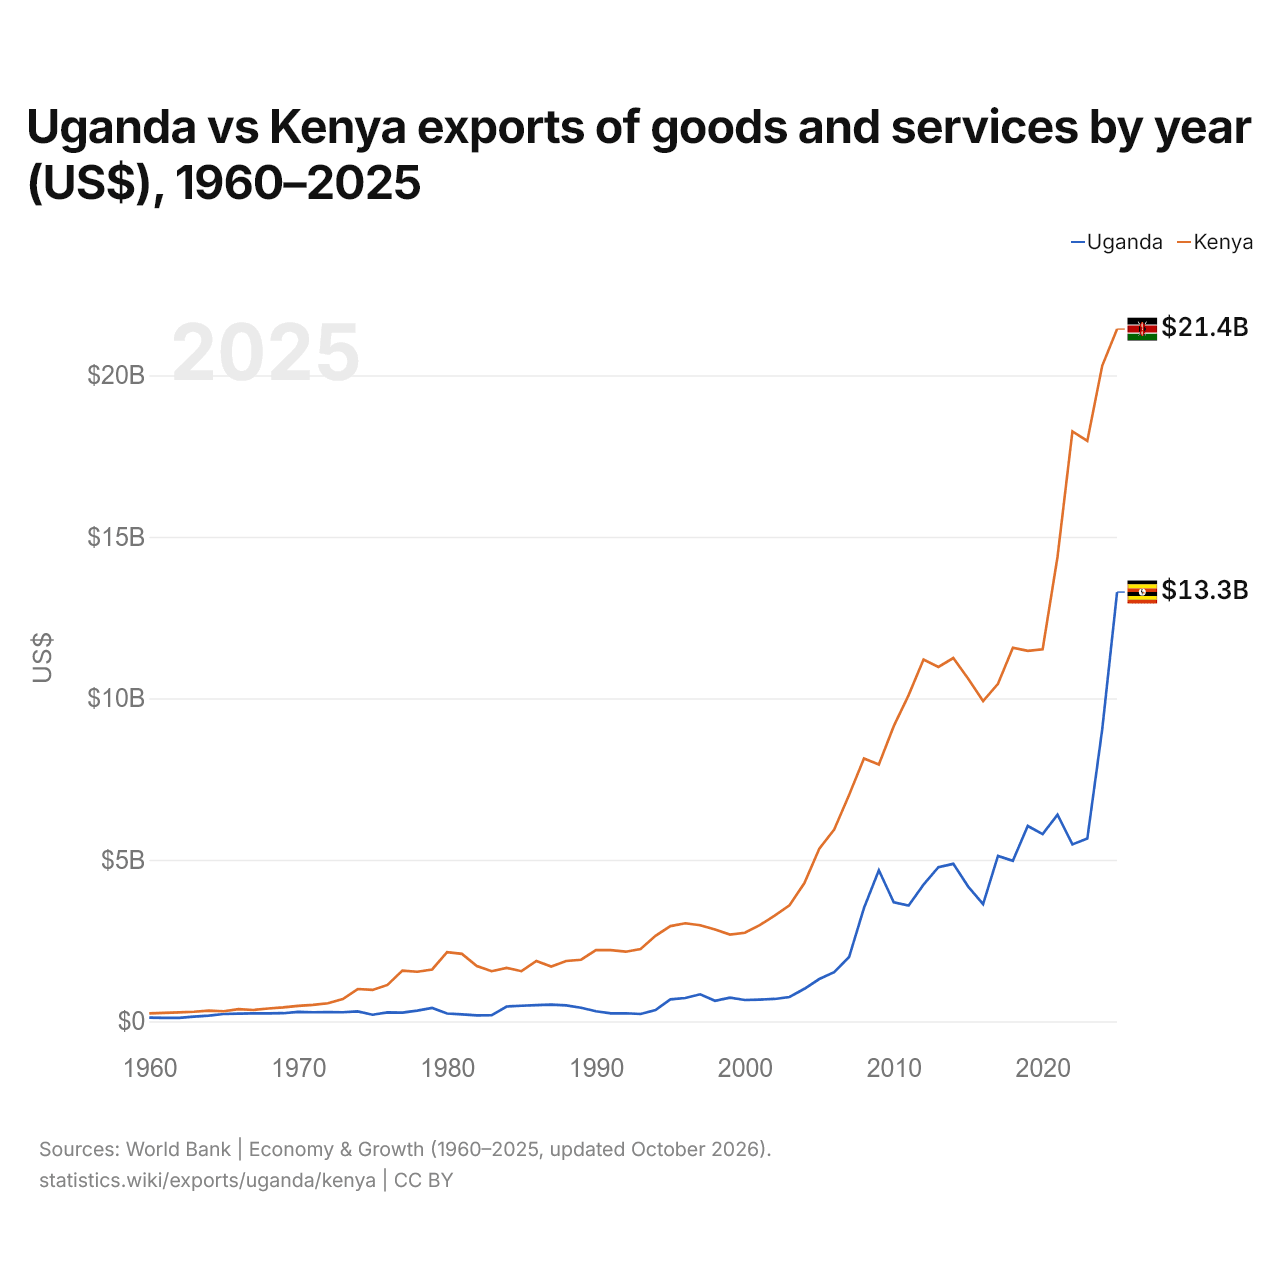
Ouganda vs Kenya : exportations de biens et services par année ($ US), 1960–2025
| Année | $ US | |
|---|---|---|
 Ouganda |
 Kenya |
|
| 2025 | 13 289 512 671 $ US | 21 429 875 347 $ US |
| 2024 | 9 034 338 029 $ US | 20 292 950 694 $ US |
| 2023 | 5 658 032 305 $ US | 17 966 992 983 $ US |
| 2022 | 5 477 862 278 $ US | 18 262 655 905 $ US |
| 2021 | 6 396 009 274 $ US | 14 381 862 480 $ US |
| 2020 | 5 796 021 015 $ US | 11 516 270 712 $ US |
| 2019 | 6 048 575 718 $ US | 11 471 243 360 $ US |
| 2018 | 4 967 717 827 $ US | 11 564 075 006 $ US |
| 2017 | 5 122 376 577 $ US | 10 448 711 418 $ US |
| 2016 | 3 629 227 691 $ US | 9 912 815 674 $ US |
| 2015 | 4 170 603 009 $ US | 10 608 335 823 $ US |
| 2014 | 4 874 969 924 $ US | 11 248 585 738 $ US |
| 2013 | 4 774 874 142 $ US | 10 972 694 027 $ US |
| 2012 | 4 230 158 431 $ US | 11 203 175 900 $ US |
| 2011 | 3 583 112 055 $ US | 10 100 126 370 $ US |
| 2010 | 3 687 465 343 $ US | 9 137 589 276 $ US |
| 2009 | 4 677 180 751 $ US | 7 950 667 080 $ US |
| 2008 | 3 506 150 678 $ US | 8 138 887 724 $ US |
| 2007 | 1 990 712 068 $ US | 7 004 914 020 $ US |
| 2006 | 1 524 126 930 $ US | 5 935 978 411 $ US |
| 2005 | 1 310 093 926 $ US | 5 341 992 293 $ US |
| 2004 | 1 008 067 266 $ US | 4 283 010 819 $ US |
| 2003 | 752 307 733 $ US | 3 590 023 638 $ US |
| 2002 | 692 819 584 $ US | 3 273 519 932 $ US |
| 2001 | 672 714 062 $ US | 2 977 896 210 $ US |
| 2000 | 659 668 069 $ US | 2 742 776 491 $ US |
| 1999 | 734 918 410 $ US | 2 686 591 710 $ US |
| 1998 | 634 713 533 $ US | 2 842 655 388 $ US |
| 1997 | 837 552 442 $ US | 2 975 493 106 $ US |
| 1996 | 722 999 698 $ US | 3 035 630 590 $ US |
| 1995 | 678 725 717 $ US | 2 948 349 669 $ US |
| 1994 | 348 784 843 $ US | 2 647 694 303 $ US |
| 1993 | 227 444 247 $ US | 2 237 653 804 $ US |
| 1992 | 250 344 412 $ US | 2 155 745 830 $ US |
| 1991 | 247 948 158 $ US | 2 204 295 626 $ US |
| 1990 | 311 669 539 $ US | 2 202 462 430 $ US |
| 1989 | 419 712 426 $ US | 1 907 852 204 $ US |
| 1988 | 492 900 000 $ US | 1 869 200 100 $ US |
| 1987 | 517 053 674 $ US | 1 698 200 923 $ US |
| 1986 | 502 571 962 $ US | 1 871 195 154 $ US |
| 1985 | 483 554 234 $ US | 1 552 098 193 $ US |
| 1984 | 458 913 259 $ US | 1 656 202 770 $ US |
| 1983 | 194 000 000 $ US | 1 551 597 921 $ US |
| 1982 | 182 500 000 $ US | 1 714 496 080 $ US |
| 1981 | 215 000 000 $ US | 2 087 870 039 $ US |
| 1980 | 242 000 000 $ US | 2 144 500 671 $ US |
| 1979 | 415 000 000 $ US | 1 605 552 359 $ US |
| 1978 | 330 434 783 $ US | 1 534 663 245 $ US |
| 1977 | 268 764 706 $ US | 1 571 183 974 $ US |
| 1976 | 278 700 000 $ US | 1 127 505 380 $ US |
| 1975 | 204 111 111 $ US | 972 056 842 $ US |
| 1974 | 308 953 522 $ US | 1 000 159 880 $ US |
| 1973 | 281 678 310 $ US | 687 311 675 $ US |
| 1972 | 289 094 218 $ US | 560 279 776 $ US |
| 1971 | 280 834 383 $ US | 509 319 796 $ US |
| 1970 | 294 134 117 $ US | 478 239 809 $ US |
| 1969 | 251 574 969 $ US | 430 639 828 $ US |
| 1968 | 248 355 033 $ US | 397 879 841 $ US |
| 1967 | 244 715 106 $ US | 350 839 860 $ US |
| 1966 | 236 595 268 $ US | 377 439 849 $ US |
| 1965 | 226 235 475 $ US | 313 319 875 $ US |
| 1964 | 176 172 434 $ US | 333 479 881 $ US |
| 1963 | 146 070 429 $ US | 296 813 881 $ US |
| 1962 | 108 280 397 $ US | 278 123 875 $ US |
| 1961 | 107 847 342 $ US | 259 433 896 $ US |
| 1960 | 115 643 371 $ US | 246 049 902 $ US |
En 2025, les exportations de biens et services de l'Ouganda s'élevaient à 13,3 milliards de dollars et celles du Kenya à 21,4 milliards de dollars : celles du Kenya étaient 1,6 fois plus élevées. En 1960, les exportations du Kenya étaient 2,1 fois plus élevées : 116 millions de dollars pour l'Ouganda et 246 millions de dollars pour le Kenya.
Les exportations de biens et services du Kenya sont supérieures à celles de l'Ouganda chaque année depuis 1960.
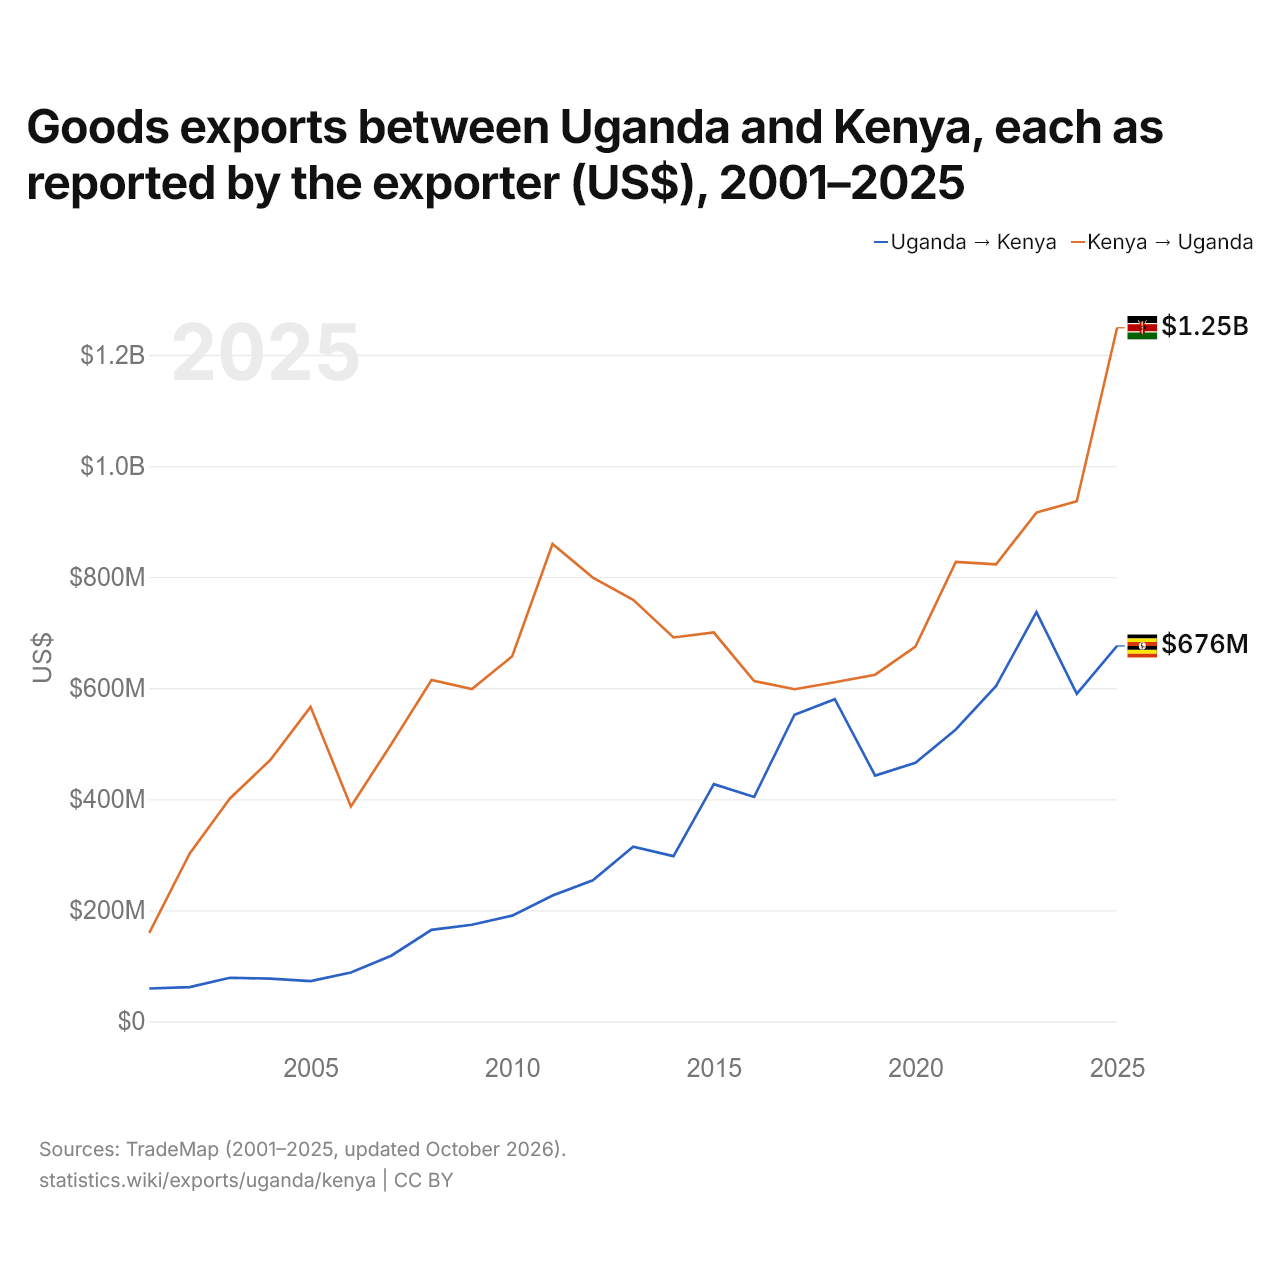
Exportations de biens entre l'Ouganda et le Kenya, selon chaque exportateur ($ US), 2001–2025
| Année | $ US | |
|---|---|---|
| Ouganda → Kenya | Kenya → Ouganda | |
| 2025 | 675 896 000 $ US | 1 248 907 000 $ US |
| 2024 | 589 628 000 $ US | 936 429 000 $ US |
| 2023 | 736 834 000 $ US | 916 078 000 $ US |
| 2022 | 603 932 000 $ US | 822 915 000 $ US |
| 2021 | 525 571 000 $ US | 827 360 000 $ US |
| 2020 | 465 548 000 $ US | 674 647 000 $ US |
| 2019 | 442 425 000 $ US | 624 099 000 $ US |
| 2018 | 580 125 000 $ US | 610 539 000 $ US |
| 2017 | 552 001 000 $ US | 597 901 000 $ US |
| 2016 | 404 101 000 $ US | 612 713 000 $ US |
| 2015 | 427 012 000 $ US | 700 100 000 $ US |
| 2014 | 297 436 000 $ US | 691 150 000 $ US |
| 2013 | 314 430 000 $ US | 758 890 000 $ US |
| 2012 | 254 061 000 $ US | 799 025 000 $ US |
| 2011 | 226 582 000 $ US | 859 492 000 $ US |
| 2010 | 190 301 000 $ US | 657 286 000 $ US |
| 2009 | 173 974 000 $ US | 598 316 000 $ US |
| 2008 | 164 631 000 $ US | 614 711 000 $ US |
| 2007 | 118 191 000 $ US | 498 851 000 $ US |
| 2006 | 88 002 000 $ US | 386 960 000 $ US |
| 2005 | 72 437 000 $ US | 566 237 000 $ US |
| 2004 | 76 903 000 $ US | 470 524 000 $ US |
| 2003 | 78 432 000 $ US | 401 193 000 $ US |
| 2002 | 61 504 000 $ US | 301 809 000 $ US |
| 2001 | 59 063 000 $ US | 159 248 000 $ US |
En 2025, les exportations de biens de l'Ouganda vers le Kenya, selon l'Ouganda, s'élevaient à 676 millions de dollars, et celles du Kenya vers l'Ouganda, selon le Kenya, à 1,25 milliard de dollars : 1,8 fois plus pour celles du Kenya. En 2001, elles s'élevaient à 59,1 millions de dollars pour l'Ouganda et à 159 millions de dollars pour le Kenya.
Ouganda vs Kenya : chiffres des exportations
|
Ouganda
|
Kenya
|
|
|---|---|---|
| Exportations | 13,3 Md $US (2025) | 21,4 Md $US (2025) |
| Rang mondial | 103/176 | 88/176 |
| Part mondiale | 0,04 % | 0,06 % |
| % du PIB | 21,4 % | 15,8 % |
| Première catégorie de biens | Métaux précieux, pierres précieuses, bijoux, montres, instruments de musique et art (50 %, 2025) | Cultures, plantes et fleurs (céréales, fruits, légumes, café, oléagineux) (41 %, 2025) |
| Première destination des biens | Émirats arabes unis (40,5 %, 2025) | Ouganda (14,5 %, 2025) |
Comparer les exportations de 2 pays au choix
Sources :
- Banque mondiale | Économie et croissance (1960–2025, mis à jour en octobre 2026)
- TradeMap (2001–2025, mis à jour en octobre 2026)
Creative Commons Attribution (CC BY) : vous pouvez copier, partager, adapter et réutiliser ce contenu, y compris à des fins commerciales, à condition de citer statistics.wiki et d’indiquer les modifications apportées. Les sources citées ci-dessus peuvent avoir leurs propres conditions de licence.