
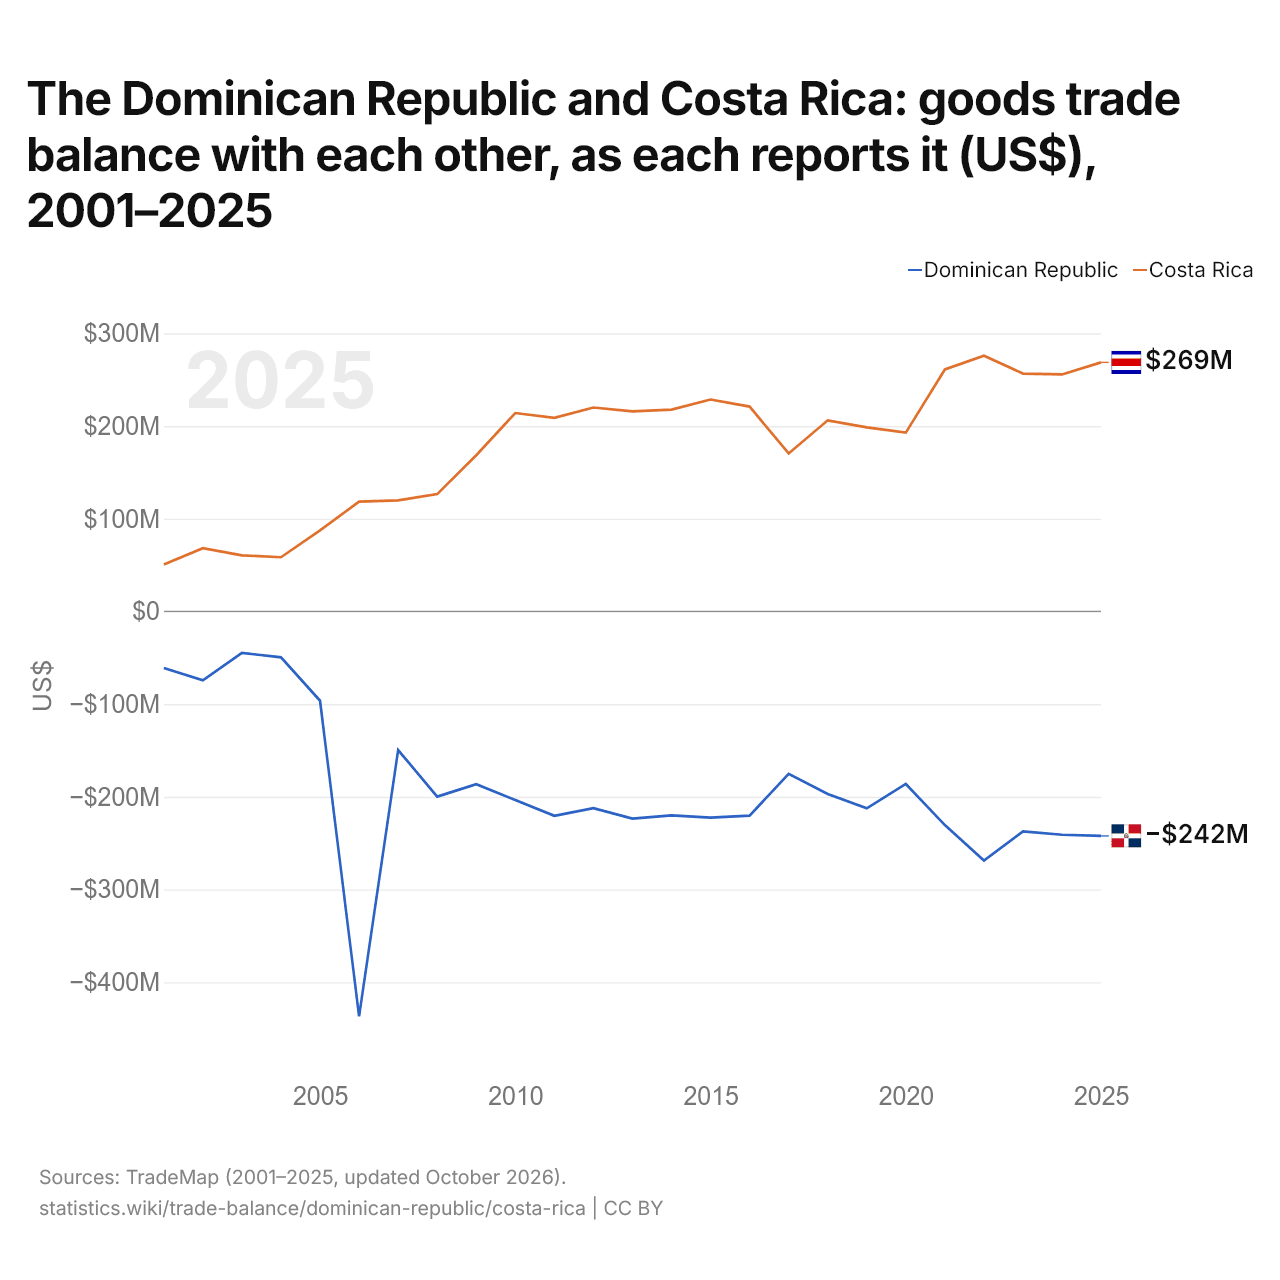
La République dominicaine et le Costa Rica : solde de leur commerce de biens bilatéral, selon chacun ($ US), 2001–2025
| Année | $ US | |
|---|---|---|
| République dominicaine | Costa Rica | |
| 2025 | −242 189 000 $ US | 268 676 000 $ US |
| 2024 | −240 933 000 $ US | 255 680 000 $ US |
| 2023 | −237 398 000 $ US | 256 607 000 $ US |
| 2022 | −268 705 000 $ US | 275 910 000 $ US |
| 2021 | −230 557 000 $ US | 261 113 000 $ US |
| 2020 | −186 166 000 $ US | 192 892 000 $ US |
| 2019 | −212 429 000 $ US | 198 510 000 $ US |
| 2018 | −196 868 000 $ US | 206 167 000 $ US |
| 2017 | −175 243 000 $ US | 170 413 000 $ US |
| 2016 | −220 304 000 $ US | 221 002 000 $ US |
| 2015 | −222 542 000 $ US | 228 639 000 $ US |
| 2014 | −219 965 000 $ US | 217 704 000 $ US |
| 2013 | −223 458 000 $ US | 215 836 000 $ US |
| 2012 | −212 207 000 $ US | 220 022 000 $ US |
| 2011 | −220 499 000 $ US | 208 810 000 $ US |
| 2010 | −203 507 000 $ US | 214 052 000 $ US |
| 2009 | −186 351 000 $ US | 168 541 000 $ US |
| 2008 | −199 819 000 $ US | 126 596 000 $ US |
| 2007 | −149 505 000 $ US | 119 844 000 $ US |
| 2006 | −436 823 000 $ US | 118 501 000 $ US |
| 2005 | −96 341 000 $ US | 87 388 000 $ US |
| 2004 | −49 572 000 $ US | 58 438 000 $ US |
| 2003 | −44 689 000 $ US | 60 504 000 $ US |
| 2002 | −74 244 000 $ US | 68 236 000 $ US |
| 2001 | −60 969 000 $ US | 50 630 000 $ US |
En 2025, selon la République dominicaine, son commerce de biens avec le Costa Rica affichait un déficit de 242 millions de dollars ; selon le Costa Rica, son commerce de biens avec la République dominicaine affichait un excédent de 269 millions de dollars. En 2001, les chiffres étaient un déficit de 61 millions de dollars pour la République dominicaine et un excédent de 50,6 millions de dollars pour le Costa Rica.
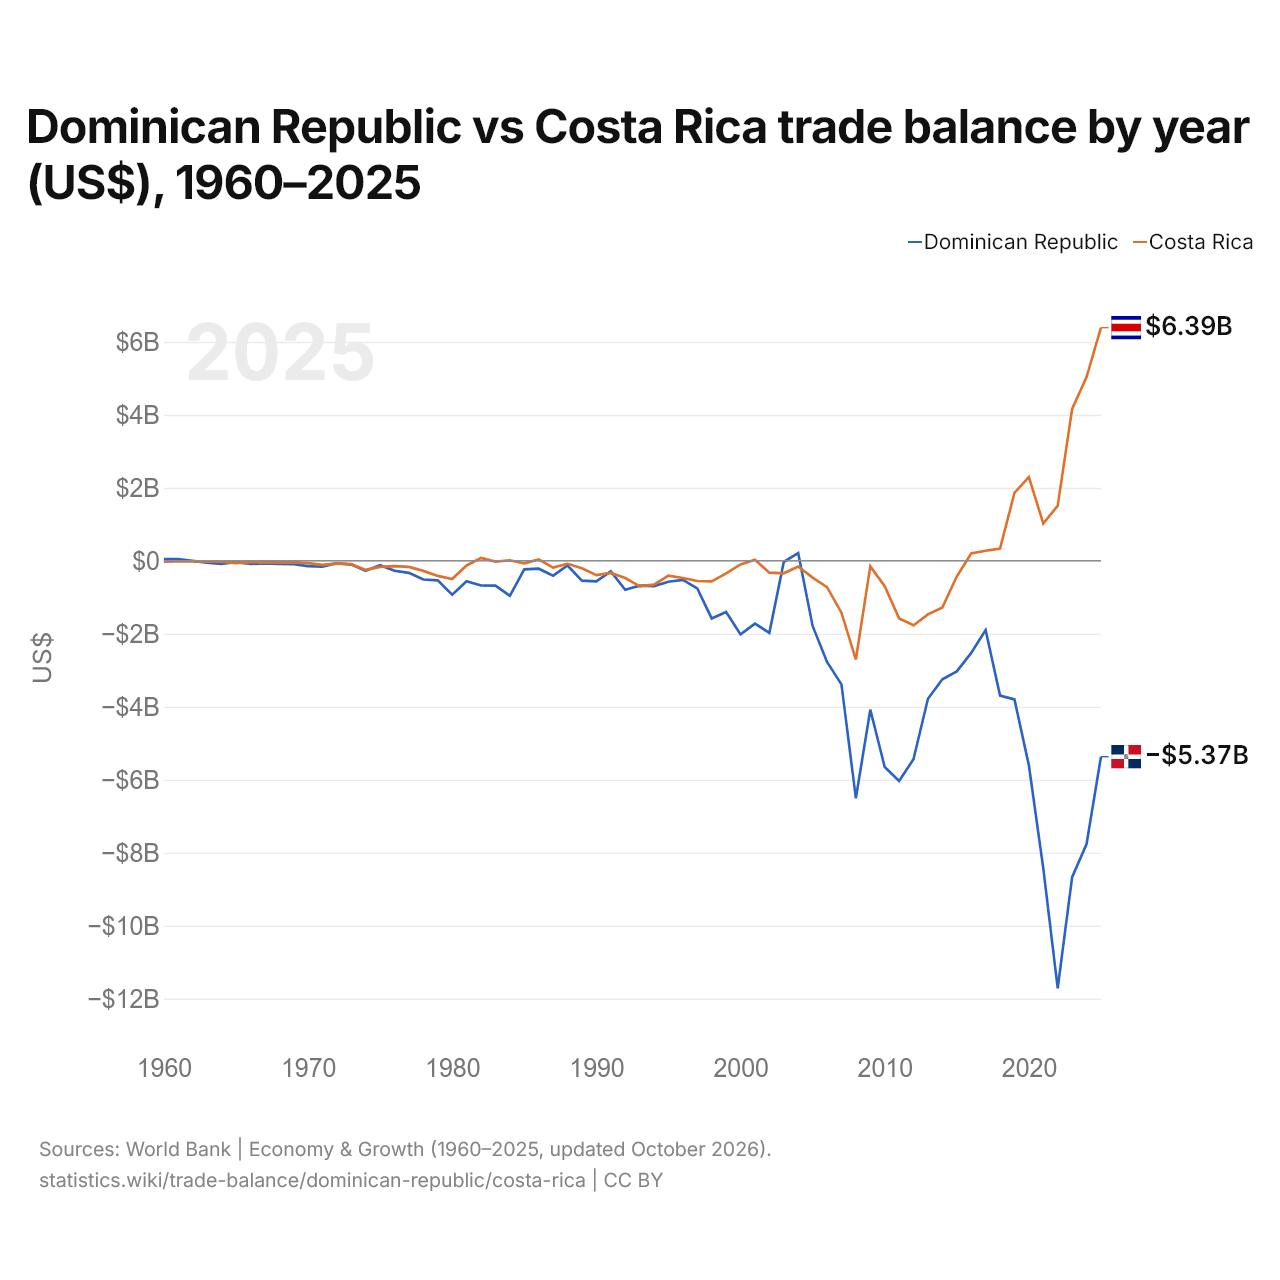
République dominicaine vs Costa Rica : balance commerciale par année ($ US), 1960–2025
| Année | $ US | |
|---|---|---|
 Rép. dominicaine |
 Costa Rica |
|
| 2025 | −5 370 305 745 $ US | 6 388 241 982 $ US |
| 2024 | −7 764 731 649 $ US | 5 035 307 503 $ US |
| 2023 | −8 669 211 576 $ US | 4 159 883 783 $ US |
| 2022 | −11 717 549 746 $ US | 1 508 939 813 $ US |
| 2021 | −8 435 475 831 $ US | 1 020 579 727 $ US |
| 2020 | −5 607 248 113 $ US | 2 291 858 848 $ US |
| 2019 | −3 799 690 710 $ US | 1 861 743 506 $ US |
| 2018 | −3 696 413 817 $ US | 331 875 262 $ US |
| 2017 | −1 897 711 598 $ US | 274 387 327 $ US |
| 2016 | −2 525 675 395 $ US | 201 088 459 $ US |
| 2015 | −3 032 733 106 $ US | −430 226 387 $ US |
| 2014 | −3 247 714 604 $ US | −1 282 418 430 $ US |
| 2013 | −3 782 182 102 $ US | −1 468 936 015 $ US |
| 2012 | −5 434 202 144 $ US | −1 769 252 761 $ US |
| 2011 | −6 035 506 972 $ US | −1 579 738 366 $ US |
| 2010 | −5 652 962 319 $ US | −697 914 668 $ US |
| 2009 | −4 081 936 925 $ US | −152 101 398 $ US |
| 2008 | −6 507 637 966 $ US | −2 707 039 847 $ US |
| 2007 | −3 387 633 161 $ US | −1 422 824 731 $ US |
| 2006 | −2 771 534 625 $ US | −723 827 090 $ US |
| 2005 | −1 785 759 101 $ US | −459 655 981 $ US |
| 2004 | 210 618 499 $ US | −156 546 480 $ US |
| 2003 | −30 715 015 $ US | −342 720 363 $ US |
| 2002 | −1 974 320 078 $ US | −325 752 876 $ US |
| 2001 | −1 722 830 595 $ US | 26 262 657 $ US |
| 2000 | −2 018 532 570 $ US | −99 732 308 $ US |
| 1999 | −1 403 580 678 $ US | −345 378 745 $ US |
| 1998 | −1 580 236 999 $ US | −562 742 719 $ US |
| 1997 | −758 393 539 $ US | −554 419 175 $ US |
| 1996 | −523 365 179 $ US | −471 011 506 $ US |
| 1995 | −573 076 923 $ US | −407 096 810 $ US |
| 1994 | −694 281 742 $ US | −653 309 769 $ US |
| 1993 | −683 384 000 $ US | −696 116 962 $ US |
| 1992 | −795 816 000 $ US | −474 694 622 $ US |
| 1991 | −288 360 636 $ US | −333 904 177 $ US |
| 1990 | −564 266 947 $ US | −394 370 767 $ US |
| 1989 | −543 575 394 $ US | −203 773 887 $ US |
| 1988 | −128 396 698 $ US | −82 456 788 $ US |
| 1987 | −408 212 949 $ US | −187 400 032 $ US |
| 1986 | −217 152 269 $ US | 37 374 552 $ US |
| 1985 | −235 636 161 $ US | −68 700 990 $ US |
| 1984 | −959 594 946 $ US | 15 024 920 $ US |
| 1983 | −680 931 863 $ US | −23 463 184 $ US |
| 1982 | −677 524 940 $ US | 76 088 041 $ US |
| 1981 | −558 638 062 $ US | −128 771 636 $ US |
| 1980 | −927 883 259 $ US | −499 626 604 $ US |
| 1979 | −535 639 740 $ US | −414 469 078 $ US |
| 1978 | −512 232 530 $ US | −276 581 097 $ US |
| 1977 | −330 404 627 $ US | −167 934 656 $ US |
| 1976 | −271 896 894 $ US | −144 795 799 $ US |
| 1975 | −120 799 453 $ US | −166 394 399 $ US |
| 1974 | −273 656 091 $ US | −249 609 079 $ US |
| 1973 | −103 485 083 $ US | −92 857 300 $ US |
| 1972 | −66 911 844 $ US | −78 975 132 $ US |
| 1971 | −161 581 307 $ US | −111 065 280 $ US |
| 1970 | −148 202 996 $ US | −66 415 094 $ US |
| 1969 | −93 900 000 $ US | −45 720 755 $ US |
| 1968 | −88 000 000 $ US | −36 286 792 $ US |
| 1967 | −71 700 000 $ US | −44 332 075 $ US |
| 1966 | −88 500 000 $ US | −38 792 453 $ US |
| 1965 | −35 200 000 $ US | −63 003 774 $ US |
| 1964 | −85 500 000 $ US | −22 510 940 $ US |
| 1963 | −49 400 000 $ US | −25 804 123 $ US |
| 1962 | −2 600 000 $ US | −15 939 610 $ US |
| 1961 | 45 200 000 $ US | −20 571 792 $ US |
| 1960 | 45 600 000 $ US | −24 821 248 $ US |
En 2025, la balance commerciale de la République dominicaine affichait un déficit de 5,37 milliards de dollars et celle du Costa Rica un excédent de 6,39 milliards de dollars. En 1960, la balance commerciale de la République dominicaine affichait un excédent de 45,6 millions de dollars et celle du Costa Rica un déficit de 24,8 millions de dollars.
De 1960 à 2025, la balance commerciale de la République dominicaine a été excédentaire pendant 3 des 66 années, et celle du Costa Rica pendant 14. Les balances commerciales de la République dominicaine et du Costa Rica ont été déficitaires en même temps pendant 49 de ces années, la dernière fois en 2015.
République dominicaine vs Costa Rica : chiffres de la balance commerciale
|
Rép. dominicaine
|
Costa Rica
|
|
|---|---|---|
| Biens et services, $ US | −5,37 Md $US (2025) | +6,39 Md $US (2025) |
| % du PIB | −4,2 % (2025) | +6,2 % (2025) |
| Années d'excédent depuis 2000 | 1 sur 26 | 11 sur 26 |
| Solde des biens entre les deux, chiffres propres | −242 M $US (2025) | +269 M $US (2025) |
| Premier excédent en biens avec | Haïti (+1,20 Md $US, 2025) | Pays-Bas (+1,97 Md $US, 2025) |
| Premier déficit en biens avec | Chine (−5,68 Md $US, 2025) | Chine (−4,18 Md $US, 2025) |
Comparer la balance commerciale de 2 pays au choix
Sources :
- Banque mondiale | Économie et croissance (1960–2025, mis à jour en octobre 2026)
- TradeMap (2001–2025, mis à jour en octobre 2026)
Creative Commons Attribution (CC BY) : vous pouvez copier, partager, adapter et réutiliser ce contenu, y compris à des fins commerciales, à condition de citer statistics.wiki et d’indiquer les modifications apportées. Les sources citées ci-dessus peuvent avoir leurs propres conditions de licence.