
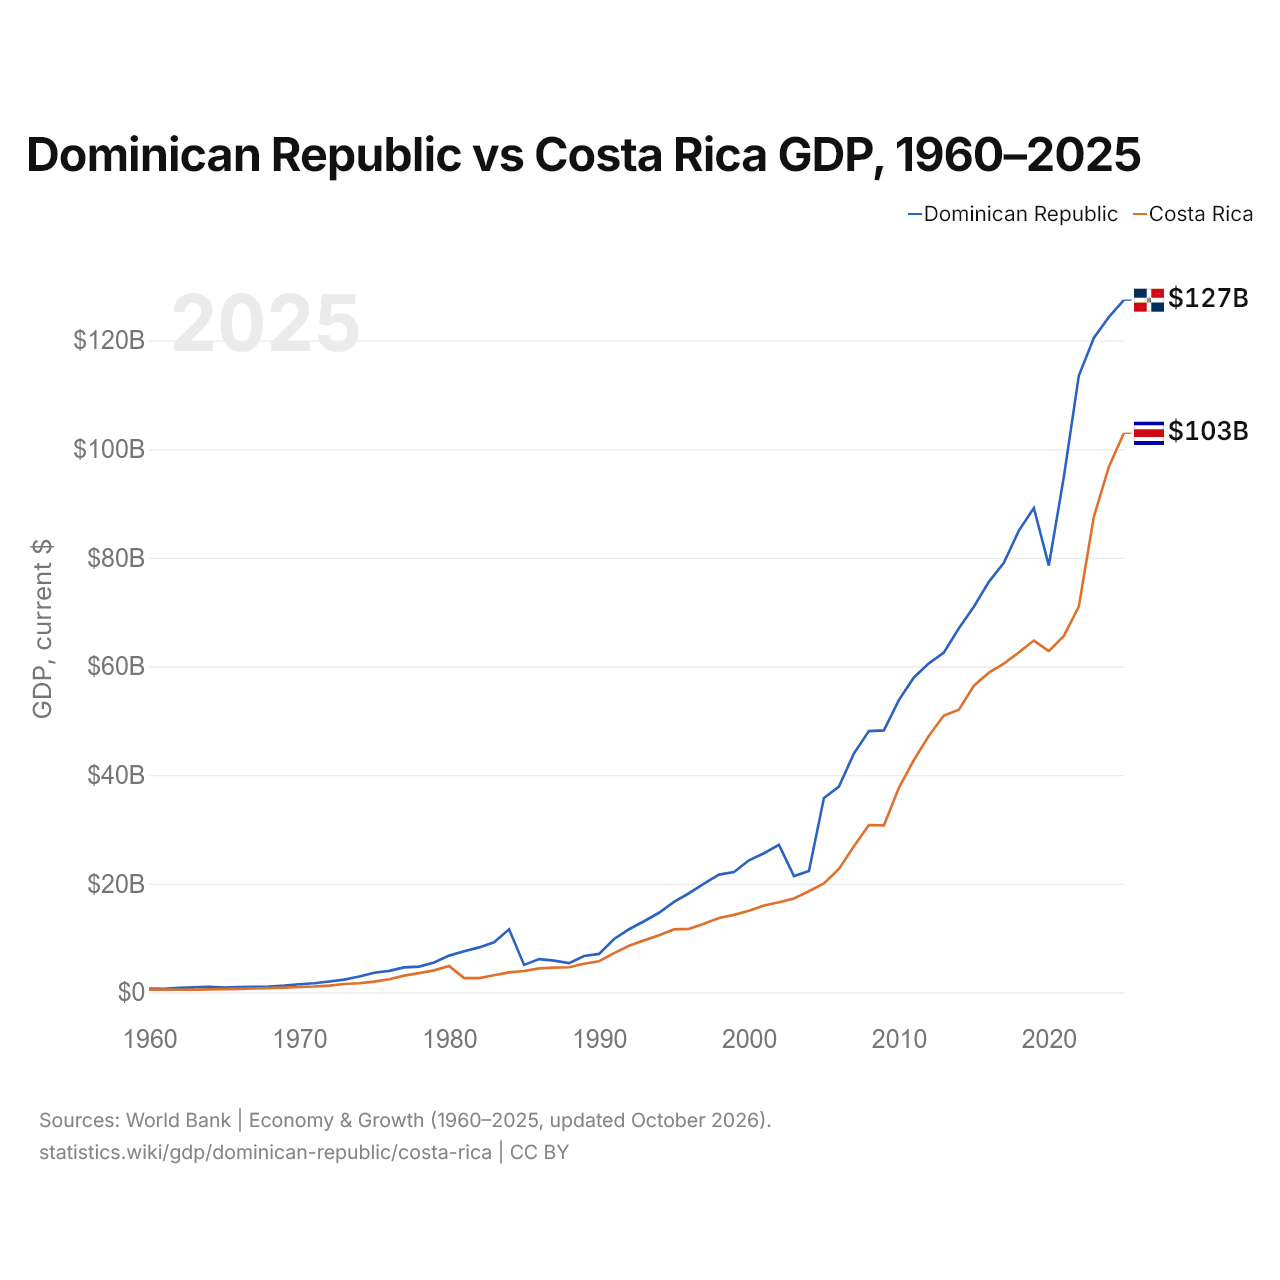
République dominicaine vs Costa Rica : PIB, 1960–2025
| Année | PIB, dollars US courants | |
|---|---|---|
 Rép. dominicaine |
 Costa Rica |
|
| 2025 | 127 407 463 759 $ US | 102 904 921 157 $ US |
| 2024 | 124 282 245 639 $ US | 96 715 644 331 $ US |
| 2023 | 120 456 239 154 $ US | 87 512 637 056 $ US |
| 2022 | 113 478 103 598 $ US | 71 001 226 361 $ US |
| 2021 | 94 850 719 517 $ US | 65 588 938 787 $ US |
| 2020 | 78 546 672 407 $ US | 62 806 591 555 $ US |
| 2019 | 89 146 130 745 $ US | 64 753 504 730 $ US |
| 2018 | 84 994 732 049 $ US | 62 567 765 946 $ US |
| 2017 | 79 070 274 743 $ US | 60 516 044 661 $ US |
| 2016 | 75 552 902 636 $ US | 58 847 019 588 $ US |
| 2015 | 70 966 782 572 $ US | 56 441 920 888 $ US |
| 2014 | 67 014 329 100 $ US | 52 016 408 816 $ US |
| 2013 | 62 555 417 415 $ US | 50 949 668 763 $ US |
| 2012 | 60 561 635 556 $ US | 47 231 655 493 $ US |
| 2011 | 57 948 261 616 $ US | 42 762 613 785 $ US |
| 2010 | 53 801 053 353 $ US | 37 658 616 966 $ US |
| 2009 | 48 223 781 477 $ US | 30 745 714 234 $ US |
| 2008 | 48 091 433 554 $ US | 30 801 745 703 $ US |
| 2007 | 43 965 458 509 $ US | 26 884 700 688 $ US |
| 2006 | 37 879 830 084 $ US | 22 715 540 342 $ US |
| 2005 | 35 777 560 684 $ US | 20 040 642 421 $ US |
| 2004 | 22 322 387 382 $ US | 18 610 594 844 $ US |
| 2003 | 21 403 167 848 $ US | 17 271 760 397 $ US |
| 2002 | 27 137 440 786 $ US | 16 578 820 799 $ US |
| 2001 | 25 601 823 688 $ US | 15 976 174 476 $ US |
| 2000 | 24 305 780 629 $ US | 15 013 629 579 $ US |
| 1999 | 22 136 579 397 $ US | 14 254 866 284 $ US |
| 1998 | 21 672 215 547 $ US | 13 684 255 998 $ US |
| 1997 | 20 017 450 041 $ US | 12 614 602 322 $ US |
| 1996 | 18 241 622 548 $ US | 11 678 424 727 $ US |
| 1995 | 16 637 370 839 $ US | 11 578 594 333 $ US |
| 1994 | 14 644 734 599 $ US | 10 489 903 834 $ US |
| 1993 | 13 081 042 400 $ US | 9 564 816 063 $ US |
| 1992 | 11 605 382 504 $ US | 8 579 754 953 $ US |
| 1991 | 9 824 483 340 $ US | 7 215 725 635 $ US |
| 1990 | 7 073 675 545 $ US | 5 711 687 787 $ US |
| 1989 | 6 686 593 060 $ US | 5 251 025 767 $ US |
| 1988 | 5 374 299 981 $ US | 4 614 629 898 $ US |
| 1987 | 5 827 050 753 $ US | 4 532 952 047 $ US |
| 1986 | 6 122 128 558 $ US | 4 418 983 871 $ US |
| 1985 | 5 044 579 979 $ US | 3 919 203 960 $ US |
| 1984 | 11 594 000 000 $ US | 3 660 477 856 $ US |
| 1983 | 9 220 600 000 $ US | 3 146 772 631 $ US |
| 1982 | 8 267 400 000 $ US | 2 606 623 555 $ US |
| 1981 | 7 561 300 000 $ US | 2 623 803 096 $ US |
| 1980 | 6 761 300 000 $ US | 4 831 447 001 $ US |
| 1979 | 5 498 800 000 $ US | 4 035 519 323 $ US |
| 1978 | 4 734 400 000 $ US | 3 523 208 810 $ US |
| 1977 | 4 587 100 000 $ US | 3 072 427 013 $ US |
| 1976 | 3 951 500 000 $ US | 2 412 555 426 $ US |
| 1975 | 3 599 200 000 $ US | 1 960 863 466 $ US |
| 1974 | 2 925 700 000 $ US | 1 666 544 754 $ US |
| 1973 | 2 344 800 000 $ US | 1 528 925 846 $ US |
| 1972 | 1 987 400 000 $ US | 1 238 251 696 $ US |
| 1971 | 1 666 500 000 $ US | 1 077 147 538 $ US |
| 1970 | 1 485 500 000 $ US | 984 830 158 $ US |
| 1969 | 1 230 500 000 $ US | 853 630 204 $ US |
| 1968 | 1 079 100 000 $ US | 773 841 494 $ US |
| 1967 | 1 034 800 000 $ US | 699 456 619 $ US |
| 1966 | 983 900 000 $ US | 647 305 630 $ US |
| 1965 | 888 100 000 $ US | 592 981 162 $ US |
| 1964 | 1 025 599 900 $ US | 542 578 367 $ US |
| 1963 | 940 799 900 $ US | 511 902 137 $ US |
| 1962 | 824 100 000 $ US | 479 180 824 $ US |
| 1961 | 654 100 200 $ US | 490 325 182 $ US |
| 1960 | 672 399 700 $ US | 507 513 830 $ US |
En 2025, le PIB de la République dominicaine (127 milliards de dollars US) était supérieur de 24 % à celui du Costa Rica (103 milliards de dollars US). En 2015, l'écart était de 26 %. De 2015 à 2025, à prix constants de 2015, le PIB de la République dominicaine a progressé de 50,8 % et celui du Costa Rica de 43,1 %.
Depuis 1960, le PIB de la République dominicaine a chaque année été le plus élevé des deux ; en 1960, il était supérieur de 32 % à celui du Costa Rica. En 2025, le PIB par habitant était de 11 059 $ US en République dominicaine et de 19 970 $ US au Costa Rica, soit 1,8 fois plus élevé au Costa Rica.
République dominicaine vs Costa Rica : derniers chiffres du PIB
|
Rép. dominicaine
|
Costa Rica
|
|
|---|---|---|
| PIB, dollars US courants | 127 Md $US | 103 Md $US |
| Rang mondial | 65/197 | 74/197 |
| Part mondiale | 0,11 % | 0,09 % |
| PIB, dollars US constants de 2015 | 107 Md $US | 80,7 Md $US |
| Écart de PIB | 1,2× | 0,81× |
Comparer le PIB de 2 pays au choix
Sources :
- Banque mondiale | Économie et croissance (1960–2025, mis à jour en octobre 2026)
Creative Commons Attribution (CC BY) : vous pouvez copier, partager, adapter et réutiliser ce contenu, y compris à des fins commerciales, à condition de citer statistics.wiki et d’indiquer les modifications apportées. Les sources citées ci-dessus peuvent avoir leurs propres conditions de licence.