
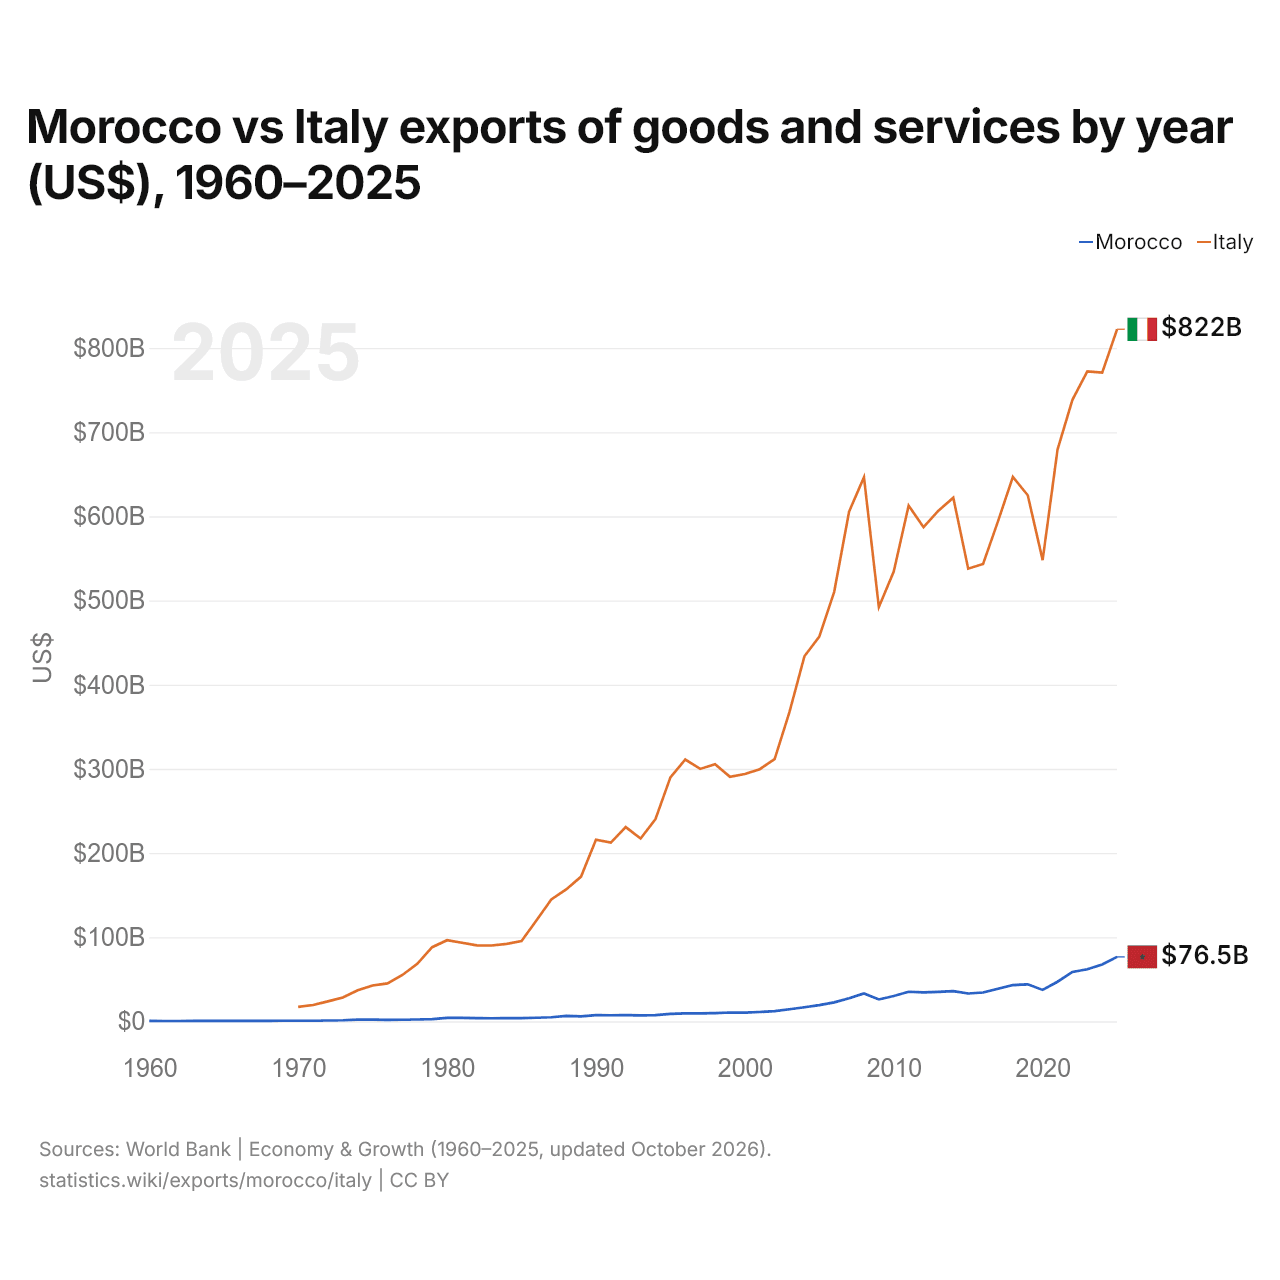
Maroc vs Italie : exportations de biens et services par année ($ US), 1960–2025
| Année | $ US | |
|---|---|---|
 Maroc |
 Italie |
|
| 2025 | 76 541 039 368 $ US | 822 290 762 950 $ US |
| 2024 | 67 454 245 753 $ US | 770 685 525 117 $ US |
| 2023 | 61 945 010 973 $ US | 772 202 263 040 $ US |
| 2022 | 58 681 916 332 $ US | 738 509 644 129 $ US |
| 2021 | 47 060 549 921 $ US | 679 294 123 498 $ US |
| 2020 | 37 369 771 251 $ US | 547 940 256 805 $ US |
| 2019 | 43 952 860 516 $ US | 625 065 757 186 $ US |
| 2018 | 43 077 520 359 $ US | 646 909 638 535 $ US |
| 2017 | 38 651 885 813 $ US | 593 973 032 350 $ US |
| 2016 | 34 291 493 550 $ US | 543 464 412 394 $ US |
| 2015 | 33 119 569 274 $ US | 537 833 599 948 $ US |
| 2014 | 35 897 680 524 $ US | 622 037 943 986 $ US |
| 2013 | 35 014 914 037 $ US | 606 723 898 231 $ US |
| 2012 | 34 323 797 625 $ US | 587 109 493 950 $ US |
| 2011 | 35 175 698 018 $ US | 612 801 201 125 $ US |
| 2010 | 30 046 721 233 $ US | 534 489 188 500 $ US |
| 2009 | 26 014 198 657 $ US | 492 210 347 985 $ US |
| 2008 | 33 064 161 825 $ US | 646 508 511 780 $ US |
| 2007 | 27 325 793 519 $ US | 605 527 905 413 $ US |
| 2006 | 22 483 592 810 $ US | 510 265 819 331 $ US |
| 2005 | 19 275 921 048 $ US | 457 141 717 038 $ US |
| 2004 | 16 759 410 599 $ US | 433 747 867 068 $ US |
| 2003 | 14 319 608 062 $ US | 367 620 453 605 $ US |
| 2002 | 12 213 885 546 $ US | 311 627 059 267 $ US |
| 2001 | 11 131 243 438 $ US | 299 586 464 835 $ US |
| 2000 | 10 408 859 646 $ US | 293 867 190 140 $ US |
| 1999 | 10 472 253 114 $ US | 290 576 914 389 $ US |
| 1998 | 9 784 229 421 $ US | 305 612 021 858 $ US |
| 1997 | 9 365 776 467 $ US | 299 911 323 329 $ US |
| 1996 | 9 424 749 951 $ US | 311 106 412 348 $ US |
| 1995 | 8 849 422 506 $ US | 289 818 376 322 $ US |
| 1994 | 7 454 972 835 $ US | 240 410 654 419 $ US |
| 1993 | 6 983 435 380 $ US | 217 241 821 090 $ US |
| 1992 | 7 474 470 438 $ US | 230 753 561 665 $ US |
| 1991 | 7 205 742 183 $ US | 212 306 182 301 $ US |
| 1990 | 7 411 991 822 $ US | 215 684 612 153 $ US |
| 1989 | 5 935 176 840 $ US | 171 957 047 700 $ US |
| 1988 | 6 425 436 406 $ US | 156 726 916 096 $ US |
| 1987 | 4 893 088 773 $ US | 144 899 858 082 $ US |
| 1986 | 4 258 765 117 $ US | 119 777 358 098 $ US |
| 1985 | 3 824 760 012 $ US | 95 474 838 252 $ US |
| 1984 | 3 800 181 964 $ US | 91 976 627 728 $ US |
| 1983 | 3 697 958 875 $ US | 90 083 429 373 $ US |
| 1982 | 3 822 370 232 $ US | 90 239 862 563 $ US |
| 1981 | 4 032 797 040 $ US | 93 313 282 235 $ US |
| 1980 | 4 201 411 557 $ US | 96 339 527 470 $ US |
| 1979 | 2 706 652 298 $ US | 88 125 534 840 $ US |
| 1978 | 2 167 005 746 $ US | 68 300 727 812 $ US |
| 1977 | 1 866 967 362 $ US | 55 073 254 334 $ US |
| 1976 | 1 717 031 972 $ US | 45 043 912 538 $ US |
| 1975 | 2 019 155 151 $ US | 42 652 568 209 $ US |
| 1974 | 2 115 101 331 $ US | 36 967 362 310 $ US |
| 1973 | 1 300 658 084 $ US | 28 263 779 475 $ US |
| 1972 | 942 466 528 $ US | 23 697 035 193 $ US |
| 1971 | 738 600 056 $ US | 19 424 023 096 $ US |
| 1970 | 697 778 278 $ US | 17 194 739 777 $ US |
| 1969 | 671 081 259 $ US | - |
| 1968 | 604 684 527 $ US | - |
| 1967 | 545 401 730 $ US | - |
| 1966 | 545 401 730 $ US | - |
| 1965 | 535 521 264 $ US | - |
| 1964 | 545 401 671 $ US | - |
| 1963 | 476 238 487 $ US | - |
| 1962 | 428 812 249 $ US | - |
| 1961 | 440 668 809 $ US | - |
| 1960 | 480 190 673 $ US | - |
En 2025, les exportations de biens et services du Maroc s'élevaient à 76,5 milliards de dollars et celles de l'Italie à 822 milliards de dollars : celles de l'Italie étaient 11 fois plus élevées. En 1970, les exportations de l'Italie étaient 25 fois plus élevées : 698 millions de dollars pour le Maroc et 17,2 milliards de dollars pour l'Italie.
Les exportations de biens et services de l'Italie sont supérieures à celles du Maroc chaque année depuis 1970.
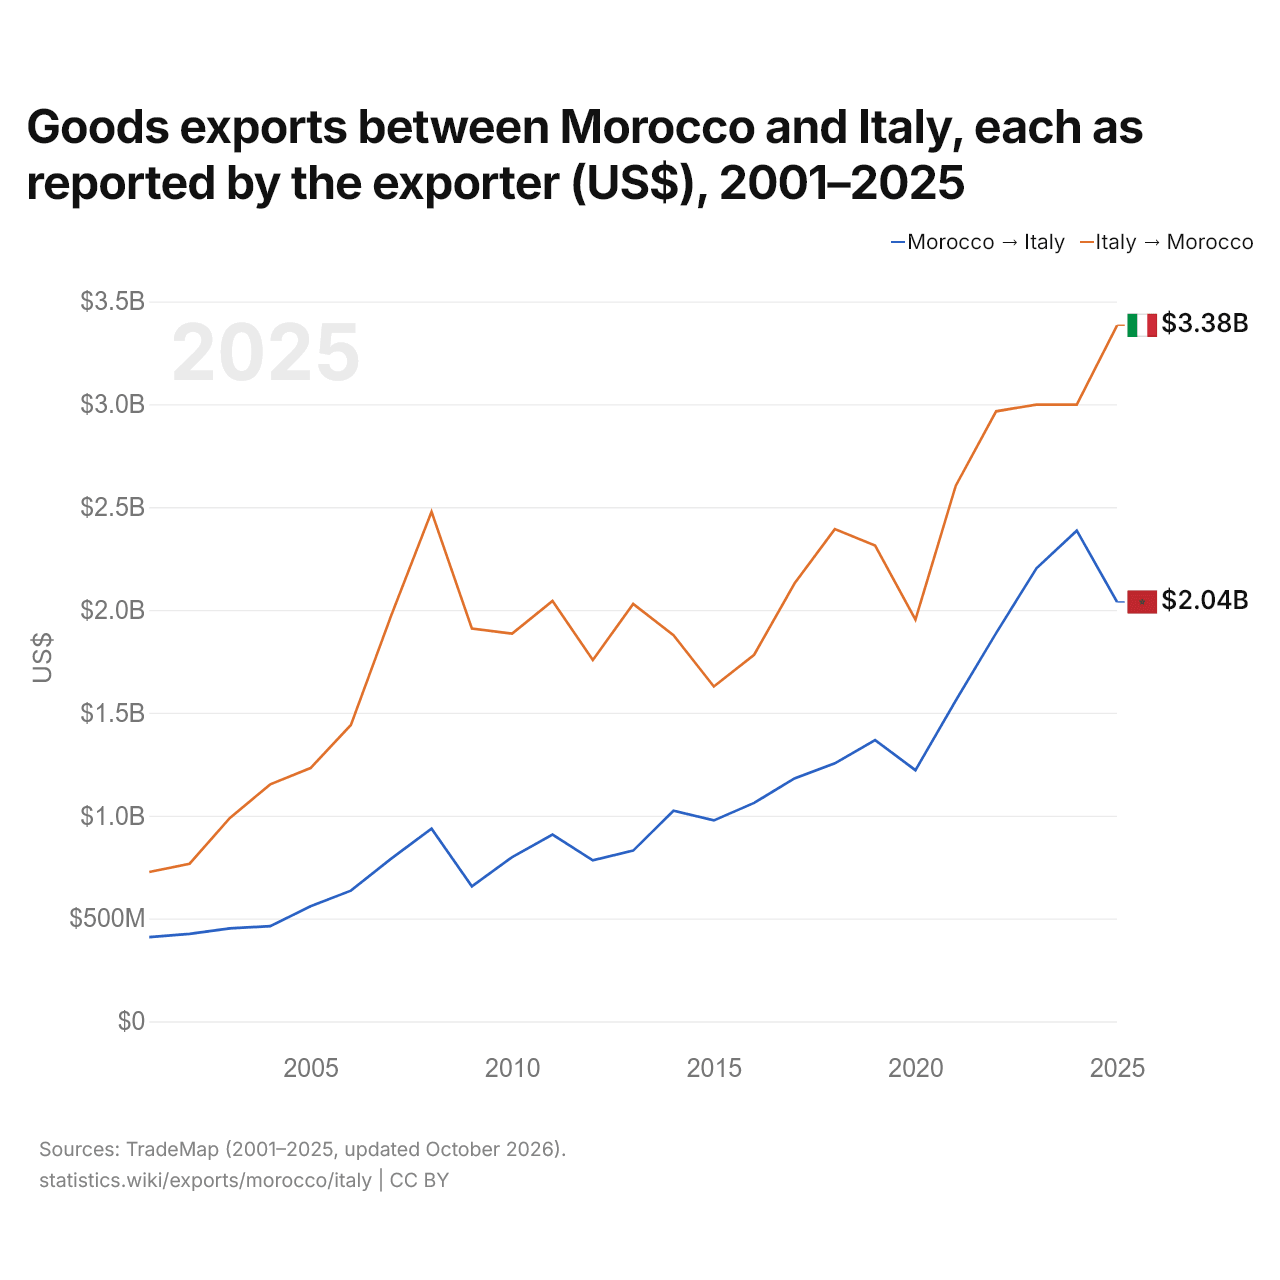
Exportations de biens entre le Maroc et l'Italie, selon chaque exportateur ($ US), 2001–2025
| Année | $ US | |
|---|---|---|
| Maroc → Italie | Italie → Maroc | |
| 2025 | 2 038 760 000 $ US | 3 383 882 000 $ US |
| 2024 | 2 385 336 000 $ US | 2 998 182 000 $ US |
| 2023 | 2 202 501 000 $ US | 2 997 965 000 $ US |
| 2022 | 1 887 109 000 $ US | 2 965 560 000 $ US |
| 2021 | 1 559 790 000 $ US | 2 604 026 000 $ US |
| 2020 | 1 220 820 000 $ US | 1 953 161 000 $ US |
| 2019 | 1 367 341 000 $ US | 2 312 735 000 $ US |
| 2018 | 1 254 112 000 $ US | 2 392 847 000 $ US |
| 2017 | 1 180 669 000 $ US | 2 128 271 000 $ US |
| 2016 | 1 062 078 000 $ US | 1 782 215 000 $ US |
| 2015 | 976 747 000 $ US | 1 627 712 000 $ US |
| 2014 | 1 023 781 000 $ US | 1 876 832 000 $ US |
| 2013 | 829 942 000 $ US | 2 029 599 000 $ US |
| 2012 | 782 352 000 $ US | 1 756 177 000 $ US |
| 2011 | 908 110 000 $ US | 2 043 855 000 $ US |
| 2010 | 798 646 000 $ US | 1 885 047 000 $ US |
| 2009 | 656 053 000 $ US | 1 909 566 000 $ US |
| 2008 | 936 831 000 $ US | 2 477 187 000 $ US |
| 2007 | 791 046 000 $ US | 1 973 304 000 $ US |
| 2006 | 635 156 000 $ US | 1 441 118 000 $ US |
| 2005 | 559 802 000 $ US | 1 231 078 000 $ US |
| 2004 | 462 672 000 $ US | 1 152 143 000 $ US |
| 2003 | 451 852 000 $ US | 988 685 000 $ US |
| 2002 | 425 143 000 $ US | 766 103 000 $ US |
| 2001 | 409 241 000 $ US | 726 022 000 $ US |
En 2025, les exportations de biens du Maroc vers l'Italie, selon le Maroc, s'élevaient à 2,04 milliards de dollars, et celles de l'Italie vers le Maroc, selon l'Italie, à 3,38 milliards de dollars : 1,7 fois plus pour celles de l'Italie. En 2001, elles s'élevaient à 409 millions de dollars pour le Maroc et à 726 millions de dollars pour l'Italie.
Maroc vs Italie : chiffres des exportations
|
Maroc
|
Italie
|
|
|---|---|---|
| Exportations | 76,5 Md $US (2025) | 822 Md $US (2025) |
| Rang mondial | 53/176 | 12/176 |
| Part mondiale | 0,22 % | 2,36 % |
| % du PIB | 42,0 % | 32,2 % |
| Première catégorie de biens | Machines, électronique et véhicules (39,8 %, 2025) | Machines, électronique et véhicules (34,9 %, 2025) |
| Première destination des biens | Espagne (21,5 %, 2025) | Allemagne (11,2 %, 2025) |
Comparer les exportations de 2 pays au choix
Sources :
- Banque mondiale | Économie et croissance (1960–2025, mis à jour en octobre 2026)
- TradeMap (2001–2025, mis à jour en octobre 2026)
Creative Commons Attribution (CC BY) : vous pouvez copier, partager, adapter et réutiliser ce contenu, y compris à des fins commerciales, à condition de citer statistics.wiki et d’indiquer les modifications apportées. Les sources citées ci-dessus peuvent avoir leurs propres conditions de licence.