
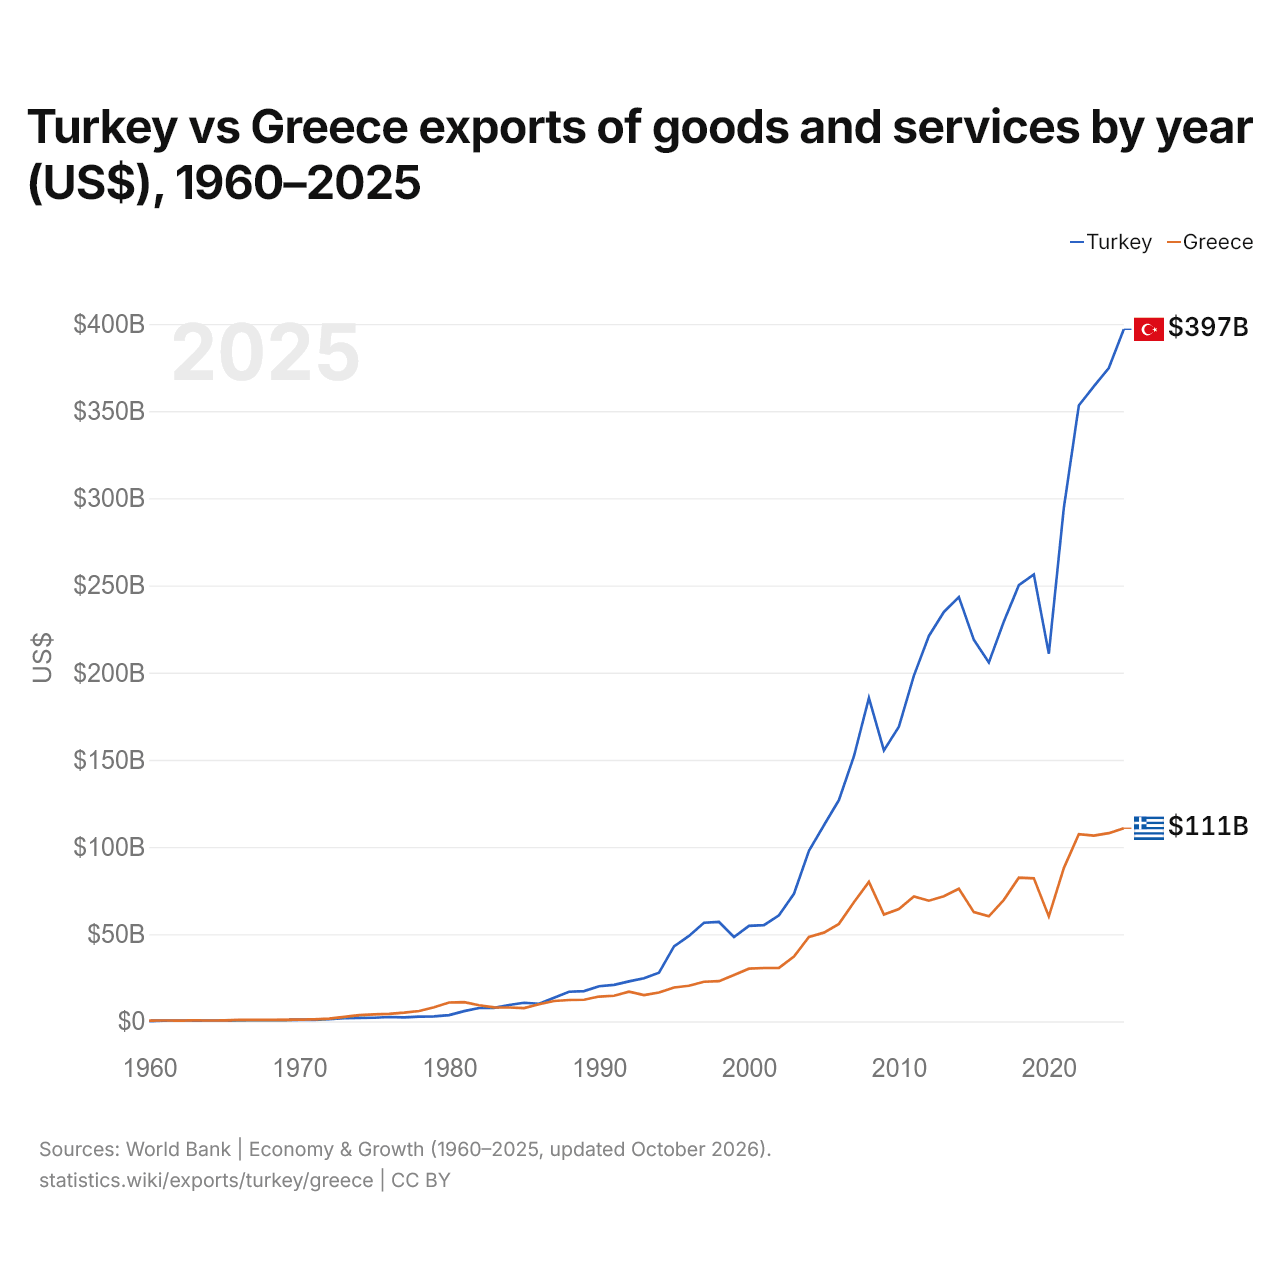
Turquie vs Grèce : exportations de biens et services par année ($ US), 1960–2025
| Année | $ US | |
|---|---|---|
 Turquie |
 Grèce |
|
| 2025 | 396 923 725 496 $ US | 110 743 741 990 $ US |
| 2024 | 374 686 274 270 $ US | 107 906 278 861 $ US |
| 2023 | 364 211 599 327 $ US | 106 504 786 801 $ US |
| 2022 | 353 224 790 396 $ US | 107 320 103 000 $ US |
| 2021 | 294 429 020 560 $ US | 87 890 002 523 $ US |
| 2020 | 210 844 790 112 $ US | 60 184 486 580 $ US |
| 2019 | 256 263 371 549 $ US | 82 010 713 282 $ US |
| 2018 | 250 128 750 717 $ US | 82 399 082 670 $ US |
| 2017 | 229 267 970 164 $ US | 69 691 264 259 $ US |
| 2016 | 205 793 476 583 $ US | 60 206 483 726 $ US |
| 2015 | 218 795 091 046 $ US | 62 624 153 982 $ US |
| 2014 | 243 287 863 473 $ US | 76 056 457 342 $ US |
| 2013 | 234 800 269 886 $ US | 71 740 892 359 $ US |
| 2012 | 221 029 283 948 $ US | 69 182 299 553 $ US |
| 2011 | 198 303 837 476 $ US | 71 678 227 685 $ US |
| 2010 | 168 951 184 650 $ US | 64 408 084 270 $ US |
| 2009 | 155 351 324 873 $ US | 61 214 696 316 $ US |
| 2008 | 185 490 178 806 $ US | 80 002 280 548 $ US |
| 2007 | 152 035 619 691 $ US | 68 338 676 372 $ US |
| 2006 | 126 908 581 381 $ US | 55 899 928 858 $ US |
| 2005 | 112 432 994 612 $ US | 50 868 190 128 $ US |
| 2004 | 97 840 598 666 $ US | 48 427 679 624 $ US |
| 2003 | 73 154 313 089 $ US | 37 167 664 772 $ US |
| 2002 | 60 832 867 533 $ US | 30 626 385 965 $ US |
| 2001 | 55 193 312 761 $ US | 30 582 572 464 $ US |
| 2000 | 54 766 754 849 $ US | 30 196 597 914 $ US |
| 1999 | 48 333 647 259 $ US | 26 625 314 615 $ US |
| 1998 | 57 013 676 915 $ US | 23 016 451 055 $ US |
| 1997 | 56 559 938 761 $ US | 22 716 461 999 $ US |
| 1996 | 48 967 049 936 $ US | 20 396 997 452 $ US |
| 1995 | 43 006 009 379 $ US | 19 395 600 824 $ US |
| 1994 | 27 909 720 018 $ US | 16 545 700 843 $ US |
| 1993 | 24 669 695 039 $ US | 15 014 692 331 $ US |
| 1992 | 22 898 733 993 $ US | 16 986 794 780 $ US |
| 1991 | 20 904 913 710 $ US | 14 665 696 392 $ US |
| 1990 | 20 135 262 553 $ US | 14 210 855 546 $ US |
| 1989 | 17 357 728 558 $ US | 12 400 650 441 $ US |
| 1988 | 16 951 828 411 $ US | 12 221 486 908 $ US |
| 1987 | 13 584 947 491 $ US | 11 688 341 721 $ US |
| 1986 | 10 073 925 926 $ US | 9 799 520 448 $ US |
| 1985 | 10 663 601 533 $ US | 7 578 756 477 $ US |
| 1984 | 9 354 223 433 $ US | 7 925 024 184 $ US |
| 1983 | 7 708 888 889 $ US | 7 999 818 111 $ US |
| 1982 | 7 636 809 816 $ US | 9 232 897 959 $ US |
| 1981 | 5 863 063 063 $ US | 10 998 456 335 $ US |
| 1980 | 3 552 631 579 $ US | 10 787 426 059 $ US |
| 1979 | 2 883 870 968 $ US | 8 120 634 775 $ US |
| 1978 | 2 733 333 333 $ US | 5 937 115 028 $ US |
| 1977 | 2 238 888 889 $ US | 4 968 001 850 $ US |
| 1976 | 2 500 000 000 $ US | 4 299 095 149 $ US |
| 1975 | 2 035 714 286 $ US | 3 962 624 867 $ US |
| 1974 | 2 028 571 429 $ US | 3 540 079 545 $ US |
| 1973 | 1 828 571 429 $ US | 2 554 695 052 $ US |
| 1972 | 1 242 857 143 $ US | 1 514 340 909 $ US |
| 1971 | 860 000 000 $ US | 1 169 159 091 $ US |
| 1970 | 790 909 091 $ US | 1 017 465 909 $ US |
| 1969 | 700 000 000 $ US | 878 078 639 $ US |
| 1968 | 644 444 444 $ US | 791 766 667 $ US |
| 1967 | 644 444 444 $ US | 819 571 866 $ US |
| 1966 | 577 777 778 $ US | 788 927 084 $ US |
| 1965 | 544 444 444 $ US | 577 923 334 $ US |
| 1964 | 500 000 000 $ US | 500 981 988 $ US |
| 1963 | 433 333 333 $ US | 525 311 537 $ US |
| 1962 | 500 000 000 $ US | 427 584 441 $ US |
| 1961 | 411 111 111 $ US | 462 193 281 $ US |
| 1960 | 155 555 556 $ US | 421 746 258 $ US |
En 2025, les exportations de biens et services de la Turquie s'élevaient à 397 milliards de dollars et celles de la Grèce à 111 milliards de dollars : celles de la Turquie étaient 3,6 fois plus élevées. En 1960, les exportations de la Grèce étaient 2,7 fois plus élevées : 156 millions de dollars pour la Turquie et 422 millions de dollars pour la Grèce.
Les exportations de biens et services de la Turquie sont supérieures à celles de la Grèce chaque année depuis 1984.
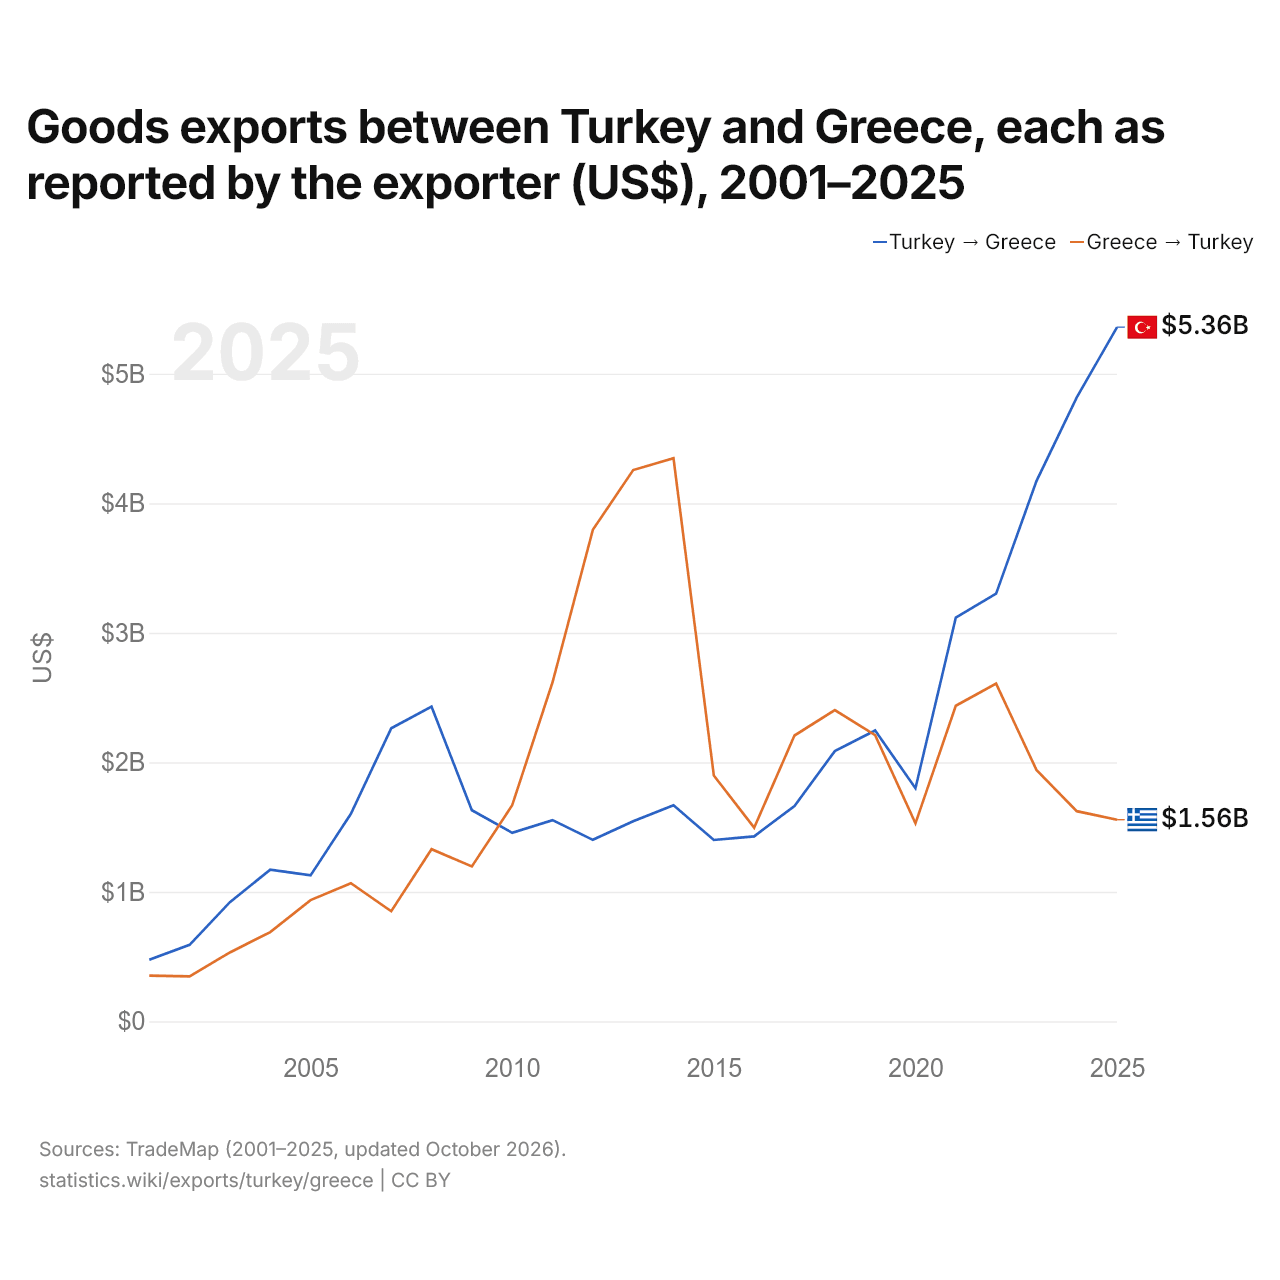
Exportations de biens entre la Turquie et la Grèce, selon chaque exportateur ($ US), 2001–2025
| Année | $ US | |
|---|---|---|
| Turquie → Grèce | Grèce → Turquie | |
| 2025 | 5 360 312 000 $ US | 1 556 911 000 $ US |
| 2024 | 4 818 247 000 $ US | 1 622 930 000 $ US |
| 2023 | 4 171 507 000 $ US | 1 941 401 000 $ US |
| 2022 | 3 302 578 000 $ US | 2 607 467 000 $ US |
| 2021 | 3 117 083 000 $ US | 2 436 294 000 $ US |
| 2020 | 1 799 864 000 $ US | 1 528 497 000 $ US |
| 2019 | 2 245 574 000 $ US | 2 209 603 000 $ US |
| 2018 | 2 086 696 000 $ US | 2 402 593 000 $ US |
| 2017 | 1 662 638 000 $ US | 2 206 672 000 $ US |
| 2016 | 1 428 312 000 $ US | 1 495 307 000 $ US |
| 2015 | 1 400 519 000 $ US | 1 898 199 000 $ US |
| 2014 | 1 668 860 000 $ US | 4 348 029 000 $ US |
| 2013 | 1 544 239 000 $ US | 4 256 672 000 $ US |
| 2012 | 1 401 401 000 $ US | 3 795 321 000 $ US |
| 2011 | 1 553 312 000 $ US | 2 618 030 000 $ US |
| 2010 | 1 455 678 000 $ US | 1 668 428 000 $ US |
| 2009 | 1 629 637 000 $ US | 1 195 888 000 $ US |
| 2008 | 2 429 968 000 $ US | 1 328 966 000 $ US |
| 2007 | 2 262 655 000 $ US | 850 103 000 $ US |
| 2006 | 1 602 590 000 $ US | 1 066 531 000 $ US |
| 2005 | 1 126 678 000 $ US | 935 843 000 $ US |
| 2004 | 1 171 203 000 $ US | 688 868 000 $ US |
| 2003 | 920 401 000 $ US | 531 827 000 $ US |
| 2002 | 590 382 000 $ US | 347 423 000 $ US |
| 2001 | 476 095 000 $ US | 353 261 000 $ US |
En 2025, les exportations de biens de la Turquie vers la Grèce, selon la Turquie, s'élevaient à 5,36 milliards de dollars, et celles de la Grèce vers la Turquie, selon la Grèce, à 1,56 milliard de dollars : 3,4 fois plus pour celles de la Turquie. En 2001, elles s'élevaient à 476 millions de dollars pour la Turquie et à 353 millions de dollars pour la Grèce.
Turquie vs Grèce : chiffres des exportations
|
Turquie
|
Grèce
|
|
|---|---|---|
| Exportations | 397 Md $US (2025) | 111 Md $US (2025) |
| Rang mondial | 26/176 | 46/176 |
| Part mondiale | 1,14 % | 0,32 % |
| % du PIB | 24,8 % | 39,5 % |
| Première catégorie de biens | Machines, électronique et véhicules (32,6 %, 2025) | Pétrole, gaz, minerais et autres matières premières (29,9 %, 2025) |
| Première destination des biens | Allemagne (8,11 %, 2025) | Italie (9,14 %, 2025) |
Comparer les exportations de 2 pays au choix
Sources :
- Banque mondiale | Économie et croissance (1960–2025, mis à jour en octobre 2026)
- TradeMap (2001–2025, mis à jour en octobre 2026)
Creative Commons Attribution (CC BY) : vous pouvez copier, partager, adapter et réutiliser ce contenu, y compris à des fins commerciales, à condition de citer statistics.wiki et d’indiquer les modifications apportées. Les sources citées ci-dessus peuvent avoir leurs propres conditions de licence.