
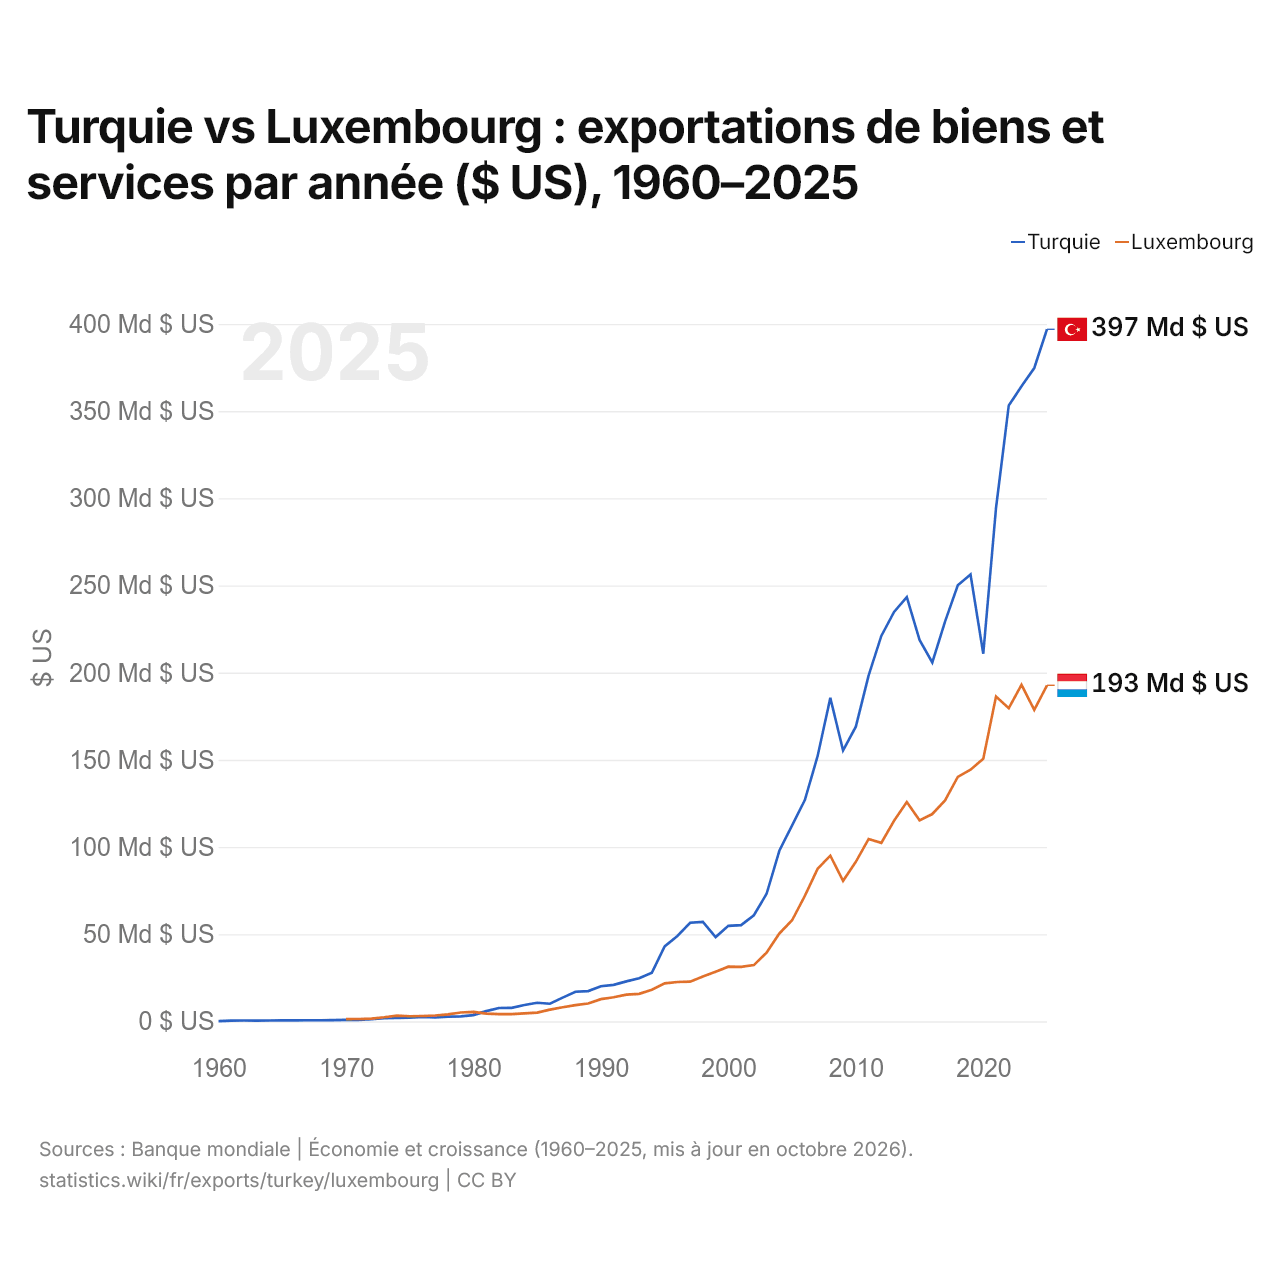
Turquie vs Luxembourg : exportations de biens et services par année ($ US), 1960–2025
| Année | $ US | |
|---|---|---|
 Turquie |
 Luxembourg |
|
| 2025 | 396 923 725 496 $ US | 192 728 057 158 $ US |
| 2024 | 374 686 274 270 $ US | 178 661 670 861 $ US |
| 2023 | 364 211 599 327 $ US | 193 009 113 165 $ US |
| 2022 | 353 224 790 396 $ US | 179 628 968 244 $ US |
| 2021 | 294 429 020 560 $ US | 186 265 544 320 $ US |
| 2020 | 210 844 790 112 $ US | 150 610 309 021 $ US |
| 2019 | 256 263 371 549 $ US | 144 341 752 039 $ US |
| 2018 | 250 128 750 717 $ US | 140 193 787 083 $ US |
| 2017 | 229 267 970 164 $ US | 126 658 587 133 $ US |
| 2016 | 205 793 476 583 $ US | 118 895 618 024 $ US |
| 2015 | 218 795 091 046 $ US | 115 238 581 123 $ US |
| 2014 | 243 287 863 473 $ US | 125 763 218 896 $ US |
| 2013 | 234 800 269 886 $ US | 115 007 710 906 $ US |
| 2012 | 221 029 283 948 $ US | 102 344 215 079 $ US |
| 2011 | 198 303 837 476 $ US | 104 568 486 413 $ US |
| 2010 | 168 951 184 650 $ US | 91 465 696 293 $ US |
| 2009 | 155 351 324 873 $ US | 80 570 783 796 $ US |
| 2008 | 185 490 178 806 $ US | 95 030 426 101 $ US |
| 2007 | 152 035 619 691 $ US | 87 480 215 781 $ US |
| 2006 | 126 908 581 381 $ US | 71 977 613 140 $ US |
| 2005 | 112 432 994 612 $ US | 57 949 162 558 $ US |
| 2004 | 97 840 598 666 $ US | 50 400 230 064 $ US |
| 2003 | 73 154 313 089 $ US | 39 412 388 094 $ US |
| 2002 | 60 832 867 533 $ US | 32 249 319 538 $ US |
| 2001 | 55 193 312 761 $ US | 31 268 767 983 $ US |
| 2000 | 54 766 754 849 $ US | 31 345 279 140 $ US |
| 1999 | 48 333 647 259 $ US | 28 455 196 289 $ US |
| 1998 | 57 013 676 915 $ US | 25 731 039 120 $ US |
| 1997 | 56 559 938 761 $ US | 22 737 276 725 $ US |
| 1996 | 48 967 049 936 $ US | 22 562 990 228 $ US |
| 1995 | 43 006 009 379 $ US | 21 787 067 597 $ US |
| 1994 | 27 909 720 018 $ US | 18 080 553 412 $ US |
| 1993 | 24 669 695 039 $ US | 15 744 739 972 $ US |
| 1992 | 22 898 733 993 $ US | 15 301 225 847 $ US |
| 1991 | 20 904 913 710 $ US | 13 779 657 413 $ US |
| 1990 | 20 135 262 553 $ US | 12 742 102 849 $ US |
| 1989 | 17 357 728 558 $ US | 10 219 753 276 $ US |
| 1988 | 16 951 828 411 $ US | 9 327 494 240 $ US |
| 1987 | 13 584 947 491 $ US | 8 110 552 134 $ US |
| 1986 | 10 073 925 926 $ US | 6 703 202 998 $ US |
| 1985 | 10 663 601 533 $ US | 5 014 838 644 $ US |
| 1984 | 9 354 223 433 $ US | 4 532 564 926 $ US |
| 1983 | 7 708 888 889 $ US | 4 124 129 389 $ US |
| 1982 | 7 636 809 816 $ US | 4 137 952 499 $ US |
| 1981 | 5 863 063 063 $ US | 4 423 440 895 $ US |
| 1980 | 3 552 631 579 $ US | 5 383 032 142 $ US |
| 1979 | 2 883 870 968 $ US | 5 067 336 269 $ US |
| 1978 | 2 733 333 333 $ US | 3 993 266 299 $ US |
| 1977 | 2 238 888 889 $ US | 3 324 898 143 $ US |
| 1976 | 2 500 000 000 $ US | 3 047 749 216 $ US |
| 1975 | 2 035 714 286 $ US | 2 917 697 708 $ US |
| 1974 | 2 028 571 429 $ US | 3 300 803 645 $ US |
| 1973 | 1 828 571 429 $ US | 2 355 188 367 $ US |
| 1972 | 1 242 857 143 $ US | 1 592 229 860 $ US |
| 1971 | 860 000 000 $ US | 1 352 359 884 $ US |
| 1970 | 790 909 091 $ US | 1 308 913 271 $ US |
| 1969 | 700 000 000 $ US | - |
| 1968 | 644 444 444 $ US | - |
| 1967 | 644 444 444 $ US | - |
| 1966 | 577 777 778 $ US | - |
| 1965 | 544 444 444 $ US | - |
| 1964 | 500 000 000 $ US | - |
| 1963 | 433 333 333 $ US | - |
| 1962 | 500 000 000 $ US | - |
| 1961 | 411 111 111 $ US | - |
| 1960 | 155 555 556 $ US | - |
En 2025, les exportations de biens et services de la Turquie s'élevaient à 397 milliards de dollars et celles du Luxembourg à 193 milliards de dollars : celles de la Turquie étaient 2,1 fois plus élevées. En 1970, les exportations du Luxembourg étaient 1,7 fois plus élevées : 791 millions de dollars pour la Turquie et 1,31 milliard de dollars pour le Luxembourg.
Les exportations de biens et services de la Turquie sont supérieures à celles du Luxembourg chaque année depuis 1981.
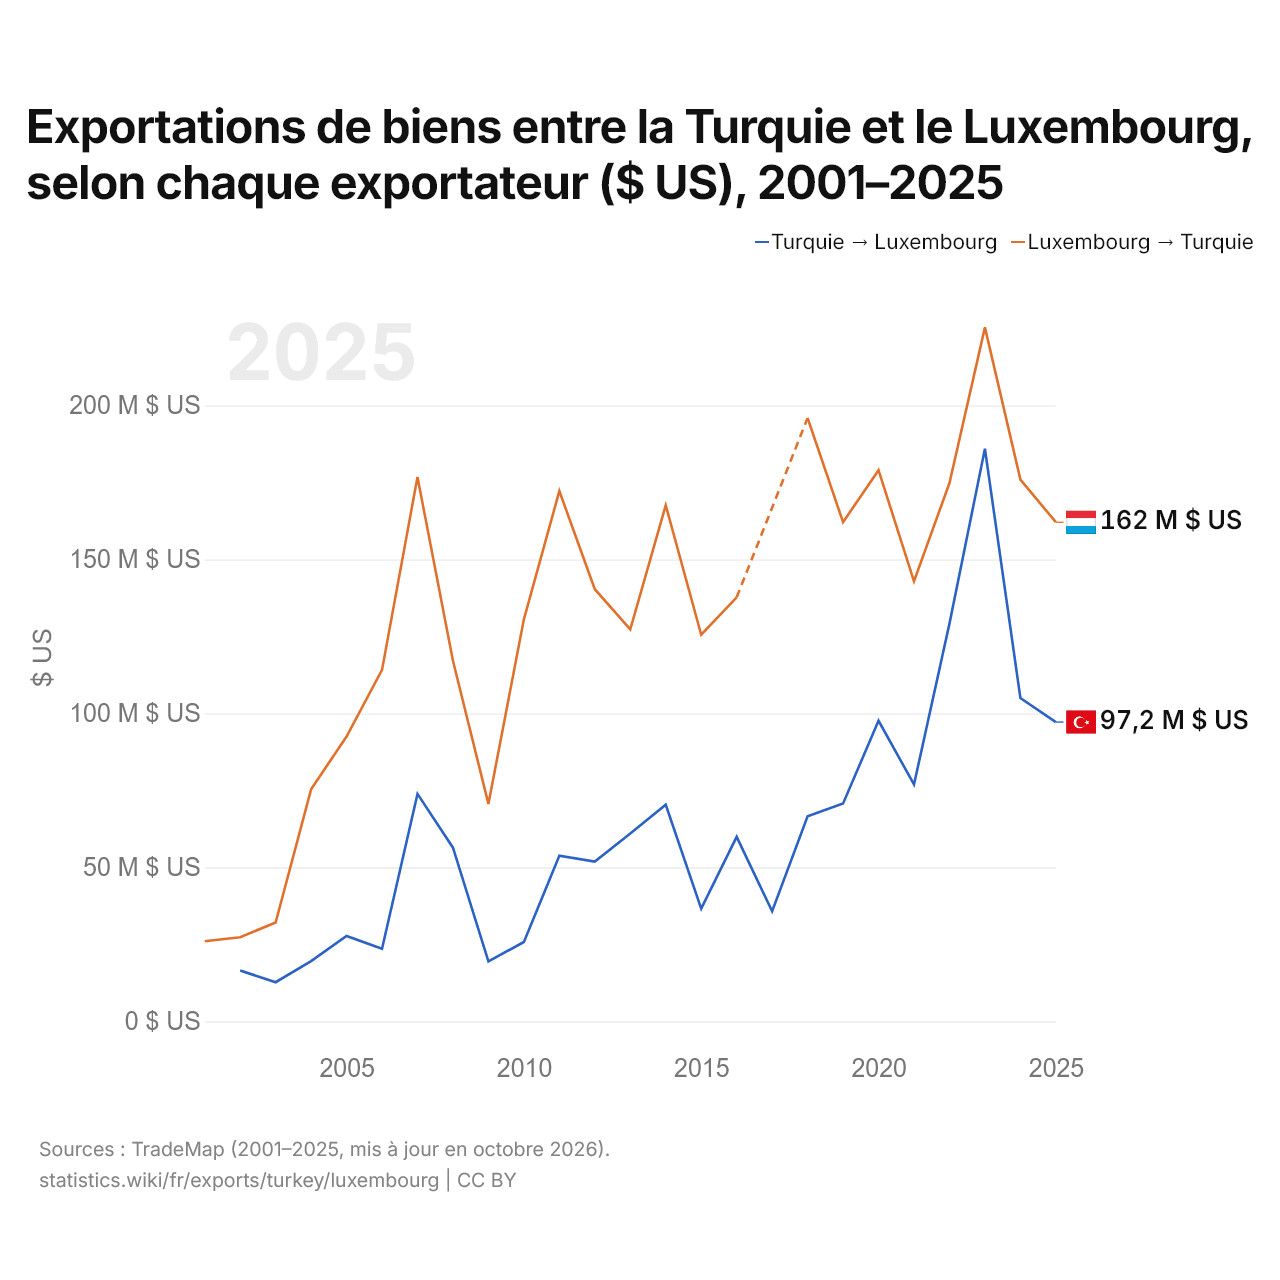
Exportations de biens entre la Turquie et le Luxembourg, selon chaque exportateur ($ US), 2001–2025
| Année | $ US | |
|---|---|---|
| Turquie → Luxembourg | Luxembourg → Turquie | |
| 2025 | 97 198 000 $ US | 162 082 000 $ US |
| 2024 | 104 995 000 $ US | 175 948 000 $ US |
| 2023 | 185 955 000 $ US | 225 356 000 $ US |
| 2022 | 129 155 000 $ US | 174 814 000 $ US |
| 2021 | 76 929 000 $ US | 142 901 000 $ US |
| 2020 | 97 613 000 $ US | 179 009 000 $ US |
| 2019 | 70 733 000 $ US | 162 109 000 $ US |
| 2018 | 66 606 000 $ US | 195 949 000 $ US |
| 2017 | 35 728 000 $ US | - |
| 2016 | 59 924 000 $ US | 137 692 000 $ US |
| 2015 | 36 587 000 $ US | 125 533 000 $ US |
| 2014 | 70 329 000 $ US | 167 595 000 $ US |
| 2013 | 60 985 000 $ US | 127 290 000 $ US |
| 2012 | 51 870 000 $ US | 140 326 000 $ US |
| 2011 | 53 757 000 $ US | 172 209 000 $ US |
| 2010 | 25 758 000 $ US | 130 545 000 $ US |
| 2009 | 19 458 000 $ US | 70 604 000 $ US |
| 2008 | 56 388 000 $ US | 117 087 000 $ US |
| 2007 | 73 870 000 $ US | 176 775 000 $ US |
| 2006 | 23 549 000 $ US | 114 134 000 $ US |
| 2005 | 27 733 000 $ US | 92 484 000 $ US |
| 2004 | 19 547 000 $ US | 75 356 000 $ US |
| 2003 | 12 706 000 $ US | 32 088 000 $ US |
| 2002 | 16 495 000 $ US | 27 314 000 $ US |
| 2001 | - | 26 012 000 $ US |
En 2025, les exportations de biens de la Turquie vers le Luxembourg, selon la Turquie, s'élevaient à 97,2 millions de dollars, et celles du Luxembourg vers la Turquie, selon le Luxembourg, à 162 millions de dollars : 1,7 fois plus pour celles du Luxembourg. En 2002, elles s'élevaient à 16,5 millions de dollars pour la Turquie et à 27,3 millions de dollars pour le Luxembourg.
Turquie vs Luxembourg : chiffres des exportations
|
Turquie
|
Luxembourg
|
|
|---|---|---|
| Exportations | 397 Md $US (2025) | 193 Md $US (2025) |
| Rang mondial | 26/176 | 35/176 |
| Part mondiale | 1,14 % | 0,55 % |
| % du PIB | 24,8 % | 190,5 % |
| Première catégorie de biens | Machines, électronique et véhicules (32,6 %, 2025) | Machines, électronique et véhicules (29 %, 2025) |
| Première destination des biens | Allemagne (8,11 %, 2025) | Allemagne (25,3 %, 2025) |
Comparer les exportations de 2 pays au choix
Sources :
- Banque mondiale | Économie et croissance (1960–2025, mis à jour en octobre 2026)
- TradeMap (2001–2025, mis à jour en octobre 2026)
Creative Commons Attribution (CC BY) : vous pouvez copier, partager, adapter et réutiliser ce contenu, y compris à des fins commerciales, à condition de citer statistics.wiki et d’indiquer les modifications apportées. Les sources citées ci-dessus peuvent avoir leurs propres conditions de licence.