
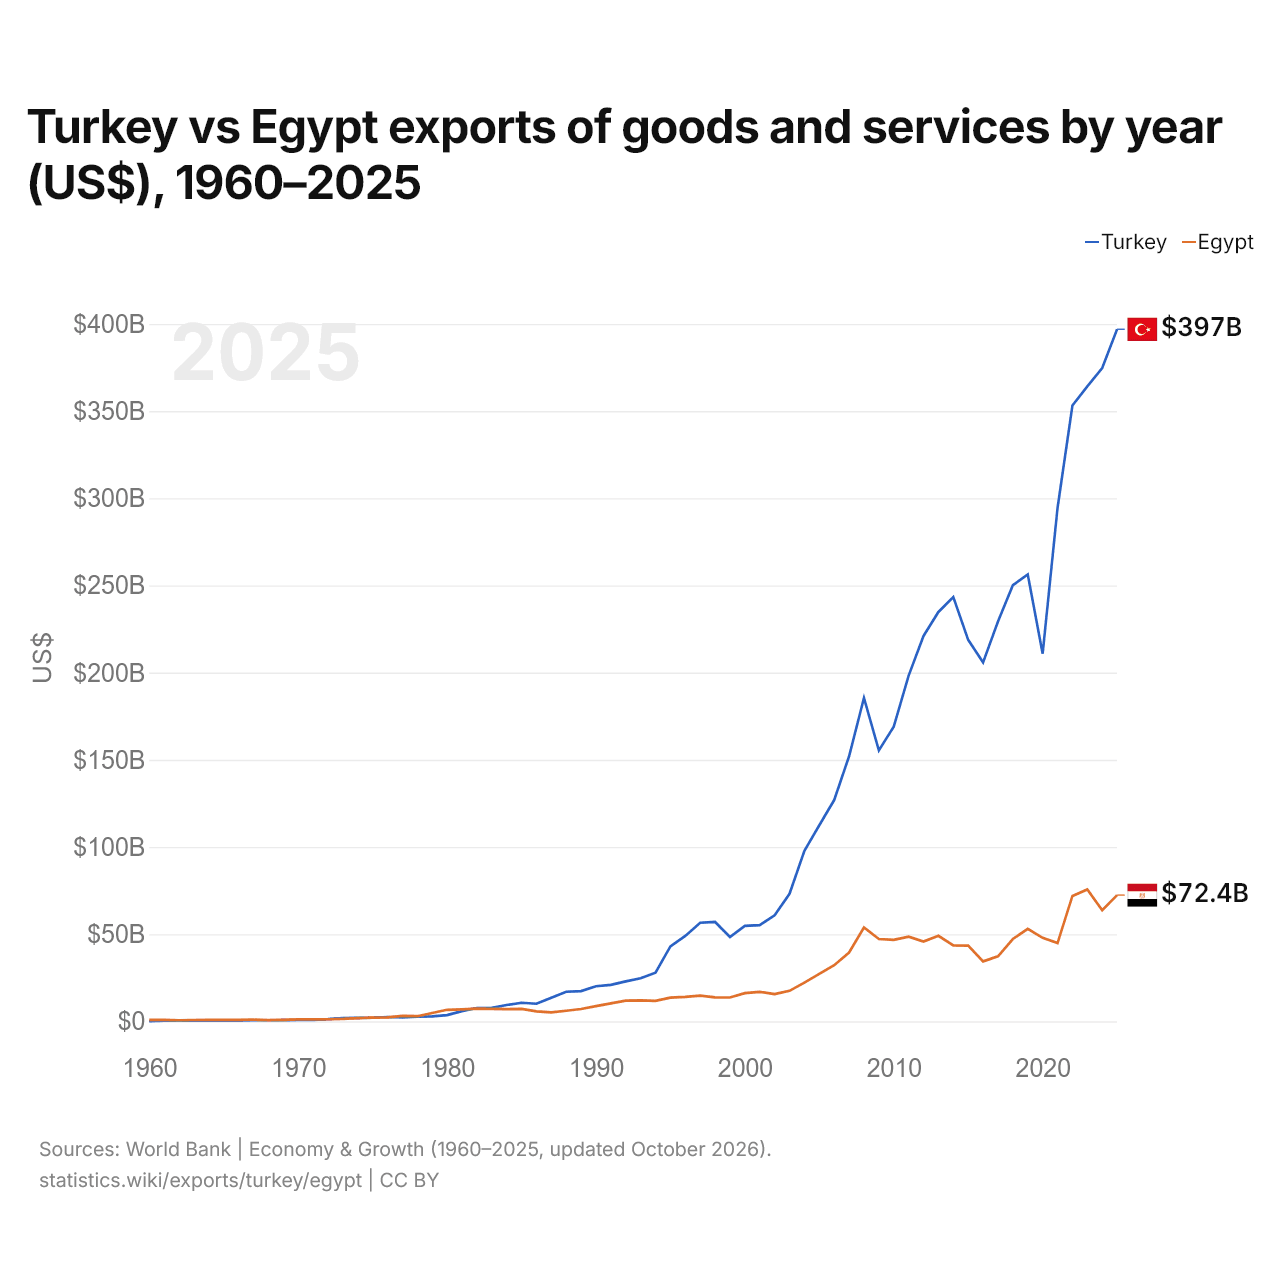
Turquie vs Égypte : exportations de biens et services par année ($ US), 1960–2025
| Année | $ US | |
|---|---|---|
 Turquie |
 Égypte |
|
| 2025 | 396 923 725 496 $ US | 72 393 571 622 $ US |
| 2024 | 374 686 274 270 $ US | 63 713 393 301 $ US |
| 2023 | 364 211 599 327 $ US | 75 645 996 852 $ US |
| 2022 | 353 224 790 396 $ US | 71 927 051 672 $ US |
| 2021 | 294 429 020 560 $ US | 44 850 223 072 $ US |
| 2020 | 210 844 790 112 $ US | 47 872 738 615 $ US |
| 2019 | 256 263 371 549 $ US | 53 041 002 278 $ US |
| 2018 | 250 128 750 717 $ US | 47 225 661 227 $ US |
| 2017 | 229 267 970 164 $ US | 37 289 402 174 $ US |
| 2016 | 205 793 476 583 $ US | 34 392 638 037 $ US |
| 2015 | 218 795 091 046 $ US | 43 423 180 593 $ US |
| 2014 | 243 287 863 473 $ US | 43 529 411 765 $ US |
| 2013 | 234 800 269 886 $ US | 49 085 271 318 $ US |
| 2012 | 221 029 283 948 $ US | 45 766 666 667 $ US |
| 2011 | 198 303 837 476 $ US | 48 537 005 164 $ US |
| 2010 | 168 951 184 650 $ US | 46 751 361 162 $ US |
| 2009 | 155 351 324 873 $ US | 47 205 081 670 $ US |
| 2008 | 185 490 178 806 $ US | 53 800 000 000 $ US |
| 2007 | 152 035 619 691 $ US | 39 457 092 820 $ US |
| 2006 | 126 908 581 381 $ US | 32 173 913 043 $ US |
| 2005 | 112 432 994 612 $ US | 27 206 127 206 $ US |
| 2004 | 97 840 598 666 $ US | 22 240 259 740 $ US |
| 2003 | 73 154 313 089 $ US | 17 500 000 000 $ US |
| 2002 | 60 832 867 533 $ US | 15 595 505 618 $ US |
| 2001 | 55 193 312 761 $ US | 16 900 269 542 $ US |
| 2000 | 54 766 754 849 $ US | 16 174 959 636 $ US |
| 1999 | 48 333 647 259 $ US | 13 653 789 443 $ US |
| 1998 | 57 013 676 915 $ US | 13 754 427 391 $ US |
| 1997 | 56 559 938 761 $ US | 14 778 761 062 $ US |
| 1996 | 48 967 049 936 $ US | 14 033 018 868 $ US |
| 1995 | 43 006 009 379 $ US | 13 565 319 965 $ US |
| 1994 | 27 909 720 018 $ US | 11 714 116 251 $ US |
| 1993 | 24 669 695 039 $ US | 12 034 813 926 $ US |
| 1992 | 22 898 733 993 $ US | 11 885 776 186 $ US |
| 1991 | 20 904 913 710 $ US | 10 269 192 423 $ US |
| 1990 | 20 135 262 553 $ US | 8 748 317 631 $ US |
| 1989 | 17 357 728 558 $ US | 7 073 523 337 $ US |
| 1988 | 16 951 828 411 $ US | 6 076 093 129 $ US |
| 1987 | 13 584 947 491 $ US | 5 106 048 704 $ US |
| 1986 | 10 073 925 926 $ US | 5 706 267 540 $ US |
| 1985 | 10 663 601 533 $ US | 7 119 673 333 $ US |
| 1984 | 9 354 223 433 $ US | 6 987 744 571 $ US |
| 1983 | 7 708 888 889 $ US | 7 101 280 559 $ US |
| 1982 | 7 636 809 816 $ US | 7 282 512 315 $ US |
| 1981 | 5 863 063 063 $ US | 6 853 648 649 $ US |
| 1980 | 3 552 631 579 $ US | 6 612 494 097 $ US |
| 1979 | 2 883 870 968 $ US | 4 774 142 857 $ US |
| 1978 | 2 733 333 333 $ US | 2 947 998 787 $ US |
| 1977 | 2 238 888 889 $ US | 3 108 577 443 $ US |
| 1976 | 2 500 000 000 $ US | 2 285 998 014 $ US |
| 1975 | 2 035 714 286 $ US | 2 113 327 488 $ US |
| 1974 | 2 028 571 429 $ US | 1 879 700 810 $ US |
| 1973 | 1 828 571 429 $ US | 1 366 851 945 $ US |
| 1972 | 1 242 857 143 $ US | 1 182 006 205 $ US |
| 1971 | 860 000 000 $ US | 1 140 015 302 $ US |
| 1970 | 790 909 091 $ US | 1 091 183 120 $ US |
| 1969 | 700 000 000 $ US | 877 723 971 $ US |
| 1968 | 644 444 444 $ US | 700 000 000 $ US |
| 1967 | 644 444 444 $ US | 943 166 740 $ US |
| 1966 | 577 777 778 $ US | 862 076 408 $ US |
| 1965 | 544 444 444 $ US | 847 750 109 $ US |
| 1964 | 500 000 000 $ US | 866 409 220 $ US |
| 1963 | 433 333 333 $ US | 743 589 331 $ US |
| 1962 | 500 000 000 $ US | 607 433 082 $ US |
| 1961 | 411 111 111 $ US | 793 126 619 $ US |
| 1960 | 155 555 556 $ US | 835 625 800 $ US |
En 2025, les exportations de biens et services de la Turquie s'élevaient à 397 milliards de dollars et celles de l'Égypte à 72,4 milliards de dollars : celles de la Turquie étaient 5,5 fois plus élevées. En 1960, les exportations de l'Égypte étaient 5,4 fois plus élevées : 156 millions de dollars pour la Turquie et 836 millions de dollars pour l'Égypte.
Les exportations de biens et services de la Turquie sont supérieures à celles de l'Égypte chaque année depuis 1982.
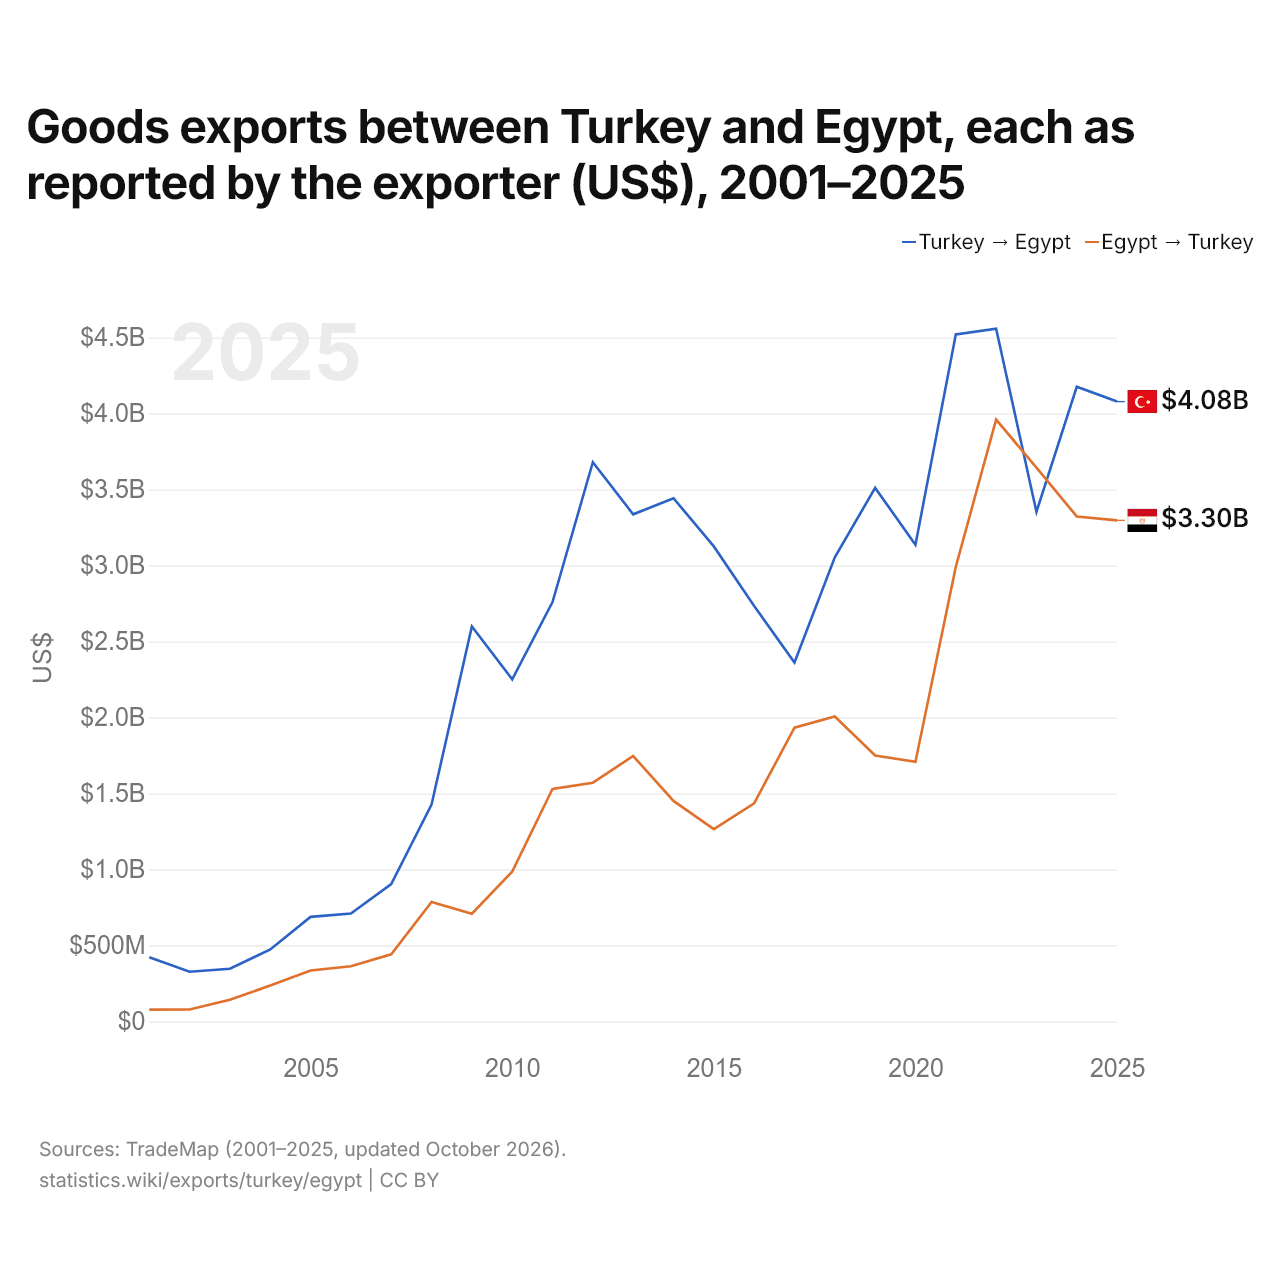
Exportations de biens entre la Turquie et l'Égypte, selon chaque exportateur ($ US), 2001–2025
| Année | $ US | |
|---|---|---|
| Turquie → Égypte | Égypte → Turquie | |
| 2025 | 4 078 028 000 $ US | 3 296 690 000 $ US |
| 2024 | 4 176 025 000 $ US | 3 322 335 000 $ US |
| 2023 | 3 352 651 000 $ US | 3 643 856 000 $ US |
| 2022 | 4 557 744 000 $ US | 3 959 942 000 $ US |
| 2021 | 4 519 351 000 $ US | 2 990 617 000 $ US |
| 2020 | 3 136 568 000 $ US | 1 707 900 000 $ US |
| 2019 | 3 510 629 000 $ US | 1 748 647 000 $ US |
| 2018 | 3 053 571 000 $ US | 2 005 554 000 $ US |
| 2017 | 2 360 734 000 $ US | 1 932 876 000 $ US |
| 2016 | 2 733 143 000 $ US | 1 434 547 000 $ US |
| 2015 | 3 124 968 000 $ US | 1 265 336 000 $ US |
| 2014 | 3 442 287 000 $ US | 1 450 638 000 $ US |
| 2013 | 3 336 392 000 $ US | 1 746 077 000 $ US |
| 2012 | 3 679 195 000 $ US | 1 570 177 000 $ US |
| 2011 | 2 759 311 000 $ US | 1 528 780 000 $ US |
| 2010 | 2 250 577 000 $ US | 985 260 000 $ US |
| 2009 | 2 599 030 000 $ US | 707 853 000 $ US |
| 2008 | 1 426 450 000 $ US | 785 036 000 $ US |
| 2007 | 902 703 000 $ US | 440 512 000 $ US |
| 2006 | 709 353 000 $ US | 362 742 000 $ US |
| 2005 | 687 299 000 $ US | 334 337 000 $ US |
| 2004 | 473 145 000 $ US | 235 234 000 $ US |
| 2003 | 345 779 000 $ US | 142 333 000 $ US |
| 2002 | 326 389 000 $ US | 77 847 000 $ US |
| 2001 | 421 469 000 $ US | 76 527 000 $ US |
En 2025, les exportations de biens de la Turquie vers l'Égypte, selon la Turquie, s'élevaient à 4,08 milliards de dollars, et celles de l'Égypte vers la Turquie, selon l'Égypte, à 3,3 milliards de dollars : 24 % de plus pour celles de la Turquie. En 2001, elles s'élevaient à 421 millions de dollars pour la Turquie et à 76,5 millions de dollars pour l'Égypte.
Turquie vs Égypte : chiffres des exportations
|
Turquie
|
Égypte
|
|
|---|---|---|
| Exportations | 397 Md $US (2025) | 72,4 Md $US (2025) |
| Rang mondial | 26/176 | 54/176 |
| Part mondiale | 1,14 % | 0,21 % |
| % du PIB | 24,8 % | 19,8 % |
| Première catégorie de biens | Machines, électronique et véhicules (32,6 %, 2025) | Pétrole, gaz, minerais et autres matières premières (19,8 %, 2025) |
| Première destination des biens | Allemagne (8,11 %, 2025) | Émirats arabes unis (13,7 %, 2025) |
Comparer les exportations de 2 pays au choix
Sources :
- Banque mondiale | Économie et croissance (1960–2025, mis à jour en octobre 2026)
- TradeMap (2001–2025, mis à jour en octobre 2026)
Creative Commons Attribution (CC BY) : vous pouvez copier, partager, adapter et réutiliser ce contenu, y compris à des fins commerciales, à condition de citer statistics.wiki et d’indiquer les modifications apportées. Les sources citées ci-dessus peuvent avoir leurs propres conditions de licence.