
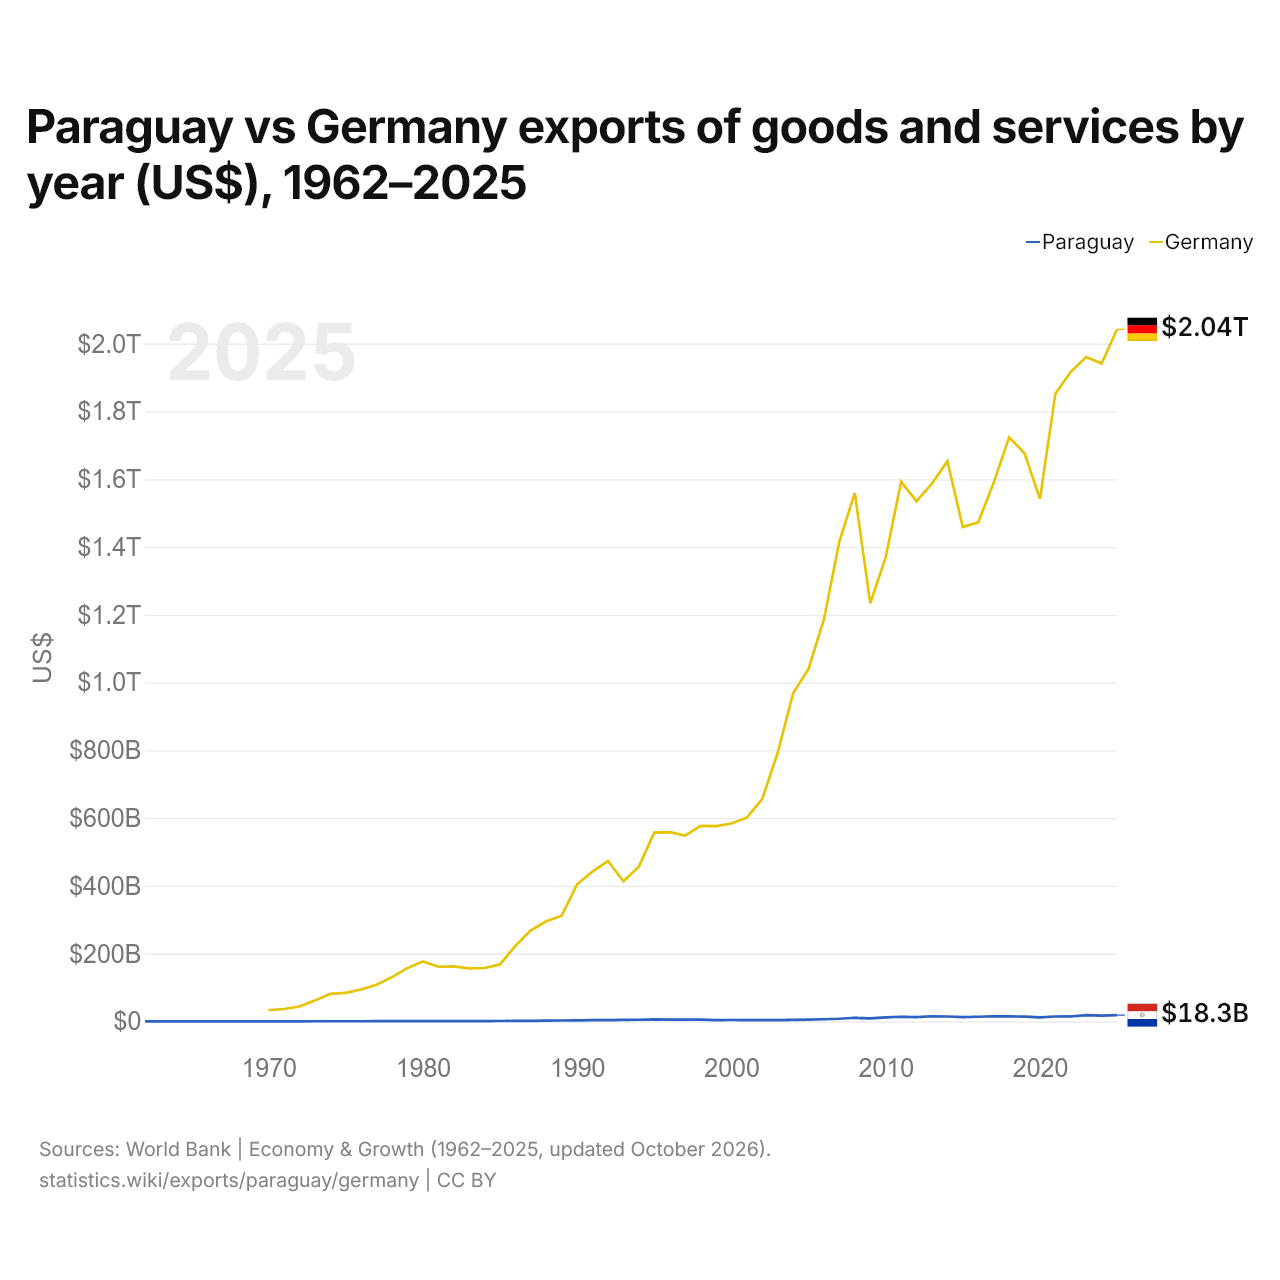
Paraguay vs Allemagne : exportations de biens et services par année ($ US), 1962–2025
| Année | $ US | |
|---|---|---|
 Paraguay |
 Allemagne |
|
| 2025 | 18 320 665 710 $ US | 2 042 329 262 308 $ US |
| 2024 | 16 872 593 925 $ US | 1 941 431 210 622 $ US |
| 2023 | 18 230 152 446 $ US | 1 960 255 682 616 $ US |
| 2022 | 14 393 374 838 $ US | 1 916 859 170 749 $ US |
| 2021 | 14 163 870 137 $ US | 1 851 846 071 996 $ US |
| 2020 | 11 788 507 798 $ US | 1 541 867 660 412 $ US |
| 2019 | 13 686 227 184 $ US | 1 676 629 137 012 $ US |
| 2018 | 14 824 374 396 $ US | 1 723 433 049 609 $ US |
| 2017 | 14 884 925 311 $ US | 1 589 089 750 187 $ US |
| 2016 | 13 404 881 409 $ US | 1 472 560 807 846 $ US |
| 2015 | 12 577 922 818 $ US | 1 458 592 274 325 $ US |
| 2014 | 14 319 795 162 $ US | 1 653 100 023 449 $ US |
| 2013 | 14 905 195 671 $ US | 1 586 778 324 179 $ US |
| 2012 | 12 641 839 183 $ US | 1 535 179 851 348 $ US |
| 2011 | 13 583 125 547 $ US | 1 592 275 709 232 $ US |
| 2010 | 11 487 694 357 $ US | 1 369 340 699 300 $ US |
| 2009 | 8 516 698 731 $ US | 1 233 301 486 982 $ US |
| 2008 | 10 446 318 050 $ US | 1 559 414 079 162 $ US |
| 2007 | 7 745 197 916 $ US | 1 415 809 341 319 $ US |
| 2006 | 6 216 897 492 $ US | 1 187 129 764 084 $ US |
| 2005 | 5 110 362 043 $ US | 1 040 265 986 689 $ US |
| 2004 | 4 397 197 655 $ US | 967 940 099 859 $ US |
| 2003 | 3 626 068 859 $ US | 792 550 922 246 $ US |
| 2002 | 3 416 430 255 $ US | 655 732 684 858 $ US |
| 2001 | 3 452 915 687 $ US | 600 934 274 700 $ US |
| 2000 | 3 837 259 043 $ US | 583 812 721 398 $ US |
| 1999 | 3 781 642 164 $ US | 576 268 522 696 $ US |
| 1998 | 5 059 911 870 $ US | 576 778 926 309 $ US |
| 1997 | 4 830 120 259 $ US | 548 072 411 460 $ US |
| 1996 | 5 162 446 922 $ US | 558 519 625 682 $ US |
| 1995 | 5 598 134 199 $ US | 557 027 432 783 $ US |
| 1994 | 4 787 159 383 $ US | 456 474 629 384 $ US |
| 1993 | 4 343 942 839 $ US | 413 275 760 085 $ US |
| 1992 | 3 566 831 493 $ US | 473 020 663 745 $ US |
| 1991 | 3 550 997 047 $ US | 442 049 499 116 $ US |
| 1990 | 3 035 291 402 $ US | 404 361 405 399 $ US |
| 1989 | 2 468 316 706 $ US | 311 798 995 111 $ US |
| 1988 | 2 059 098 946 $ US | 295 364 621 896 $ US |
| 1987 | 1 444 433 946 $ US | 268 359 809 576 $ US |
| 1986 | 1 276 819 838 $ US | 222 600 598 937 $ US |
| 1985 | 888 944 749 $ US | 167 947 100 053 $ US |
| 1984 | 827 269 915 $ US | 157 450 977 940 $ US |
| 1983 | 525 092 105 $ US | 156 299 761 777 $ US |
| 1982 | 657 801 471 $ US | 161 985 626 662 $ US |
| 1981 | 627 833 333 $ US | 161 088 263 090 $ US |
| 1980 | 615 865 079 $ US | 176 861 953 949 $ US |
| 1979 | 548 674 603 $ US | 157 013 153 345 $ US |
| 1978 | 471 531 746 $ US | 130 525 539 435 $ US |
| 1977 | 407 007 937 $ US | 107 912 072 770 $ US |
| 1976 | 249 071 429 $ US | 93 878 705 142 $ US |
| 1975 | 199 642 857 $ US | 83 906 542 650 $ US |
| 1974 | 206 802 695 $ US | 81 166 870 985 $ US |
| 1973 | 148 968 254 $ US | 61 138 960 117 $ US |
| 1972 | 105 873 016 $ US | 43 607 225 051 $ US |
| 1971 | 88 888 889 $ US | 36 378 984 554 $ US |
| 1970 | 88 698 413 $ US | 32 635 821 087 $ US |
| 1969 | 75 531 746 $ US | - |
| 1968 | 63 952 381 $ US | - |
| 1967 | 60 198 413 $ US | - |
| 1966 | 61 714 286 $ US | - |
| 1965 | 66 349 206 $ US | - |
| 1964 | 50 047 619 $ US | - |
| 1963 | 44 380 952 $ US | - |
| 1962 | 45 555 556 $ US | - |
En 2025, les exportations de biens et services du Paraguay s'élevaient à 18,3 milliards de dollars et celles de l'Allemagne à 2,04 billions de dollars : celles de l'Allemagne étaient 110 fois plus élevées. En 1970, les exportations de l'Allemagne étaient 370 fois plus élevées : 88,7 millions de dollars pour le Paraguay et 32,6 milliards de dollars pour l'Allemagne.
Les exportations de biens et services de l'Allemagne sont supérieures à celles du Paraguay chaque année depuis 1970.
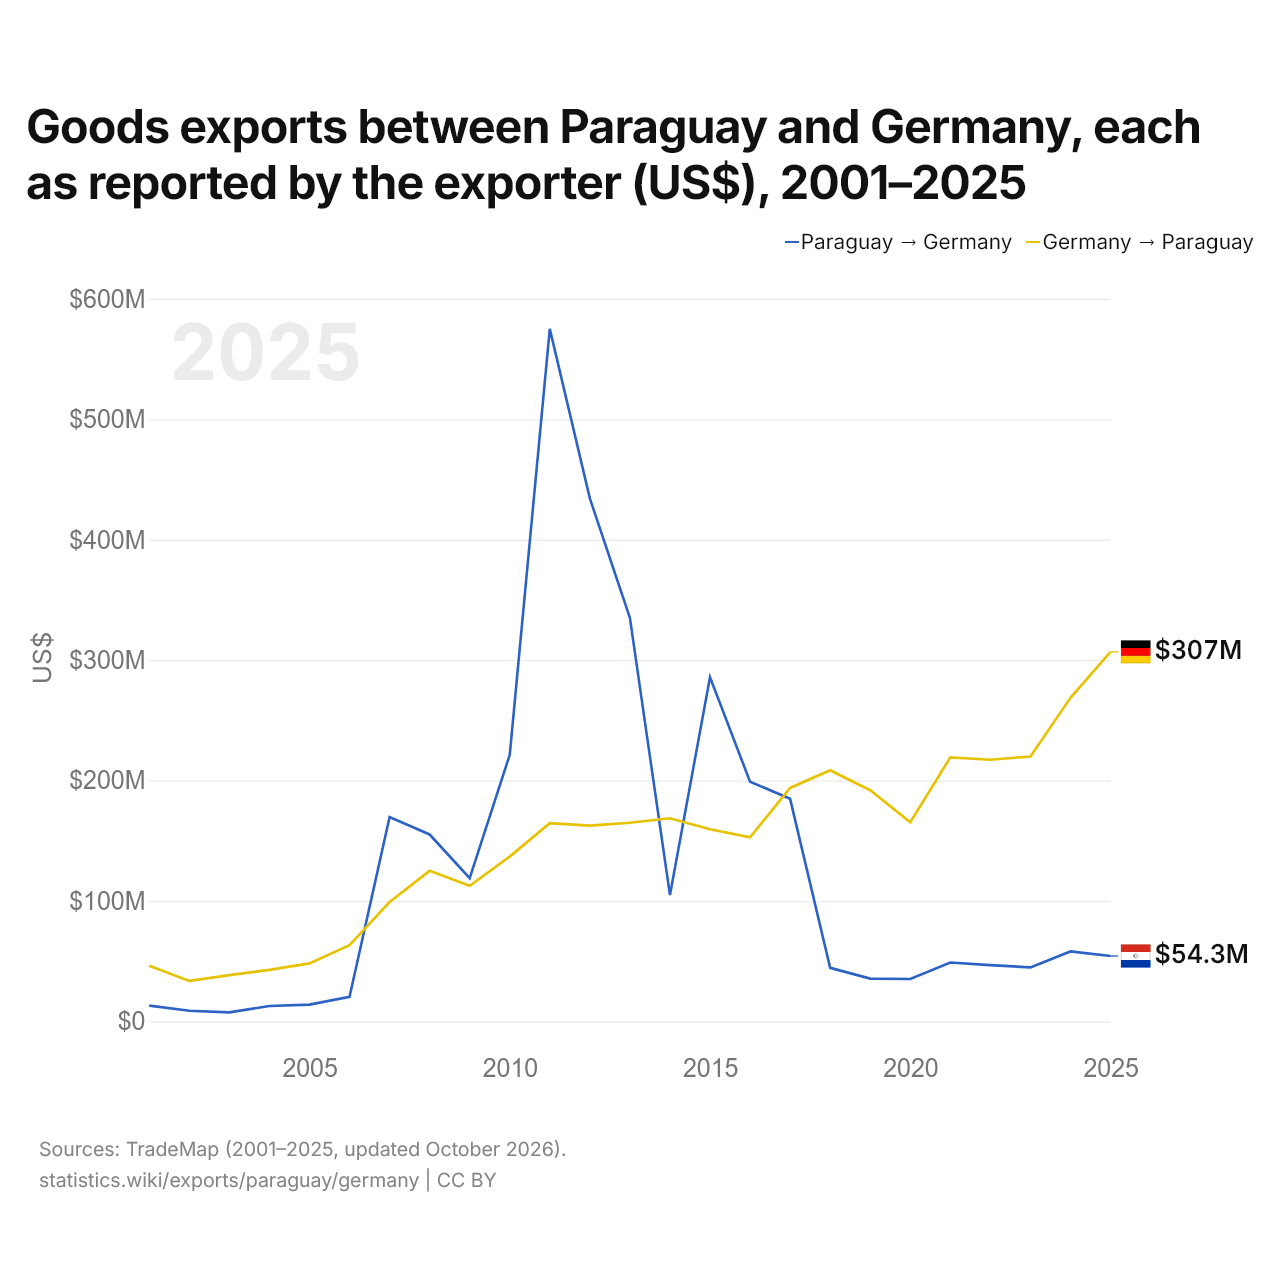
Exportations de biens entre le Paraguay et l'Allemagne, selon chaque exportateur ($ US), 2001–2025
| Année | $ US | |
|---|---|---|
| Paraguay → Allemagne | Allemagne → Paraguay | |
| 2025 | 54 265 000 $ US | 306 794 000 $ US |
| 2024 | 58 000 000 $ US | 268 590 000 $ US |
| 2023 | 44 785 000 $ US | 219 870 000 $ US |
| 2022 | 46 635 000 $ US | 217 169 000 $ US |
| 2021 | 48 860 000 $ US | 219 223 000 $ US |
| 2020 | 35 181 000 $ US | 165 337 000 $ US |
| 2019 | 35 430 000 $ US | 191 919 000 $ US |
| 2018 | 44 423 000 $ US | 208 484 000 $ US |
| 2017 | 184 749 000 $ US | 193 776 000 $ US |
| 2016 | 198 989 000 $ US | 152 809 000 $ US |
| 2015 | 285 704 000 $ US | 159 535 000 $ US |
| 2014 | 104 842 000 $ US | 168 585 000 $ US |
| 2013 | 335 069 000 $ US | 164 894 000 $ US |
| 2012 | 434 178 000 $ US | 162 547 000 $ US |
| 2011 | 574 978 000 $ US | 164 544 000 $ US |
| 2010 | 221 256 000 $ US | 136 755 000 $ US |
| 2009 | 118 794 000 $ US | 112 536 000 $ US |
| 2008 | 155 133 000 $ US | 124 947 000 $ US |
| 2007 | 169 561 000 $ US | 99 080 000 $ US |
| 2006 | 20 343 000 $ US | 63 270 000 $ US |
| 2005 | 13 863 000 $ US | 48 118 000 $ US |
| 2004 | 12 709 000 $ US | 42 677 000 $ US |
| 2003 | 7 415 000 $ US | 38 378 000 $ US |
| 2002 | 8 780 000 $ US | 33 570 000 $ US |
| 2001 | 13 056 000 $ US | 46 253 000 $ US |
En 2025, les exportations de biens du Paraguay vers l'Allemagne, selon le Paraguay, s'élevaient à 54,3 millions de dollars, et celles de l'Allemagne vers le Paraguay, selon l'Allemagne, à 307 millions de dollars : 5,7 fois plus pour celles de l'Allemagne. En 2001, elles s'élevaient à 13,1 millions de dollars pour le Paraguay et à 46,3 millions de dollars pour l'Allemagne.
Paraguay vs Allemagne : chiffres des exportations
|
Paraguay
|
Allemagne
|
|
|---|---|---|
| Exportations | 18,3 Md $US (2025) | 2,04 Bn $US (2025) |
| Rang mondial | 91/176 | 3/176 |
| Part mondiale | 0,05 % | 5,85 % |
| % du PIB | 37,2 % | 40,4 % |
| Première catégorie de biens | Cultures, plantes et fleurs (céréales, fruits, légumes, café, oléagineux) (31,2 %, 2025) | Machines, électronique et véhicules (51,8 %, 2025) |
| Première destination des biens | Brésil (35,1 %, 2025) | États-Unis (9,38 %, 2025) |
Comparer les exportations de 2 pays au choix
Sources :
- Banque mondiale | Économie et croissance (1962–2025, mis à jour en octobre 2026)
- TradeMap (2001–2025, mis à jour en octobre 2026)
Creative Commons Attribution (CC BY) : vous pouvez copier, partager, adapter et réutiliser ce contenu, y compris à des fins commerciales, à condition de citer statistics.wiki et d’indiquer les modifications apportées. Les sources citées ci-dessus peuvent avoir leurs propres conditions de licence.