
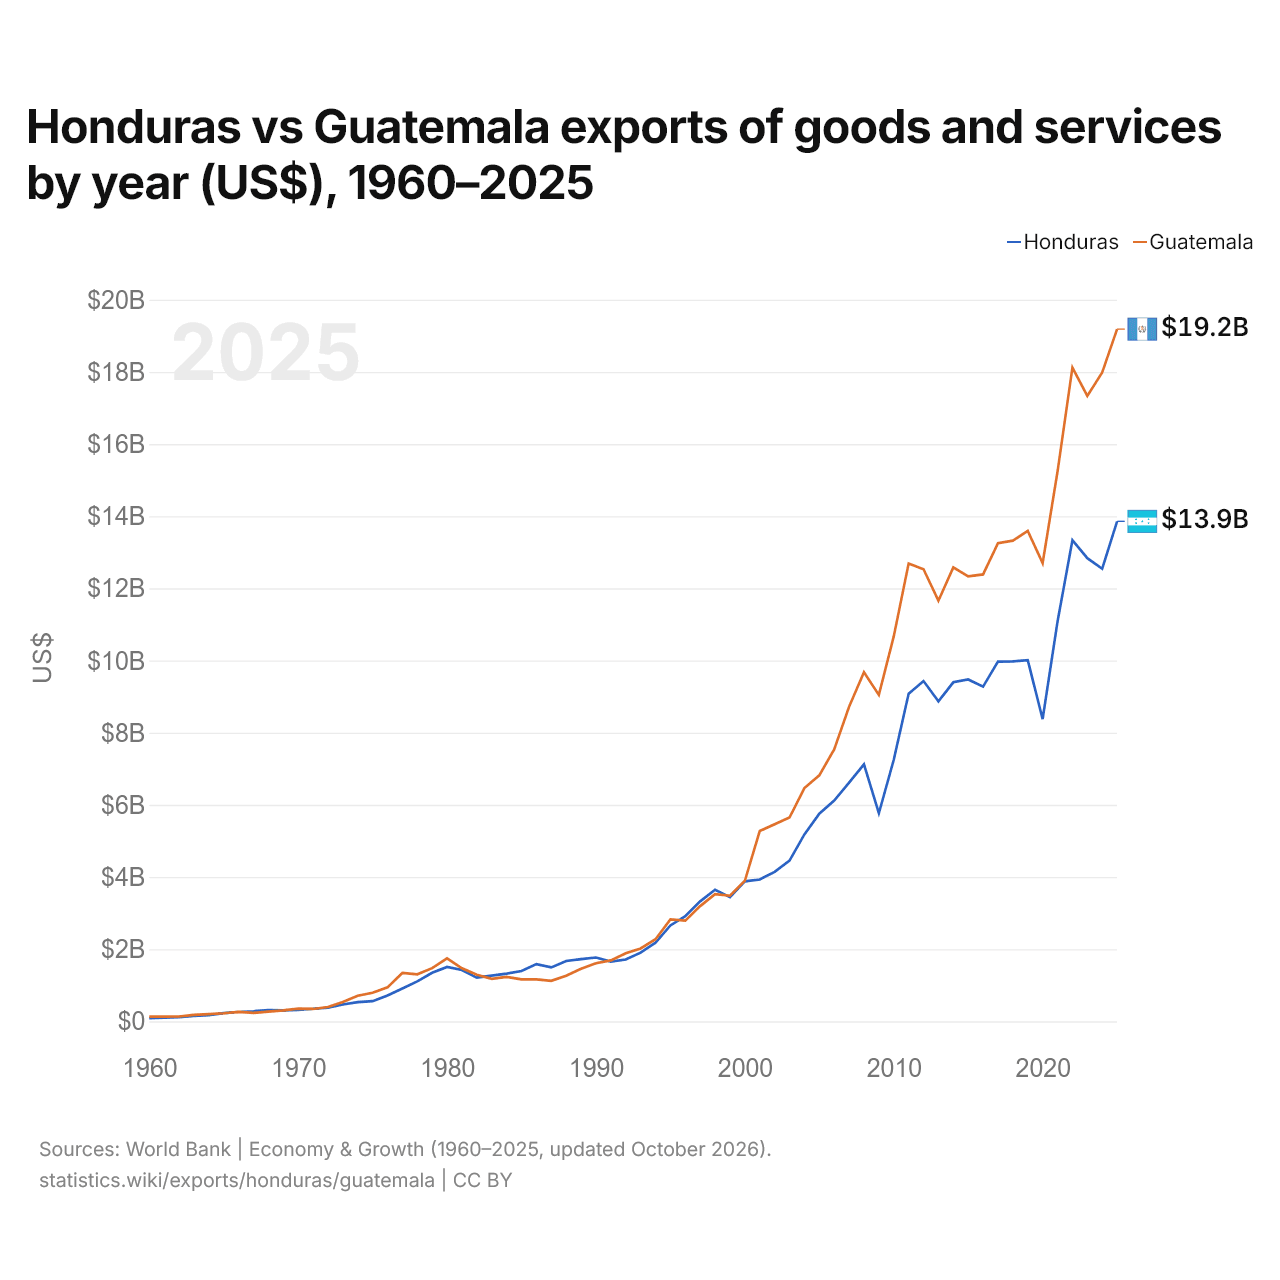
Honduras vs Guatemala : exportations de biens et services par année ($ US), 1960–2025
| Année | $ US | |
|---|---|---|
 Honduras |
 Guatemala |
|
| 2025 | 13 857 222 810 $ US | 19 185 393 858 $ US |
| 2024 | 12 544 270 435 $ US | 17 982 554 316 $ US |
| 2023 | 12 838 311 191 $ US | 17 331 724 160 $ US |
| 2022 | 13 336 955 013 $ US | 18 119 750 230 $ US |
| 2021 | 11 079 128 213 $ US | 15 241 812 022 $ US |
| 2020 | 8 377 646 121 $ US | 12 702 168 189 $ US |
| 2019 | 10 007 263 183 $ US | 13 591 570 047 $ US |
| 2018 | 9 977 241 928 $ US | 13 323 267 943 $ US |
| 2017 | 9 970 301 124 $ US | 13 252 394 991 $ US |
| 2016 | 9 276 480 535 $ US | 12 387 053 735 $ US |
| 2015 | 9 475 891 625 $ US | 12 331 439 231 $ US |
| 2014 | 9 396 732 040 $ US | 12 579 582 121 $ US |
| 2013 | 8 869 045 891 $ US | 11 658 240 732 $ US |
| 2012 | 9 431 552 770 $ US | 12 530 944 106 $ US |
| 2011 | 9 077 877 620 $ US | 12 688 259 461 $ US |
| 2010 | 7 247 910 834 $ US | 10 667 621 567 $ US |
| 2009 | 5 766 473 848 $ US | 9 046 835 389 $ US |
| 2008 | 7 124 837 294 $ US | 9 673 807 862 $ US |
| 2007 | 6 614 386 799 $ US | 8 721 101 393 $ US |
| 2006 | 6 119 752 691 $ US | 7 537 142 602 $ US |
| 2005 | 5 757 207 468 $ US | 6 817 685 367 $ US |
| 2004 | 5 181 709 224 $ US | 6 464 755 963 $ US |
| 2003 | 4 452 150 158 $ US | 5 648 926 180 $ US |
| 2002 | 4 143 703 819 $ US | 5 463 975 082 $ US |
| 2001 | 3 931 297 278 $ US | 5 275 589 193 $ US |
| 2000 | 3 878 785 429 $ US | 3 895 405 852 $ US |
| 1999 | 3 441 665 505 $ US | 3 481 400 349 $ US |
| 1998 | 3 647 511 078 $ US | 3 524 472 507 $ US |
| 1997 | 3 326 205 323 $ US | 3 194 396 326 $ US |
| 1996 | 2 912 652 027 $ US | 2 791 706 610 $ US |
| 1995 | 2 657 476 538 $ US | 2 822 490 793 $ US |
| 1994 | 2 182 094 948 $ US | 2 274 655 329 $ US |
| 1993 | 1 905 157 993 $ US | 2 018 148 609 $ US |
| 1992 | 1 713 781 626 $ US | 1 886 230 498 $ US |
| 1991 | 1 654 804 672 $ US | 1 688 646 379 $ US |
| 1990 | 1 768 750 000 $ US | 1 608 646 744 $ US |
| 1989 | 1 723 758 621 $ US | 1 455 681 818 $ US |
| 1988 | 1 672 231 760 $ US | 1 262 786 260 $ US |
| 1987 | 1 494 350 000 $ US | 1 122 800 040 $ US |
| 1986 | 1 586 500 000 $ US | 1 160 867 534 $ US |
| 1985 | 1 393 250 000 $ US | 1 161 565 304 $ US |
| 1984 | 1 323 150 000 $ US | 1 231 300 000 $ US |
| 1983 | 1 266 300 000 $ US | 1 176 000 000 $ US |
| 1982 | 1 209 450 000 $ US | 1 288 999 900 $ US |
| 1981 | 1 423 150 000 $ US | 1 471 000 100 $ US |
| 1980 | 1 508 450 000 $ US | 1 748 000 000 $ US |
| 1979 | 1 344 100 000 $ US | 1 473 600 000 $ US |
| 1978 | 1 108 300 000 $ US | 1 303 700 000 $ US |
| 1977 | 911 750 000 $ US | 1 340 300 000 $ US |
| 1976 | 717 650 000 $ US | 941 700 000 $ US |
| 1975 | 558 650 000 $ US | 792 000 000 $ US |
| 1974 | 531 200 000 $ US | 708 400 000 $ US |
| 1973 | 467 449 766 $ US | 536 500 000 $ US |
| 1972 | 375 648 310 $ US | 397 300 000 $ US |
| 1971 | 349 150 000 $ US | 343 100 000 $ US |
| 1970 | 317 950 000 $ US | 353 600 000 $ US |
| 1969 | 302 350 000 $ US | 305 400 000 $ US |
| 1968 | 314 550 000 $ US | 269 500 000 $ US |
| 1967 | 279 700 000 $ US | 235 600 000 $ US |
| 1966 | 258 750 000 $ US | 263 400 000 $ US |
| 1965 | 228 900 000 $ US | 223 500 000 $ US |
| 1964 | 171 400 000 $ US | 199 900 000 $ US |
| 1963 | 150 750 000 $ US | 180 400 000 $ US |
| 1962 | 112 000 000 $ US | 134 800 000 $ US |
| 1961 | 105 000 000 $ US | 128 700 000 $ US |
| 1960 | 87 650 000 $ US | 131 900 000 $ US |
En 2025, les exportations de biens et services du Honduras s'élevaient à 13,9 milliards de dollars et celles du Guatemala à 19,2 milliards de dollars : celles du Guatemala étaient supérieures de 38 %. En 1960, les exportations du Guatemala étaient 1,5 fois plus élevées : 87,6 millions de dollars pour le Honduras et 132 millions de dollars pour le Guatemala.
Les exportations de biens et services du Guatemala sont supérieures à celles du Honduras chaque année depuis 1999.
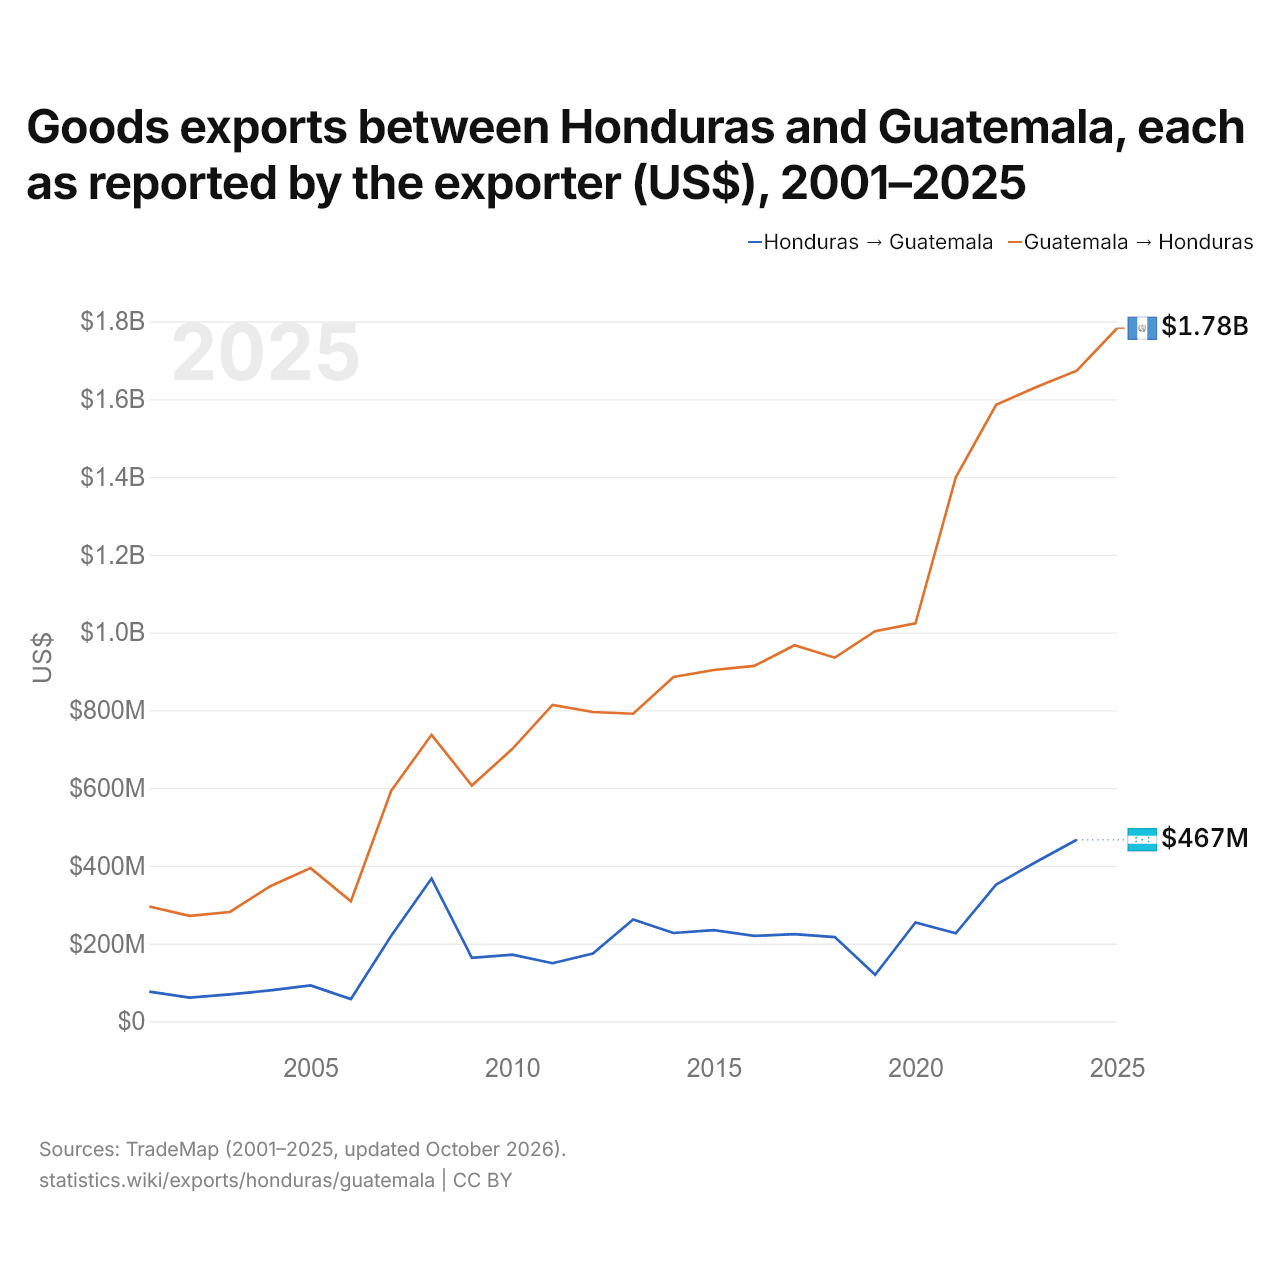
Exportations de biens entre le Honduras et le Guatemala, selon chaque exportateur ($ US), 2001–2025
| Année | $ US | |
|---|---|---|
| Honduras → Guatemala | Guatemala → Honduras | |
| 2025 | - | 1 782 405 000 $ US |
| 2024 | 466 974 000 $ US | 1 673 130 000 $ US |
| 2023 | 410 412 000 $ US | 1 631 232 000 $ US |
| 2022 | 351 832 000 $ US | 1 585 425 000 $ US |
| 2021 | 226 343 000 $ US | 1 399 024 000 $ US |
| 2020 | 254 270 000 $ US | 1 023 562 000 $ US |
| 2019 | 119 627 000 $ US | 1 003 363 000 $ US |
| 2018 | 216 563 000 $ US | 935 177 000 $ US |
| 2017 | 224 091 000 $ US | 967 261 000 $ US |
| 2016 | 219 763 000 $ US | 913 908 000 $ US |
| 2015 | 234 536 000 $ US | 903 373 000 $ US |
| 2014 | 227 199 000 $ US | 885 488 000 $ US |
| 2013 | 262 202 000 $ US | 790 979 000 $ US |
| 2012 | 174 328 000 $ US | 795 462 000 $ US |
| 2011 | 149 512 000 $ US | 813 672 000 $ US |
| 2010 | 171 329 000 $ US | 700 083 000 $ US |
| 2009 | 163 173 000 $ US | 606 383 000 $ US |
| 2008 | 367 293 000 $ US | 736 829 000 $ US |
| 2007 | 220 150 000 $ US | 592 963 000 $ US |
| 2006 | 57 274 000 $ US | 308 700 000 $ US |
| 2005 | 92 240 000 $ US | 394 043 000 $ US |
| 2004 | 79 570 000 $ US | 347 543 000 $ US |
| 2003 | 69 196 000 $ US | 281 172 000 $ US |
| 2002 | 61 051 000 $ US | 271 405 000 $ US |
| 2001 | 76 506 000 $ US | 295 306 000 $ US |
Les exportations de biens du Honduras vers le Guatemala, selon le Honduras, s'élevaient à 467 millions de dollars, et celles du Guatemala vers le Honduras, selon le Guatemala, à 1,67 milliard de dollars : 3,6 fois plus pour celles du Guatemala. En 2001, elles s'élevaient à 76,5 millions de dollars pour le Honduras et à 295 millions de dollars pour le Guatemala.
Honduras vs Guatemala : chiffres des exportations
|
Honduras
|
Guatemala
|
|
|---|---|---|
| Exportations | 13,9 Md $US (2025) | 19,2 Md $US (2025) |
| Rang mondial | 99/176 | 90/176 |
| Part mondiale | 0,04 % | 0,05 % |
| % du PIB | 35,0 % | 15,6 % |
| Première catégorie de biens | Cultures, plantes et fleurs (céréales, fruits, légumes, café, oléagineux) (26,9 %, 2024) | Cultures, plantes et fleurs (céréales, fruits, légumes, café, oléagineux) (26,7 %, 2025) |
| Première destination des biens | États-Unis (46,8 %, 2024) | États-Unis (30,9 %, 2025) |
Comparer les exportations de 2 pays au choix
Sources :
- Banque mondiale | Économie et croissance (1960–2025, mis à jour en octobre 2026)
- TradeMap (2001–2025, mis à jour en octobre 2026)
Creative Commons Attribution (CC BY) : vous pouvez copier, partager, adapter et réutiliser ce contenu, y compris à des fins commerciales, à condition de citer statistics.wiki et d’indiquer les modifications apportées. Les sources citées ci-dessus peuvent avoir leurs propres conditions de licence.