
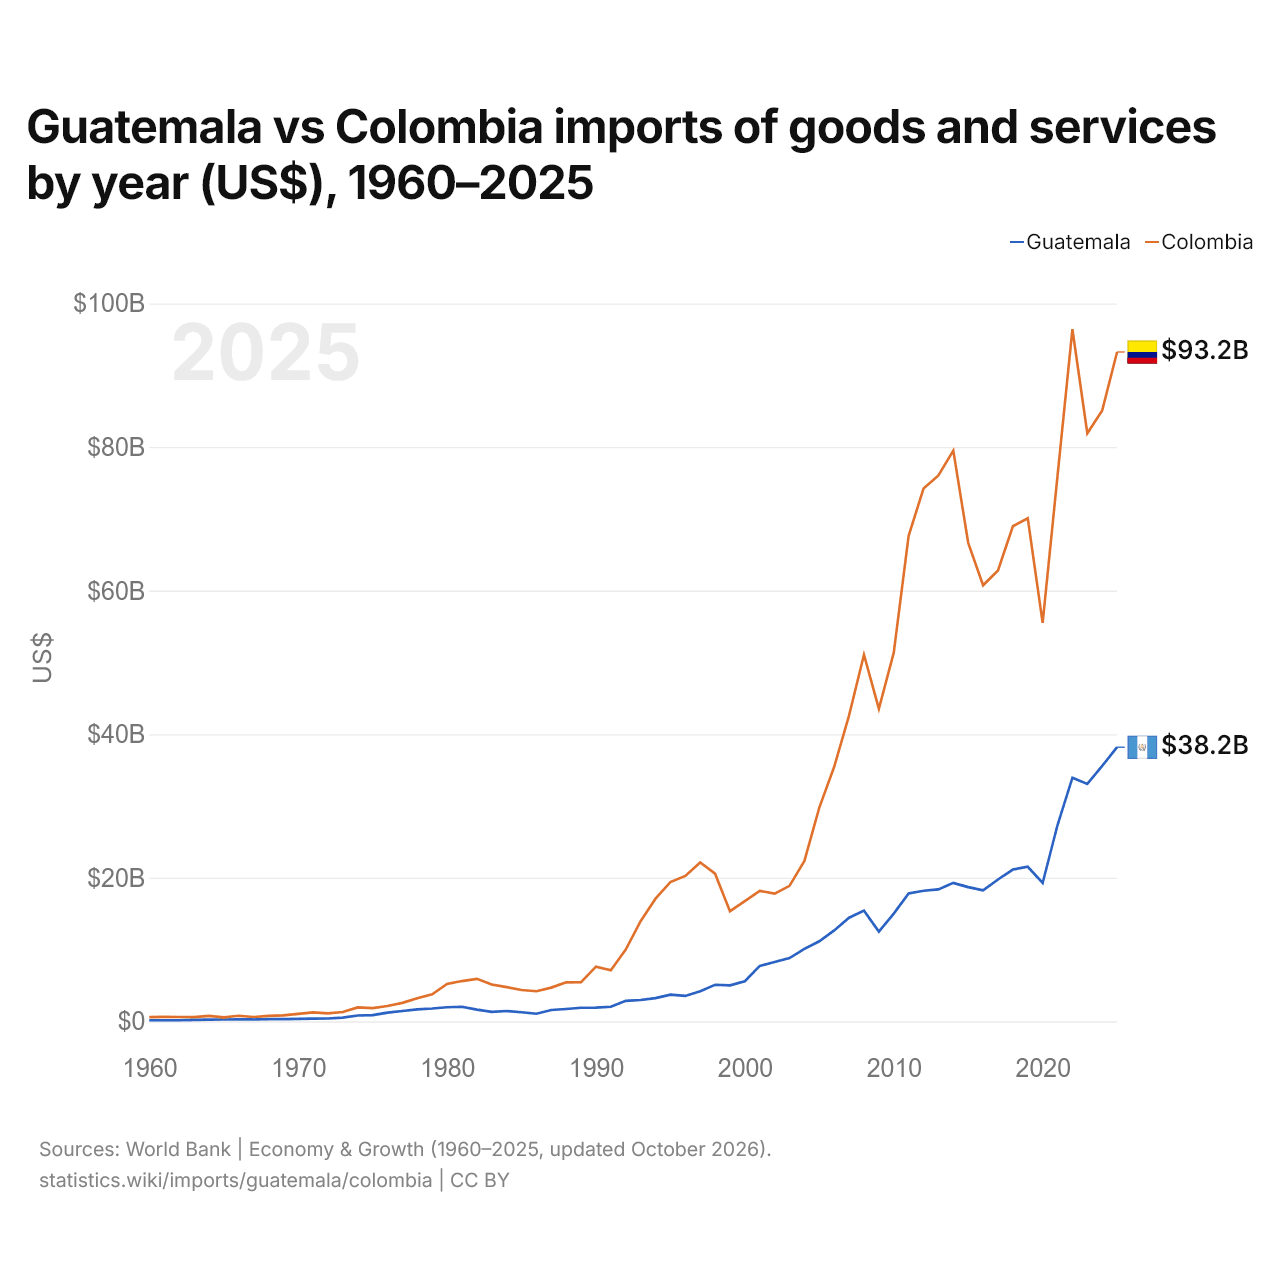
Guatemala vs Colombie : importations de biens et services par année ($ US), 1960–2025
| Année | $ US | |
|---|---|---|
 Guatemala |
 Colombie |
|
| 2025 | 38 185 944 239 $ US | 93 242 618 943 $ US |
| 2024 | 35 574 411 055 $ US | 85 099 669 252 $ US |
| 2023 | 33 075 327 753 $ US | 81 912 779 953 $ US |
| 2022 | 33 938 882 281 $ US | 96 411 719 931 $ US |
| 2021 | 27 347 172 006 $ US | 76 006 795 312 $ US |
| 2020 | 19 272 211 250 $ US | 55 511 423 807 $ US |
| 2019 | 21 534 755 034 $ US | 70 067 176 051 $ US |
| 2018 | 21 149 628 050 $ US | 68 961 912 989 $ US |
| 2017 | 19 758 074 339 $ US | 62 802 582 424 $ US |
| 2016 | 18 243 717 810 $ US | 60 743 865 897 $ US |
| 2015 | 18 695 335 942 $ US | 66 653 739 136 $ US |
| 2014 | 19 287 280 919 $ US | 79 499 076 760 $ US |
| 2013 | 18 382 911 954 $ US | 76 037 444 586 $ US |
| 2012 | 18 197 166 630 $ US | 74 226 993 322 $ US |
| 2011 | 17 803 200 265 $ US | 67 642 788 202 $ US |
| 2010 | 15 009 546 896 $ US | 51 351 305 097 $ US |
| 2009 | 12 501 436 111 $ US | 43 545 176 395 $ US |
| 2008 | 15 422 428 184 $ US | 51 066 655 641 $ US |
| 2007 | 14 441 173 646 $ US | 42 618 891 608 $ US |
| 2006 | 12 662 747 620 $ US | 35 453 316 065 $ US |
| 2005 | 11 154 959 730 $ US | 29 777 716 182 $ US |
| 2004 | 10 090 013 800 $ US | 22 356 075 160 $ US |
| 2003 | 8 807 734 237 $ US | 18 873 043 327 $ US |
| 2002 | 8 255 070 816 $ US | 17 793 883 920 $ US |
| 2001 | 7 731 202 010 $ US | 18 180 843 172 $ US |
| 2000 | 5 584 251 720 $ US | 16 731 018 377 $ US |
| 1999 | 5 011 108 418 $ US | 15 343 463 758 $ US |
| 1998 | 5 091 730 420 $ US | 20 576 289 396 $ US |
| 1997 | 4 197 706 681 $ US | 22 137 740 206 $ US |
| 1996 | 3 539 822 367 $ US | 20 252 680 332 $ US |
| 1995 | 3 726 925 963 $ US | 19 392 751 884 $ US |
| 1994 | 3 226 456 526 $ US | 17 091 698 826 $ US |
| 1993 | 2 972 656 775 $ US | 13 949 161 891 $ US |
| 1992 | 2 849 942 850 $ US | 9 985 578 591 $ US |
| 1991 | 2 028 682 331 $ US | 7 098 679 409 $ US |
| 1990 | 1 900 459 187 $ US | 7 614 454 665 $ US |
| 1989 | 1 890 234 375 $ US | 5 464 066 789 $ US |
| 1988 | 1 720 152 710 $ US | 5 433 539 691 $ US |
| 1987 | 1 579 400 000 $ US | 4 697 932 910 $ US |
| 1986 | 1 055 296 758 $ US | 4 190 788 878 $ US |
| 1985 | 1 262 260 870 $ US | 4 370 638 535 $ US |
| 1984 | 1 434 800 000 $ US | 4 767 852 803 $ US |
| 1983 | 1 316 999 900 $ US | 5 127 945 979 $ US |
| 1982 | 1 628 999 900 $ US | 5 919 610 897 $ US |
| 1981 | 2 031 500 000 $ US | 5 610 414 541 $ US |
| 1980 | 1 963 300 000 $ US | 5 209 514 725 $ US |
| 1979 | 1 784 400 000 $ US | 3 756 624 824 $ US |
| 1978 | 1 655 000 100 $ US | 3 210 026 858 $ US |
| 1977 | 1 439 000 100 $ US | 2 569 926 742 $ US |
| 1976 | 1 204 100 000 $ US | 2 131 690 445 $ US |
| 1975 | 858 000 000 $ US | 1 835 324 549 $ US |
| 1974 | 811 400 000 $ US | 1 933 488 606 $ US |
| 1973 | 519 100 000 $ US | 1 306 397 078 $ US |
| 1972 | 389 500 000 $ US | 1 109 769 650 $ US |
| 1971 | 371 100 000 $ US | 1 252 577 345 $ US |
| 1970 | 338 500 000 $ US | 1 047 700 632 $ US |
| 1969 | 299 000 000 $ US | 839 120 872 $ US |
| 1968 | 296 600 000 $ US | 763 579 000 $ US |
| 1967 | 283 600 000 $ US | 602 411 300 $ US |
| 1966 | 266 100 000 $ US | 778 814 815 $ US |
| 1965 | 261 100 000 $ US | 559 333 333 $ US |
| 1964 | 235 000 000 $ US | 755 727 700 $ US |
| 1963 | 201 200 000 $ US | 597 285 656 $ US |
| 1962 | 153 500 000 $ US | 605 929 809 $ US |
| 1961 | 145 300 000 $ US | 627 934 716 $ US |
| 1960 | 151 700 000 $ US | 594 894 695 $ US |
En 2025, les importations de biens et services du Guatemala s'élevaient à 38,2 milliards de dollars et celles de la Colombie à 93,2 milliards de dollars : celles de la Colombie étaient 2,4 fois plus élevées. En 1960, les importations de la Colombie étaient 3,9 fois plus élevées : 152 millions de dollars pour le Guatemala et 595 millions de dollars pour la Colombie.
Les importations de biens et services de la Colombie sont supérieures à celles du Guatemala chaque année depuis 1960.
Guatemala vs Colombie : chiffres des importations
|
Guatemala
|
Colombie
|
|
|---|---|---|
| Importations | 38,2 Md $US (2025) | 93,2 Md $US (2025) |
| Rang mondial | 70/174 | 52/174 |
| Part mondiale | 0,11 % | 0,28 % |
| % du PIB | 31,0 % | 20,4 % |
| Première catégorie de biens | Machines, électronique et véhicules (27,8 %, 2025) | Machines, électronique et véhicules (34 %, 2025) |
| Première origine des biens | États-Unis (31,5 %, 2025) | Chine (27,5 %, 2025) |
Comparer les importations de 2 pays au choix
Sources :
- Banque mondiale | Économie et croissance (1960–2025, mis à jour en octobre 2026)
- TradeMap (2001–2025, mis à jour en octobre 2026)
Creative Commons Attribution (CC BY) : vous pouvez copier, partager, adapter et réutiliser ce contenu, y compris à des fins commerciales, à condition de citer statistics.wiki et d’indiquer les modifications apportées. Les sources citées ci-dessus peuvent avoir leurs propres conditions de licence.