
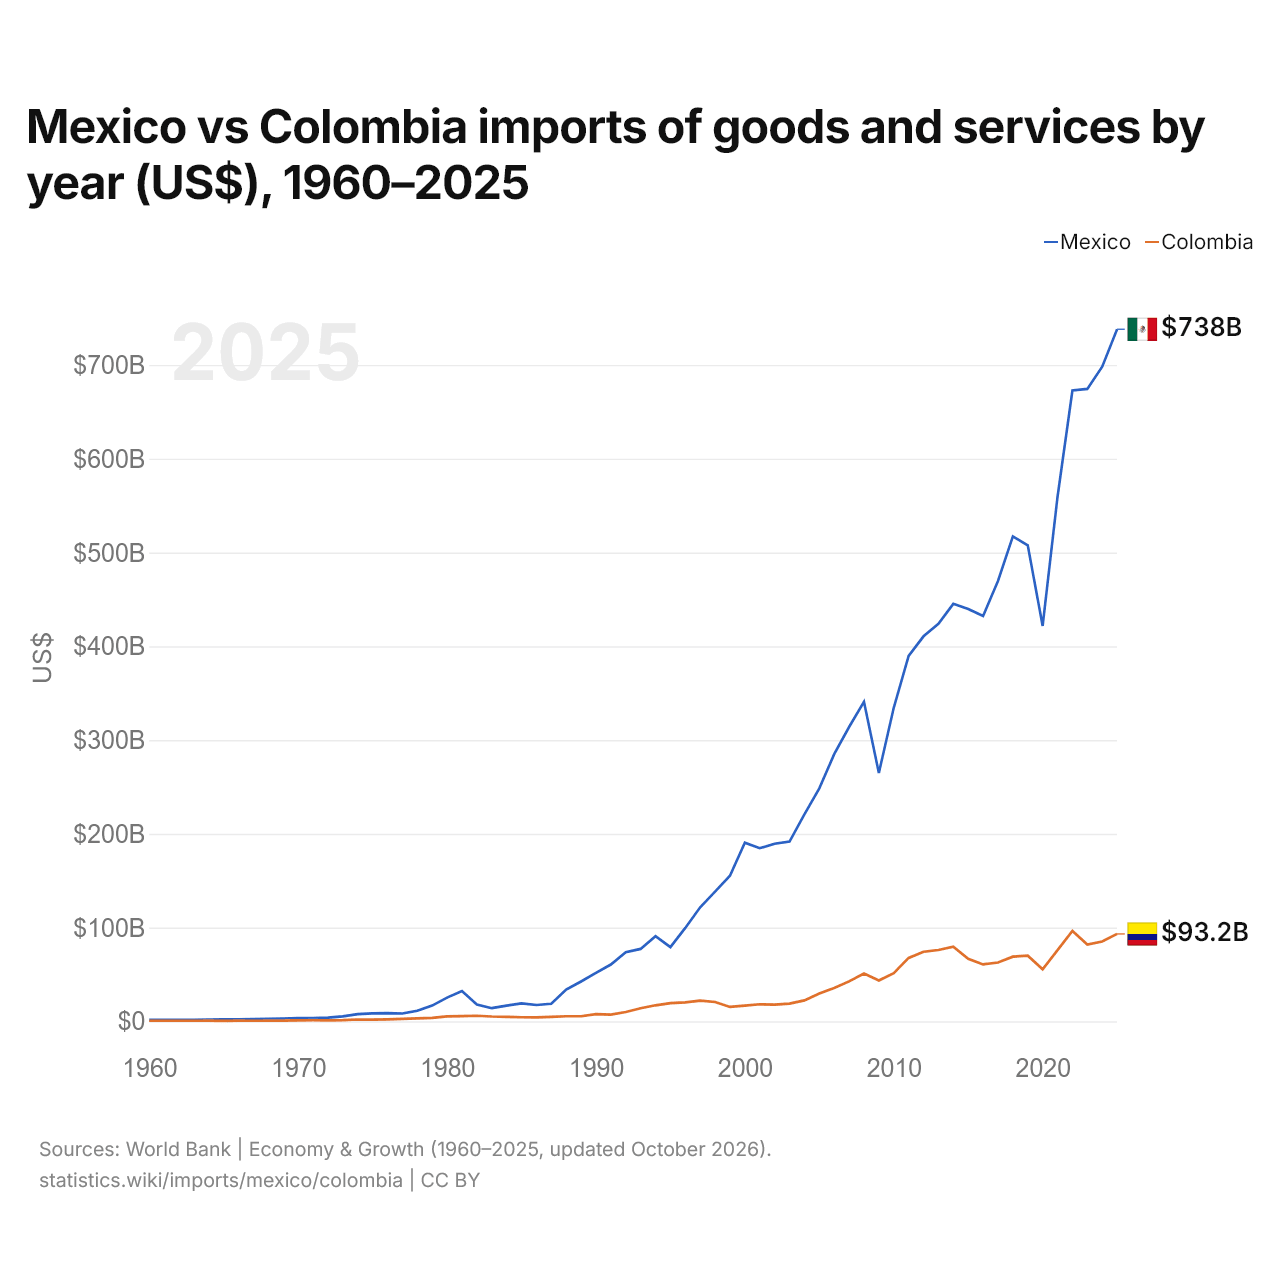
Mexique vs Colombie : importations de biens et services par année ($ US), 1960–2025
| Année | $ US | |
|---|---|---|
 Mexique |
 Colombie |
|
| 2025 | 738 162 519 127 $ US | 93 242 618 943 $ US |
| 2024 | 698 190 455 616 $ US | 85 099 669 252 $ US |
| 2023 | 674 539 332 149 $ US | 81 912 779 953 $ US |
| 2022 | 672 827 146 644 $ US | 96 411 719 931 $ US |
| 2021 | 559 543 398 298 $ US | 76 006 795 312 $ US |
| 2020 | 421 735 413 259 $ US | 55 511 423 807 $ US |
| 2019 | 507 718 819 550 $ US | 70 067 176 051 $ US |
| 2018 | 517 202 845 543 $ US | 68 961 912 989 $ US |
| 2017 | 469 597 181 246 $ US | 62 802 582 424 $ US |
| 2016 | 432 376 614 132 $ US | 60 743 865 897 $ US |
| 2015 | 439 821 695 268 $ US | 66 653 739 136 $ US |
| 2014 | 445 312 781 391 $ US | 79 499 076 760 $ US |
| 2013 | 423 928 383 607 $ US | 76 037 444 586 $ US |
| 2012 | 410 653 072 131 $ US | 74 226 993 322 $ US |
| 2011 | 389 836 031 336 $ US | 67 642 788 202 $ US |
| 2010 | 334 456 322 123 $ US | 51 351 305 097 $ US |
| 2009 | 264 902 814 265 $ US | 43 545 176 395 $ US |
| 2008 | 340 860 425 741 $ US | 51 066 655 641 $ US |
| 2007 | 313 922 896 029 $ US | 42 618 891 608 $ US |
| 2006 | 284 933 176 454 $ US | 35 453 316 065 $ US |
| 2005 | 248 437 817 057 $ US | 29 777 716 182 $ US |
| 2004 | 220 739 895 660 $ US | 22 356 075 160 $ US |
| 2003 | 191 730 637 234 $ US | 18 873 043 327 $ US |
| 2002 | 189 355 937 339 $ US | 17 793 883 920 $ US |
| 2001 | 184 678 218 802 $ US | 18 180 843 172 $ US |
| 2000 | 190 555 678 047 $ US | 16 731 018 377 $ US |
| 1999 | 155 258 243 956 $ US | 15 343 463 758 $ US |
| 1998 | 138 306 850 713 $ US | 20 576 289 396 $ US |
| 1997 | 121 630 321 174 $ US | 22 137 740 206 $ US |
| 1996 | 99 589 465 577 $ US | 20 252 680 332 $ US |
| 1995 | 79 072 391 842 $ US | 19 392 751 884 $ US |
| 1994 | 90 814 853 233 $ US | 17 091 698 826 $ US |
| 1993 | 77 229 254 751 $ US | 13 949 161 891 $ US |
| 1992 | 73 709 242 760 $ US | 9 985 578 591 $ US |
| 1991 | 60 602 372 094 $ US | 7 098 679 409 $ US |
| 1990 | 51 768 004 611 $ US | 7 614 454 665 $ US |
| 1989 | 42 503 750 803 $ US | 5 464 066 789 $ US |
| 1988 | 33 950 898 441 $ US | 5 433 539 691 $ US |
| 1987 | 18 775 902 765 $ US | 4 697 932 910 $ US |
| 1986 | 17 390 079 327 $ US | 4 190 788 878 $ US |
| 1985 | 19 065 246 504 $ US | 4 370 638 535 $ US |
| 1984 | 16 774 715 780 $ US | 4 767 852 803 $ US |
| 1983 | 14 025 463 387 $ US | 5 127 945 979 $ US |
| 1982 | 17 919 648 239 $ US | 5 919 610 897 $ US |
| 1981 | 32 330 287 579 $ US | 5 610 414 541 $ US |
| 1980 | 25 269 530 739 $ US | 5 209 514 725 $ US |
| 1979 | 16 750 506 468 $ US | 3 756 624 824 $ US |
| 1978 | 11 332 164 976 $ US | 3 210 026 858 $ US |
| 1977 | 8 373 206 929 $ US | 2 569 926 742 $ US |
| 1976 | 8 769 603 267 $ US | 2 131 690 445 $ US |
| 1975 | 8 465 680 000 $ US | 1 835 324 549 $ US |
| 1974 | 7 612 160 000 $ US | 1 933 488 606 $ US |
| 1973 | 5 232 144 000 $ US | 1 306 397 078 $ US |
| 1972 | 3 991 120 000 $ US | 1 109 769 650 $ US |
| 1971 | 3 417 960 000 $ US | 1 252 577 345 $ US |
| 1970 | 3 430 408 000 $ US | 1 047 700 632 $ US |
| 1969 | 3 011 216 000 $ US | 839 120 872 $ US |
| 1968 | 2 746 232 000 $ US | 763 579 000 $ US |
| 1967 | 2 392 912 000 $ US | 602 411 300 $ US |
| 1966 | 2 192 168 000 $ US | 778 814 815 $ US |
| 1965 | 2 079 752 000 $ US | 559 333 333 $ US |
| 1964 | 1 978 568 000 $ US | 755 727 700 $ US |
| 1963 | 1 688 128 000 $ US | 597 285 656 $ US |
| 1962 | 1 536 528 000 $ US | 605 929 809 $ US |
| 1961 | 1 503 120 000 $ US | 627 934 716 $ US |
| 1960 | 1 520 944 000 $ US | 594 894 695 $ US |
En 2025, les importations de biens et services du Mexique s'élevaient à 738 milliards de dollars et celles de la Colombie à 93,2 milliards de dollars : celles du Mexique étaient 7,9 fois plus élevées. En 1960, les importations du Mexique étaient 2,6 fois plus élevées : 1,52 milliard de dollars pour le Mexique et 595 millions de dollars pour la Colombie.
Les importations de biens et services du Mexique sont supérieures à celles de la Colombie chaque année depuis 1960.
Mexique vs Colombie : chiffres des importations
|
Mexique
|
Colombie
|
|
|---|---|---|
| Importations | 738 Md $US (2025) | 93,2 Md $US (2025) |
| Rang mondial | 13/174 | 52/174 |
| Part mondiale | 2,19 % | 0,28 % |
| % du PIB | 40,3 % | 20,4 % |
| Première catégorie de biens | Machines, électronique et véhicules (55,3 %, 2025) | Machines, électronique et véhicules (34 %, 2025) |
| Première origine des biens | États-Unis (37,7 %, 2025) | Chine (27,5 %, 2025) |
Comparer les importations de 2 pays au choix
Sources :
- Banque mondiale | Économie et croissance (1960–2025, mis à jour en octobre 2026)
- TradeMap (2001–2025, mis à jour en octobre 2026)
Creative Commons Attribution (CC BY) : vous pouvez copier, partager, adapter et réutiliser ce contenu, y compris à des fins commerciales, à condition de citer statistics.wiki et d’indiquer les modifications apportées. Les sources citées ci-dessus peuvent avoir leurs propres conditions de licence.