
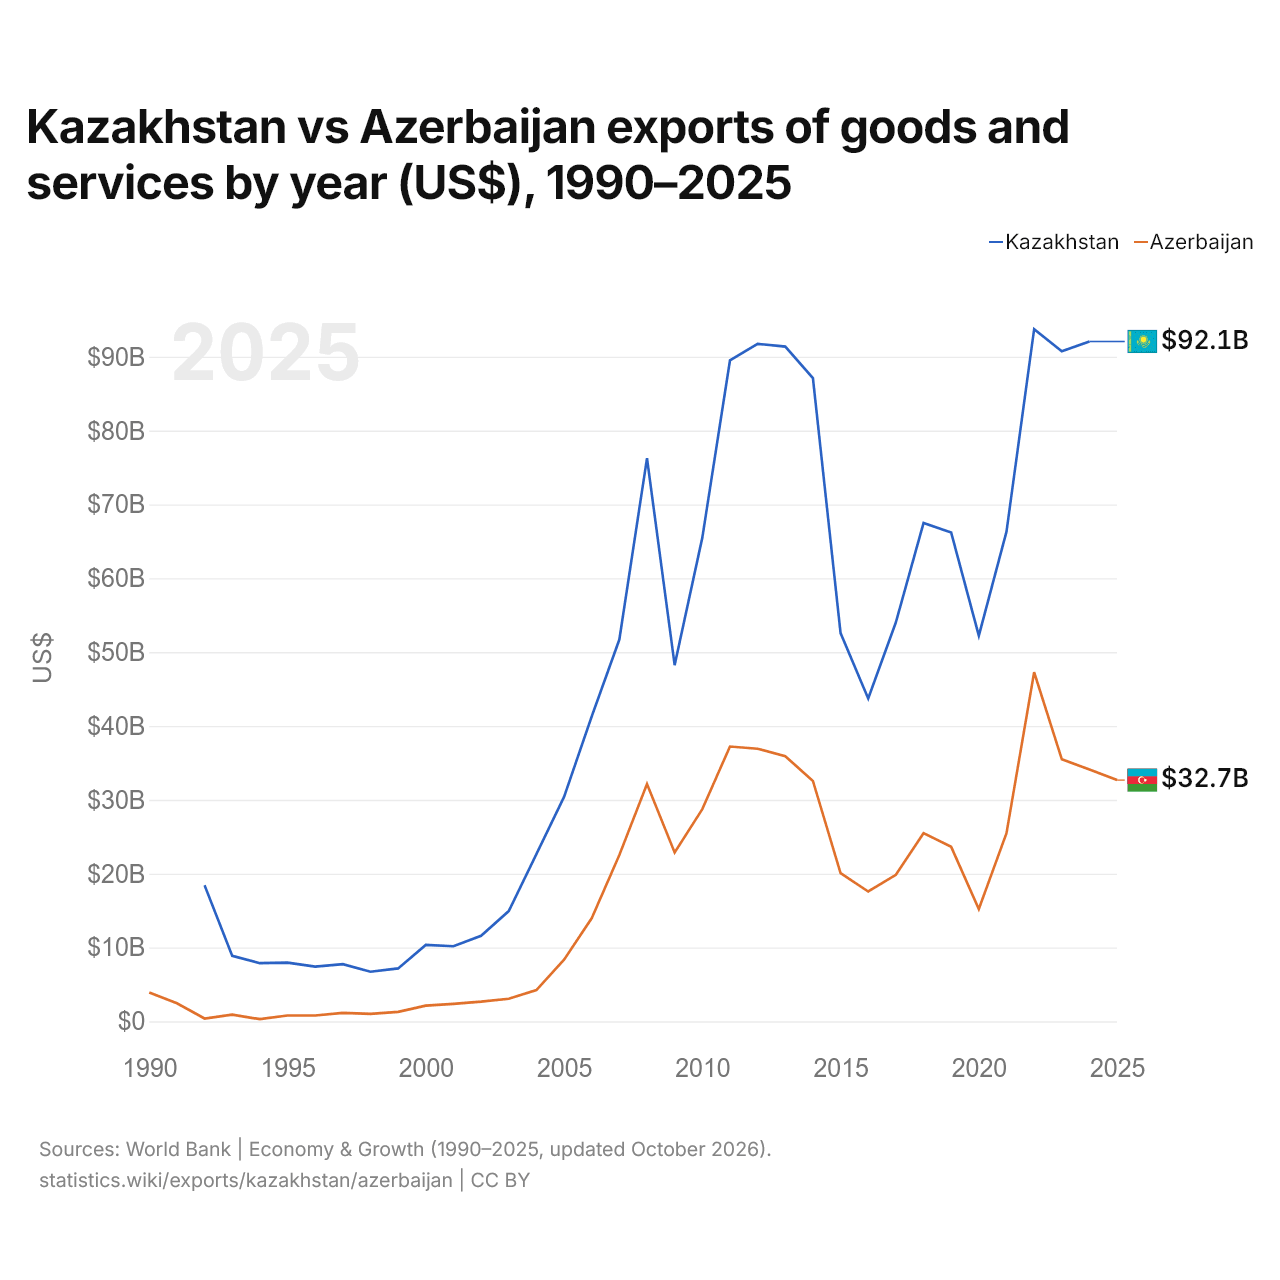
Kazakhstan vs Azerbaïdjan : exportations de biens et services par année ($ US), 1990–2025
| Année | $ US | |
|---|---|---|
 Kazakhstan |
 Azerbaïdjan |
|
| 2025 | - | 32 670 058 824 $ US |
| 2024 | 92 070 351 467 $ US | 34 112 882 353 $ US |
| 2023 | 90 729 107 012 $ US | 35 487 352 941 $ US |
| 2022 | 93 736 589 050 $ US | 47 274 117 647 $ US |
| 2021 | 66 318 146 546 $ US | 25 487 647 059 $ US |
| 2020 | 52 229 576 023 $ US | 15 208 764 706 $ US |
| 2019 | 66 197 682 052 $ US | 23 629 764 706 $ US |
| 2018 | 67 477 058 330 $ US | 25 484 215 746 $ US |
| 2017 | 54 041 327 349 $ US | 19 839 874 968 $ US |
| 2016 | 43 714 755 378 $ US | 17 580 756 548 $ US |
| 2015 | 52 581 502 969 $ US | 20 060 045 053 $ US |
| 2014 | 87 108 795 076 $ US | 32 558 931 187 $ US |
| 2013 | 91 381 274 046 $ US | 35 905 452 997 $ US |
| 2012 | 91 747 467 851 $ US | 36 912 727 759 $ US |
| 2011 | 89 503 237 238 $ US | 37 215 171 600 $ US |
| 2010 | 65 502 334 498 $ US | 28 732 245 203 $ US |
| 2009 | 48 243 335 560 $ US | 22 870 725 059 $ US |
| 2008 | 76 257 078 322 $ US | 32 132 494 340 $ US |
| 2007 | 51 704 450 816 $ US | 22 516 209 779 $ US |
| 2006 | 41 291 961 259 $ US | 13 953 852 783 $ US |
| 2005 | 30 386 570 590 $ US | 8 336 815 027 $ US |
| 2004 | 22 654 791 782 $ US | 4 235 083 892 $ US |
| 2003 | 14 928 755 904 $ US | 3 056 572 037 $ US |
| 2002 | 11 576 895 509 $ US | 2 667 039 718 $ US |
| 2001 | 10 166 980 822 $ US | 2 368 581 267 $ US |
| 2000 | 10 353 710 625 $ US | 2 118 053 577 $ US |
| 1999 | 7 163 702 505 $ US | 1 281 380 721 $ US |
| 1998 | 6 716 763 896 $ US | 1 009 304 730 $ US |
| 1997 | 7 739 646 727 $ US | 1 150 456 356 $ US |
| 1996 | 7 418 919 357 $ US | 791 860 069 $ US |
| 1995 | 7 940 652 378 $ US | 785 309 768 $ US |
| 1994 | 7 876 550 644 $ US | 294 957 729 $ US |
| 1993 | 8 871 031 904 $ US | 902 385 596 $ US |
| 1992 | 18 440 081 612 $ US | 383 311 808 $ US |
| 1991 | - | 2 440 000 000 $ US |
| 1990 | - | 3 896 969 697 $ US |
Les exportations de biens et services du Kazakhstan s'élevaient à 92,1 milliards de dollars (2024) et celles de l'Azerbaïdjan à 34,1 milliards de dollars (2024) : celles du Kazakhstan étaient 2,7 fois plus élevées. En 1992, les exportations du Kazakhstan étaient 48 fois plus élevées : 18,4 milliards de dollars pour le Kazakhstan et 383 millions de dollars pour l'Azerbaïdjan.
Les exportations de biens et services du Kazakhstan sont supérieures à celles de l'Azerbaïdjan chaque année depuis 1992.
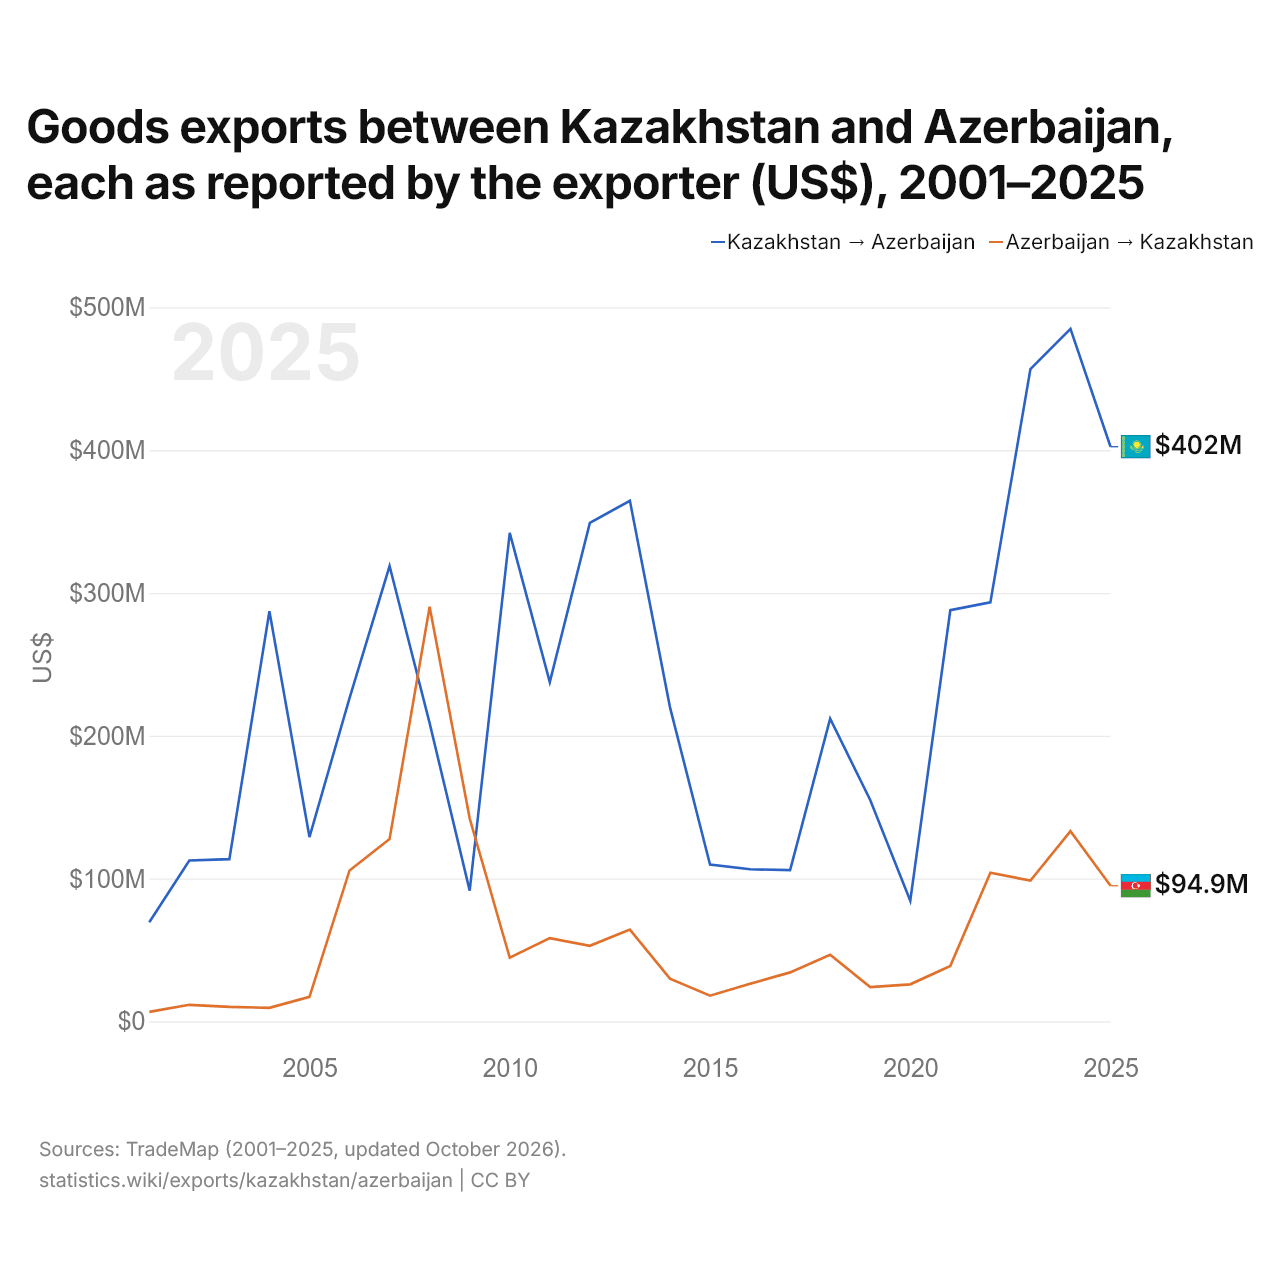
Exportations de biens entre le Kazakhstan et l'Azerbaïdjan, selon chaque exportateur ($ US), 2001–2025
| Année | $ US | |
|---|---|---|
| Kazakhstan → Azerbaïdjan | Azerbaïdjan → Kazakhstan | |
| 2025 | 402 365 000 $ US | 94 945 000 $ US |
| 2024 | 484 913 000 $ US | 133 117 000 $ US |
| 2023 | 456 737 000 $ US | 98 504 000 $ US |
| 2022 | 293 327 000 $ US | 104 023 000 $ US |
| 2021 | 287 885 000 $ US | 38 835 000 $ US |
| 2020 | 84 399 000 $ US | 25 920 000 $ US |
| 2019 | 154 972 000 $ US | 24 023 000 $ US |
| 2018 | 211 904 000 $ US | 46 600 000 $ US |
| 2017 | 105 924 000 $ US | 34 273 000 $ US |
| 2016 | 106 471 000 $ US | 26 274 000 $ US |
| 2015 | 109 801 000 $ US | 17 958 000 $ US |
| 2014 | 220 051 000 $ US | 29 840 000 $ US |
| 2013 | 364 477 000 $ US | 64 234 000 $ US |
| 2012 | 349 079 000 $ US | 52 870 000 $ US |
| 2011 | 237 580 000 $ US | 58 281 000 $ US |
| 2010 | 342 035 000 $ US | 44 591 000 $ US |
| 2009 | 91 514 000 $ US | 142 149 000 $ US |
| 2008 | 208 860 000 $ US | 290 249 000 $ US |
| 2007 | 318 849 000 $ US | 127 594 000 $ US |
| 2006 | 226 386 000 $ US | 105 656 000 $ US |
| 2005 | 129 067 000 $ US | 17 166 000 $ US |
| 2004 | 287 125 000 $ US | 9 418 000 $ US |
| 2003 | 113 548 000 $ US | 10 133 000 $ US |
| 2002 | 112 657 000 $ US | 11 570 000 $ US |
| 2001 | 69 309 000 $ US | 6 617 000 $ US |
En 2025, les exportations de biens du Kazakhstan vers l'Azerbaïdjan, selon le Kazakhstan, s'élevaient à 402 millions de dollars, et celles de l'Azerbaïdjan vers le Kazakhstan, selon l'Azerbaïdjan, à 94,9 millions de dollars : 4,2 fois plus pour celles du Kazakhstan. En 2001, elles s'élevaient à 69,3 millions de dollars pour le Kazakhstan et à 6,62 millions de dollars pour l'Azerbaïdjan.
Kazakhstan vs Azerbaïdjan : chiffres des exportations
|
Kazakhstan
|
Azerbaïdjan
|
|
|---|---|---|
| Exportations | 92,1 Md $US (2024) | 32,7 Md $US (2025) |
| Rang mondial | 51/176 | 78/176 |
| Part mondiale | 0,28 % | 0,09 % |
| % du PIB | 31,6 % | 43,0 % |
| Première catégorie de biens | Pétrole, gaz, minerais et autres matières premières (68,6 %, 2025) | Pétrole, gaz, minerais et autres matières premières (87,3 %, 2025) |
| Première destination des biens | Italie (19,7 %, 2025) | Italie (45,3 %, 2025) |
Comparer les exportations de 2 pays au choix
Sources :
- Banque mondiale | Économie et croissance (1990–2025, mis à jour en octobre 2026)
- TradeMap (2001–2025, mis à jour en octobre 2026)
Creative Commons Attribution (CC BY) : vous pouvez copier, partager, adapter et réutiliser ce contenu, y compris à des fins commerciales, à condition de citer statistics.wiki et d’indiquer les modifications apportées. Les sources citées ci-dessus peuvent avoir leurs propres conditions de licence.