
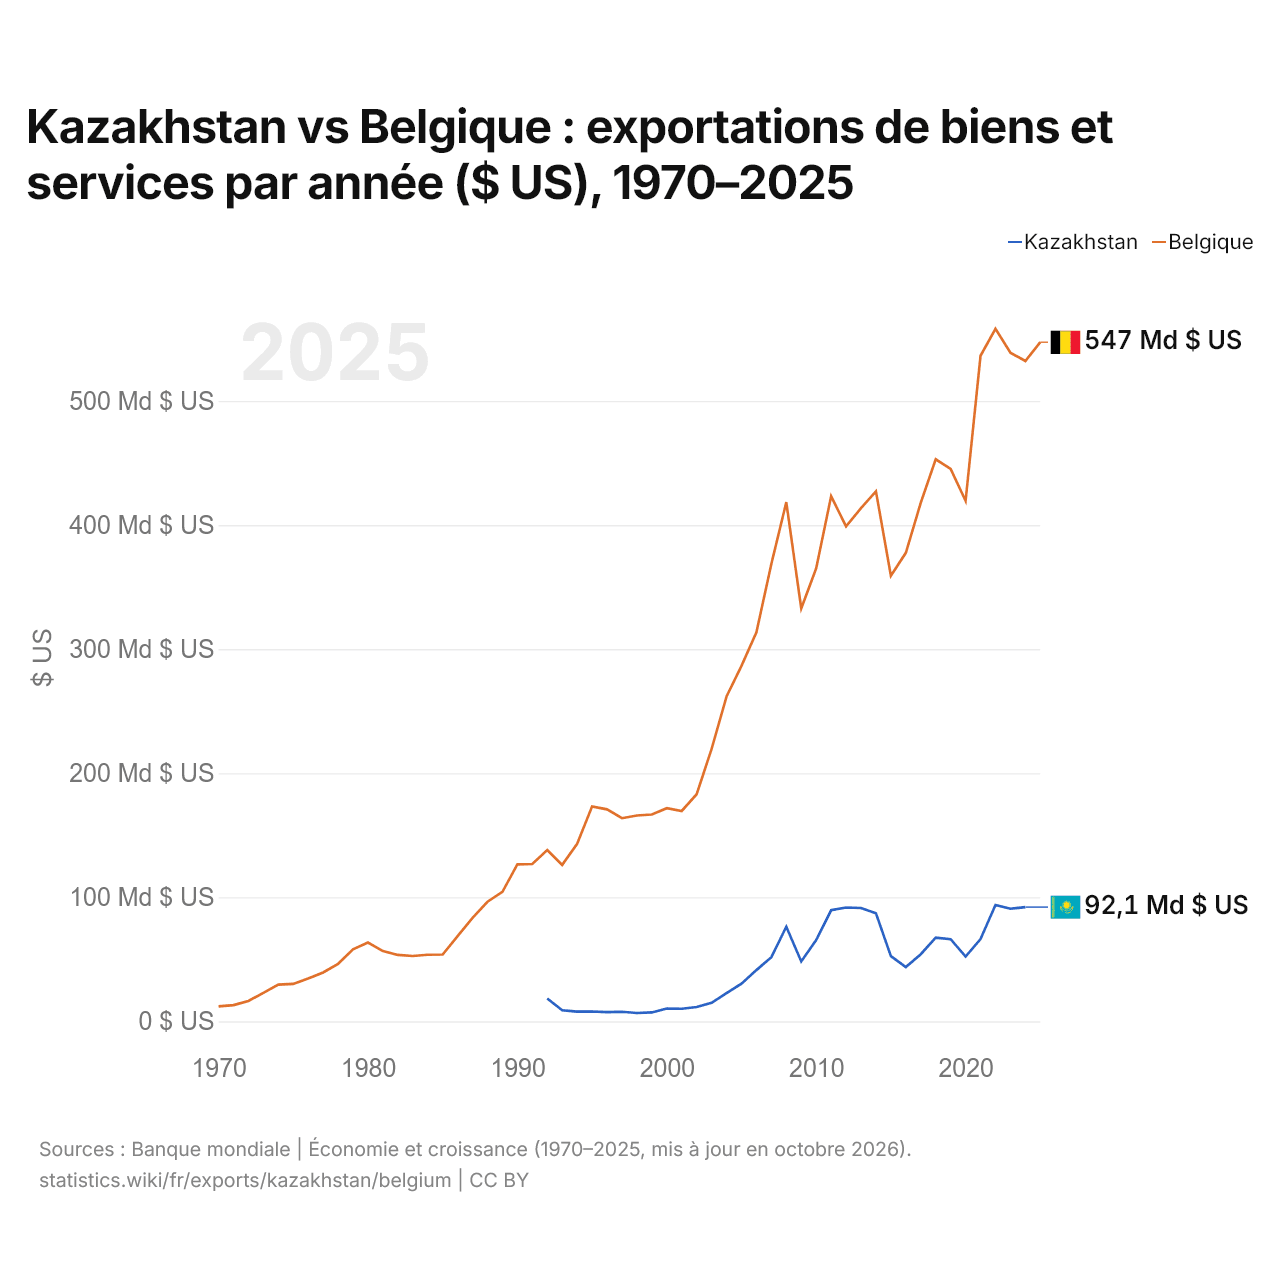
Kazakhstan vs Belgique : exportations de biens et services par année ($ US), 1970–2025
| Année | $ US | |
|---|---|---|
 Kazakhstan |
 Belgique |
|
| 2025 | - | 547 364 961 669 $ US |
| 2024 | 92 070 351 467 $ US | 532 215 676 718 $ US |
| 2023 | 90 729 107 012 $ US | 538 931 856 272 $ US |
| 2022 | 93 736 589 050 $ US | 558 111 250 101 $ US |
| 2021 | 66 318 146 546 $ US | 536 427 964 593 $ US |
| 2020 | 52 229 576 023 $ US | 419 501 446 550 $ US |
| 2019 | 66 197 682 052 $ US | 445 308 040 881 $ US |
| 2018 | 67 477 058 330 $ US | 453 011 551 861 $ US |
| 2017 | 54 041 327 349 $ US | 417 980 340 772 $ US |
| 2016 | 43 714 755 378 $ US | 377 606 160 657 $ US |
| 2015 | 52 581 502 969 $ US | 359 051 241 756 $ US |
| 2014 | 87 108 795 076 $ US | 427 143 291 975 $ US |
| 2013 | 91 381 274 046 $ US | 413 572 371 493 $ US |
| 2012 | 91 747 467 851 $ US | 398 975 576 108 $ US |
| 2011 | 89 503 237 238 $ US | 423 187 943 009 $ US |
| 2010 | 65 502 334 498 $ US | 365 156 061 525 $ US |
| 2009 | 48 243 335 560 $ US | 332 700 938 046 $ US |
| 2008 | 76 257 078 322 $ US | 418 418 164 816 $ US |
| 2007 | 51 704 450 816 $ US | 368 740 547 136 $ US |
| 2006 | 41 291 961 259 $ US | 313 563 958 757 $ US |
| 2005 | 30 386 570 590 $ US | 286 519 836 952 $ US |
| 2004 | 22 654 791 782 $ US | 261 796 408 381 $ US |
| 2003 | 14 928 755 904 $ US | 219 593 071 858 $ US |
| 2002 | 11 576 895 509 $ US | 183 016 456 470 $ US |
| 2001 | 10 166 980 822 $ US | 169 538 549 671 $ US |
| 2000 | 10 353 710 625 $ US | 171 786 761 887 $ US |
| 1999 | 7 163 702 505 $ US | 166 731 346 438 $ US |
| 1998 | 6 716 763 896 $ US | 165 908 868 637 $ US |
| 1997 | 7 739 646 727 $ US | 163 720 906 631 $ US |
| 1996 | 7 418 919 357 $ US | 170 850 032 573 $ US |
| 1995 | 7 940 652 378 $ US | 173 144 772 852 $ US |
| 1994 | 7 876 550 644 $ US | 143 073 453 099 $ US |
| 1993 | 8 871 031 904 $ US | 126 086 323 461 $ US |
| 1992 | 18 440 081 612 $ US | 138 072 578 419 $ US |
| 1991 | - | 126 790 048 435 $ US |
| 1990 | - | 126 512 468 614 $ US |
| 1989 | - | 104 389 986 691 $ US |
| 1988 | - | 96 418 786 615 $ US |
| 1987 | - | 83 463 311 723 $ US |
| 1986 | - | 68 750 421 709 $ US |
| 1985 | - | 53 878 264 148 $ US |
| 1984 | - | 53 687 392 488 $ US |
| 1983 | - | 52 655 467 456 $ US |
| 1982 | - | 53 510 783 154 $ US |
| 1981 | - | 56 620 736 636 $ US |
| 1980 | - | 63 563 403 228 $ US |
| 1979 | - | 58 067 512 383 $ US |
| 1978 | - | 46 332 075 061 $ US |
| 1977 | - | 39 354 961 171 $ US |
| 1976 | - | 34 528 907 001 $ US |
| 1975 | - | 30 156 821 323 $ US |
| 1974 | - | 29 637 776 512 $ US |
| 1973 | - | 22 932 275 926 $ US |
| 1972 | - | 16 423 224 269 $ US |
| 1971 | - | 13 052 184 853 $ US |
| 1970 | - | 12 006 111 335 $ US |
Les exportations de biens et services du Kazakhstan s'élevaient à 92,1 milliards de dollars (2024) et celles de la Belgique à 532 milliards de dollars (2024) : celles de la Belgique étaient 5,8 fois plus élevées. En 1992, les exportations de la Belgique étaient 7,5 fois plus élevées : 18,4 milliards de dollars pour le Kazakhstan et 138 milliards de dollars pour la Belgique.
Les exportations de biens et services de la Belgique sont supérieures à celles du Kazakhstan chaque année depuis 1992.
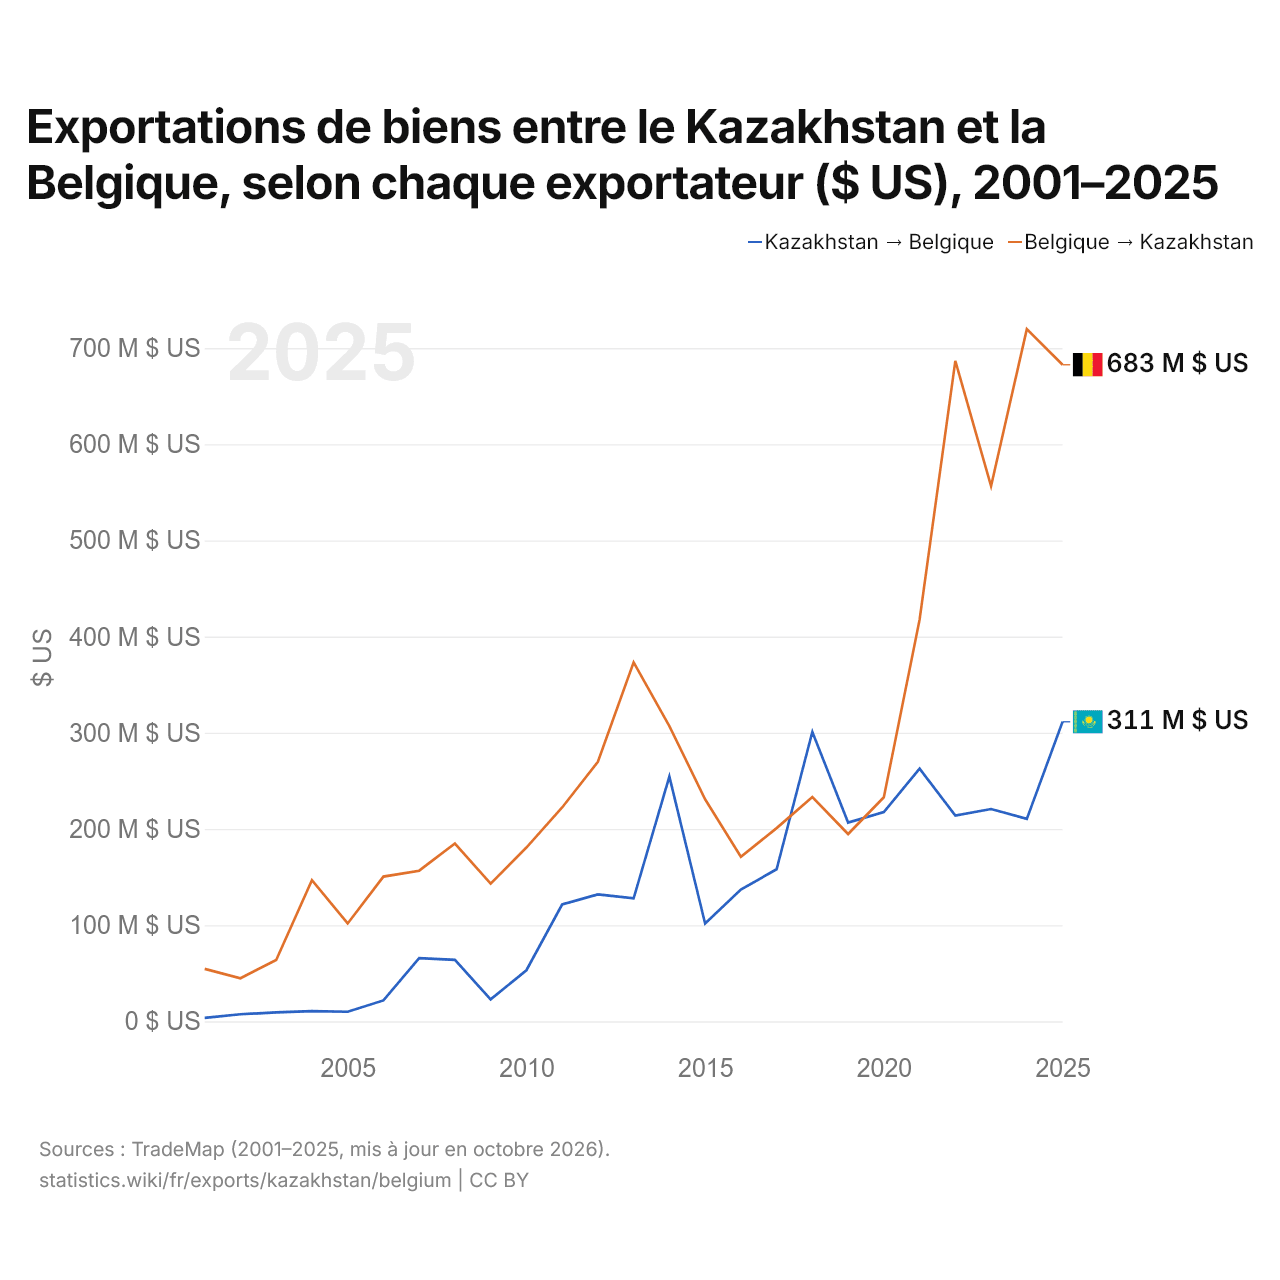
Exportations de biens entre le Kazakhstan et la Belgique, selon chaque exportateur ($ US), 2001–2025
| Année | $ US | |
|---|---|---|
| Kazakhstan → Belgique | Belgique → Kazakhstan | |
| 2025 | 311 391 000 $ US | 682 642 000 $ US |
| 2024 | 210 491 000 $ US | 719 696 000 $ US |
| 2023 | 220 719 000 $ US | 556 456 000 $ US |
| 2022 | 213 917 000 $ US | 686 687 000 $ US |
| 2021 | 262 807 000 $ US | 417 533 000 $ US |
| 2020 | 217 550 000 $ US | 232 925 000 $ US |
| 2019 | 206 695 000 $ US | 194 719 000 $ US |
| 2018 | 300 929 000 $ US | 233 286 000 $ US |
| 2017 | 158 108 000 $ US | 200 879 000 $ US |
| 2016 | 136 938 000 $ US | 171 078 000 $ US |
| 2015 | 101 634 000 $ US | 230 895 000 $ US |
| 2014 | 254 490 000 $ US | 307 006 000 $ US |
| 2013 | 127 840 000 $ US | 373 253 000 $ US |
| 2012 | 132 009 000 $ US | 269 818 000 $ US |
| 2011 | 121 503 000 $ US | 222 343 000 $ US |
| 2010 | 53 118 000 $ US | 180 669 000 $ US |
| 2009 | 22 790 000 $ US | 143 081 000 $ US |
| 2008 | 63 919 000 $ US | 184 869 000 $ US |
| 2007 | 65 608 000 $ US | 156 610 000 $ US |
| 2006 | 21 759 000 $ US | 150 466 000 $ US |
| 2005 | 9 927 000 $ US | 101 742 000 $ US |
| 2004 | 10 698 000 $ US | 146 868 000 $ US |
| 2003 | 9 237 000 $ US | 63 783 000 $ US |
| 2002 | 7 384 000 $ US | 44 773 000 $ US |
| 2001 | 3 627 000 $ US | 54 551 000 $ US |
En 2025, les exportations de biens du Kazakhstan vers la Belgique, selon le Kazakhstan, s'élevaient à 311 millions de dollars, et celles de la Belgique vers le Kazakhstan, selon la Belgique, à 683 millions de dollars : 2,2 fois plus pour celles de la Belgique. En 2001, elles s'élevaient à 3,63 millions de dollars pour le Kazakhstan et à 54,6 millions de dollars pour la Belgique.
Kazakhstan vs Belgique : chiffres des exportations
|
Kazakhstan
|
Belgique
|
|
|---|---|---|
| Exportations | 92,1 Md $US (2024) | 547 Md $US (2025) |
| Rang mondial | 51/176 | 19/176 |
| Part mondiale | 0,28 % | 1,57 % |
| % du PIB | 31,6 % | 75,5 % |
| Première catégorie de biens | Pétrole, gaz, minerais et autres matières premières (68,6 %, 2025) | Produits chimiques, pharmaceutiques et plastiques (29,8 %, 2025) |
| Première destination des biens | Italie (19,7 %, 2025) | Allemagne (19 %, 2025) |
Comparer les exportations de 2 pays au choix
Sources :
- Banque mondiale | Économie et croissance (1970–2025, mis à jour en octobre 2026)
- TradeMap (2001–2025, mis à jour en octobre 2026)
Creative Commons Attribution (CC BY) : vous pouvez copier, partager, adapter et réutiliser ce contenu, y compris à des fins commerciales, à condition de citer statistics.wiki et d’indiquer les modifications apportées. Les sources citées ci-dessus peuvent avoir leurs propres conditions de licence.