
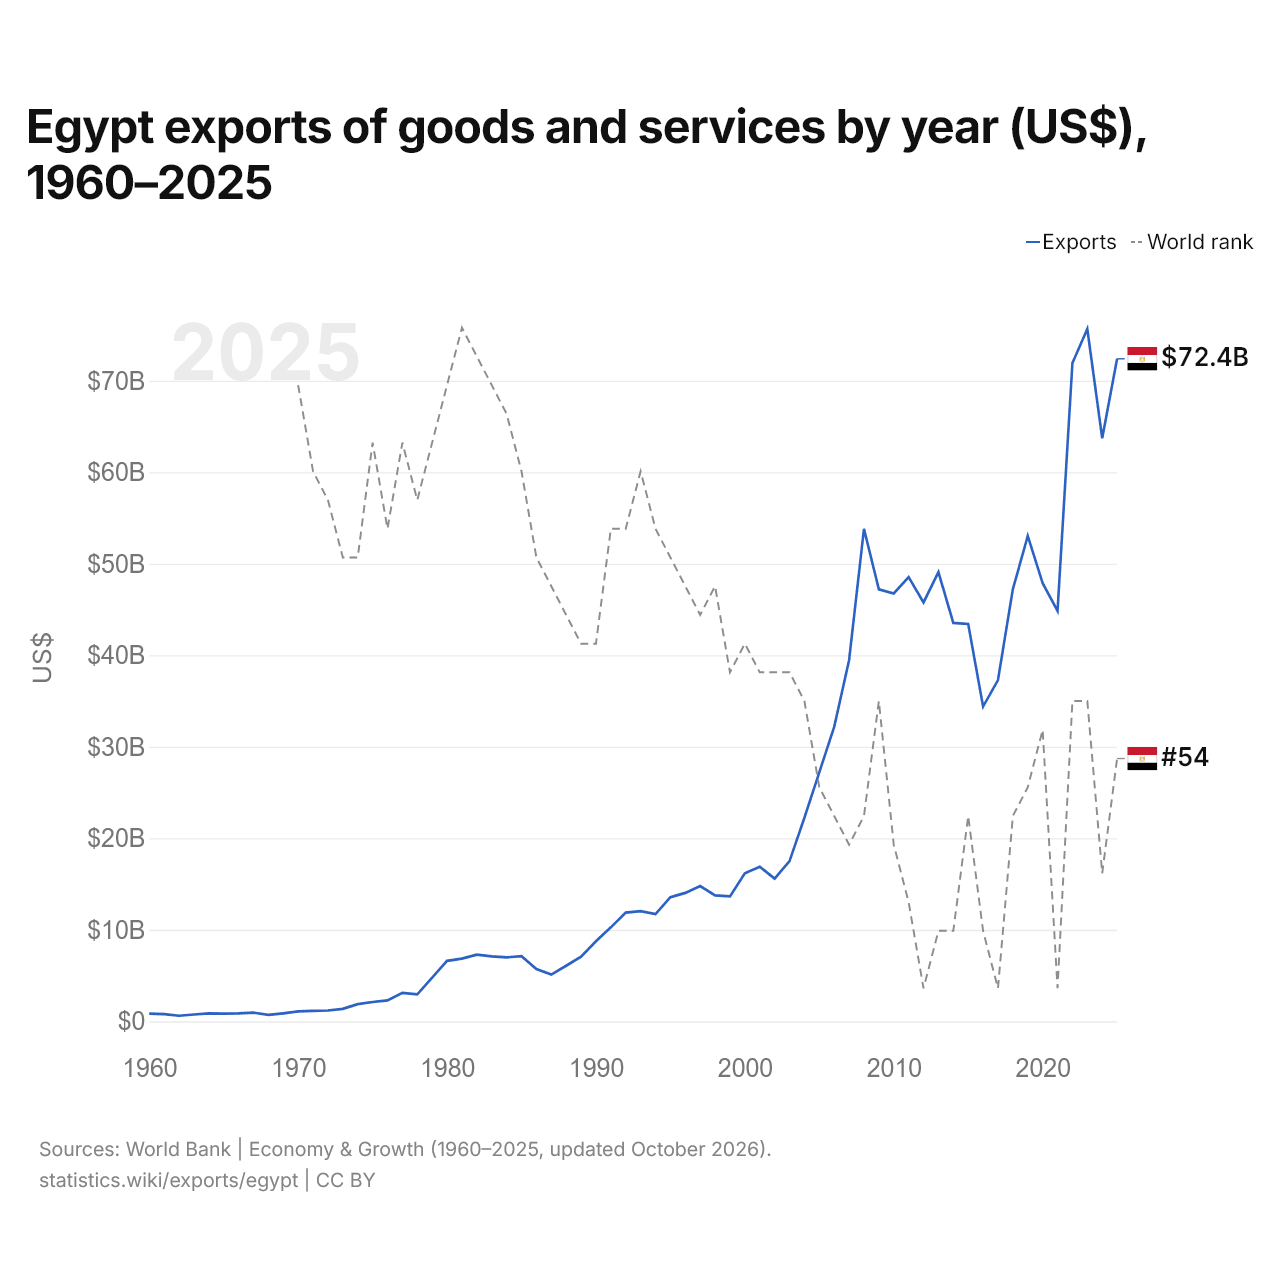
Egypt exports of goods and services by year (US$), 1960–2025
| Year | US$ | World rank |
|---|---|---|
| Exports | World rank | |
| 2025 | $72,393,571,622 | #54 |
| 2024 | $63,713,393,301 | #58 |
| 2023 | $75,645,996,852 | #52 |
| 2022 | $71,927,051,672 | #52 |
| 2021 | $44,850,223,072 | #62 |
| 2020 | $47,872,738,615 | #53 |
| 2019 | $53,041,002,278 | #55 |
| 2018 | $47,225,661,227 | #56 |
| 2017 | $37,289,402,174 | #62 |
| 2016 | $34,392,638,037 | #60 |
| 2015 | $43,423,180,593 | #56 |
| 2014 | $43,529,411,765 | #60 |
| 2013 | $49,085,271,318 | #60 |
| 2012 | $45,766,666,667 | #62 |
| 2011 | $48,537,005,164 | #59 |
| 2010 | $46,751,361,162 | #57 |
| 2009 | $47,205,081,670 | #52 |
| 2008 | $53,800,000,000 | #56 |
| 2007 | $39,457,092,820 | #57 |
| 2006 | $32,173,913,043 | #56 |
| 2005 | $27,206,127,206 | #55 |
| 2004 | $22,240,259,740 | #52 |
| 2003 | $17,500,000,000 | #51 |
| 2002 | $15,595,505,618 | #51 |
| 2001 | $16,900,269,542 | #51 |
| 2000 | $16,174,959,636 | #50 |
| 1999 | $13,653,789,443 | #51 |
| 1998 | $13,754,427,391 | #48 |
| 1997 | $14,778,761,062 | #49 |
| 1996 | $14,033,018,868 | #48 |
| 1995 | $13,565,319,965 | #47 |
| 1994 | $11,714,116,251 | #46 |
| 1993 | $12,034,813,926 | #44 |
| 1992 | $11,885,776,186 | #46 |
| 1991 | $10,269,192,423 | #46 |
| 1990 | $8,748,317,631 | #50 |
| 1989 | $7,073,523,337 | #50 |
| 1988 | $6,076,093,129 | #49 |
| 1987 | $5,106,048,704 | #48 |
| 1986 | $5,706,267,540 | #47 |
| 1985 | $7,119,673,333 | #44 |
| 1984 | $6,987,744,571 | #42 |
| 1983 | $7,101,280,559 | #41 |
| 1982 | $7,282,512,315 | #40 |
| 1981 | $6,853,648,649 | #39 |
| 1980 | $6,612,494,097 | #41 |
| 1979 | $4,774,142,857 | #43 |
| 1978 | $2,947,998,787 | #45 |
| 1977 | $3,108,577,443 | #43 |
| 1976 | $2,285,998,014 | #46 |
| 1975 | $2,113,327,488 | #43 |
| 1974 | $1,879,700,810 | #47 |
| 1973 | $1,366,851,945 | #47 |
| 1972 | $1,182,006,205 | #45 |
| 1971 | $1,140,015,302 | #44 |
| 1970 | $1,091,183,120 | #41 |
| 1969 | $877,723,971 | - |
| 1968 | $700,000,000 | - |
| 1967 | $943,166,740 | - |
| 1966 | $862,076,408 | - |
| 1965 | $847,750,109 | - |
| 1964 | $866,409,220 | - |
| 1963 | $743,589,331 | - |
| 1962 | $607,433,082 | - |
| 1961 | $793,126,619 | - |
| 1960 | $835,625,800 | - |
In 2025, Egypt's exports of goods and services were $72.4 billion, up from $836 million in 1960. They were highest in 2023, at $75.6 billion. They were the 54th largest in the world, up from 58th in 2024. Their highest rank was 39th, last held in 1981.
In 2025, Egypt's exports of goods and services were the 3rd largest of 50 countries in Africa, after South Africa's and Morocco's. Egypt's imports of goods and services were $115 billion in 2025, the 46th largest in the world. In 2025, Egypt's imports exceeded its exports by $42.7 billion, a trade deficit.
What Egypt exports: goods exports by category, 2025
Goods exports, 2025: $51.4B
In 2025, the largest category of Egypt's goods exports was oil, gas, ores & other raw materials, with 19.8%, followed by precious metals, gems, jewellery, watches, musical instruments & art, with 14.8%.
Where Egypt exports goods to: top 10 destinations, 2025
| Rank | Country | Goods exports | Share | |
|---|---|---|---|---|
| 1 |
 UAE |
$7.03B | 13.7% | vs UAE |
| 2 |
 Italy |
$4.04B | 7.87% | vs Italy |
| 3 |
 Turkey |
$3.30B | 6.41% | vs Turkey |
| 4 |
 Saudi Arabia |
$2.98B | 5.8% | vs Saudi Arabia |
| 5 |
 United States |
$2.71B | 5.27% | vs US |
| 6 |
 Switzerland |
$1.76B | 3.42% | |
| 7 |
 United Kingdom |
$1.60B | 3.11% | vs UK |
| 8 |
 Libya |
$1.49B | 2.91% | vs Libya |
| 9 |
 Spain |
$1.42B | 2.75% | vs Spain |
| 10 |
 Germany |
$1.25B | 2.43% | vs Germany |
| Other partners and not specified | $23.8B | 46.3% |
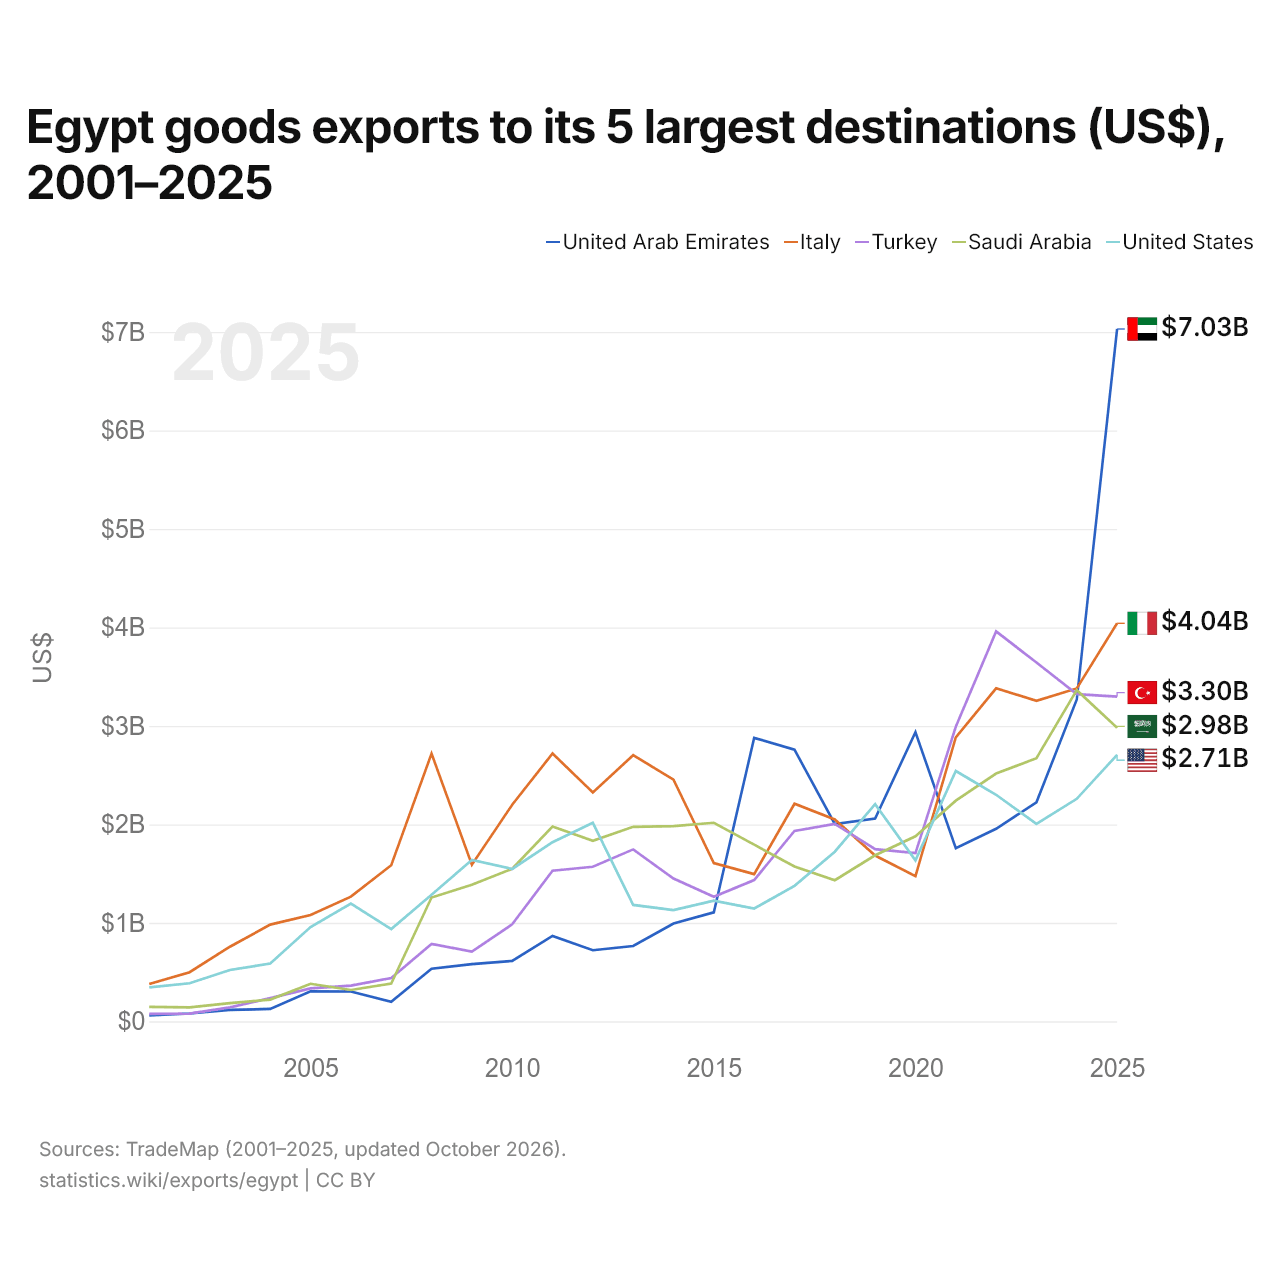
Egypt goods exports to its 5 largest destinations (US$), 2001–2025
| Year | US$ | ||||
|---|---|---|---|---|---|
| United Arab Emirates | Italy | Turkey | Saudi Arabia | United States | |
| 2025 | $7,030,541,000 | $4,042,095,000 | $3,296,690,000 | $2,981,209,000 | $2,706,227,000 |
| 2024 | $3,267,831,000 | $3,380,330,000 | $3,322,335,000 | $3,363,183,000 | $2,259,580,000 |
| 2023 | $2,223,717,000 | $3,254,920,000 | $3,643,856,000 | $2,671,807,000 | $2,004,738,000 |
| 2022 | $1,955,242,000 | $3,382,272,000 | $3,959,942,000 | $2,515,921,000 | $2,300,715,000 |
| 2021 | $1,759,192,000 | $2,884,392,000 | $2,990,617,000 | $2,241,117,000 | $2,542,221,000 |
| 2020 | $2,936,198,000 | $1,474,435,000 | $1,707,900,000 | $1,879,584,000 | $1,634,601,000 |
| 2019 | $2,059,984,000 | $1,683,577,000 | $1,748,647,000 | $1,686,442,000 | $2,205,957,000 |
| 2018 | $2,003,913,000 | $2,050,260,000 | $2,005,554,000 | $1,433,387,000 | $1,722,549,000 |
| 2017 | $2,758,957,000 | $2,209,526,000 | $1,932,876,000 | $1,572,721,000 | $1,375,707,000 |
| 2016 | $2,878,682,000 | $1,494,627,000 | $1,434,547,000 | $1,794,301,000 | $1,145,506,000 |
| 2015 | $1,106,141,000 | $1,607,135,000 | $1,265,336,000 | $2,016,459,000 | $1,225,714,000 |
| 2014 | $993,764,000 | $2,454,462,000 | $1,450,638,000 | $1,981,655,000 | $1,129,121,000 |
| 2013 | $764,912,000 | $2,702,821,000 | $1,746,077,000 | $1,975,234,000 | $1,182,407,000 |
| 2012 | $721,677,000 | $2,324,482,000 | $1,570,177,000 | $1,832,800,000 | $2,015,468,000 |
| 2011 | $867,002,000 | $2,719,707,000 | $1,528,780,000 | $1,977,694,000 | $1,819,386,000 |
| 2010 | $613,359,000 | $2,199,155,000 | $985,260,000 | $1,548,992,000 | $1,547,139,000 |
| 2009 | $581,512,000 | $1,590,892,000 | $707,853,000 | $1,386,987,000 | $1,639,519,000 |
| 2008 | $534,052,000 | $2,718,715,000 | $785,036,000 | $1,257,323,000 | $1,286,219,000 |
| 2007 | $198,362,000 | $1,584,879,000 | $440,512,000 | $383,708,000 | $936,283,000 |
| 2006 | $302,945,000 | $1,266,342,000 | $362,742,000 | $318,312,000 | $1,195,306,000 |
| 2005 | $305,755,000 | $1,079,869,000 | $334,337,000 | $381,177,000 | $957,292,000 |
| 2004 | $125,694,000 | $982,141,000 | $235,234,000 | $221,003,000 | $587,714,000 |
| 2003 | $116,015,000 | $757,750,000 | $142,333,000 | $185,074,000 | $520,884,000 |
| 2002 | $79,724,000 | $498,707,000 | $77,847,000 | $142,317,000 | $386,797,000 |
| 2001 | $59,048,000 | $378,555,000 | $76,527,000 | $146,882,000 | $344,585,000 |
In 2025, goods exports were $7.03 billion to the United Arab Emirates, $4.04 billion to Italy, $3.3 billion to Turkey, $2.98 billion to Saudi Arabia and $2.71 billion to the United States. The most recent change in the order of Egypt's destinations came in 2025, when the United Arab Emirates passed Italy.
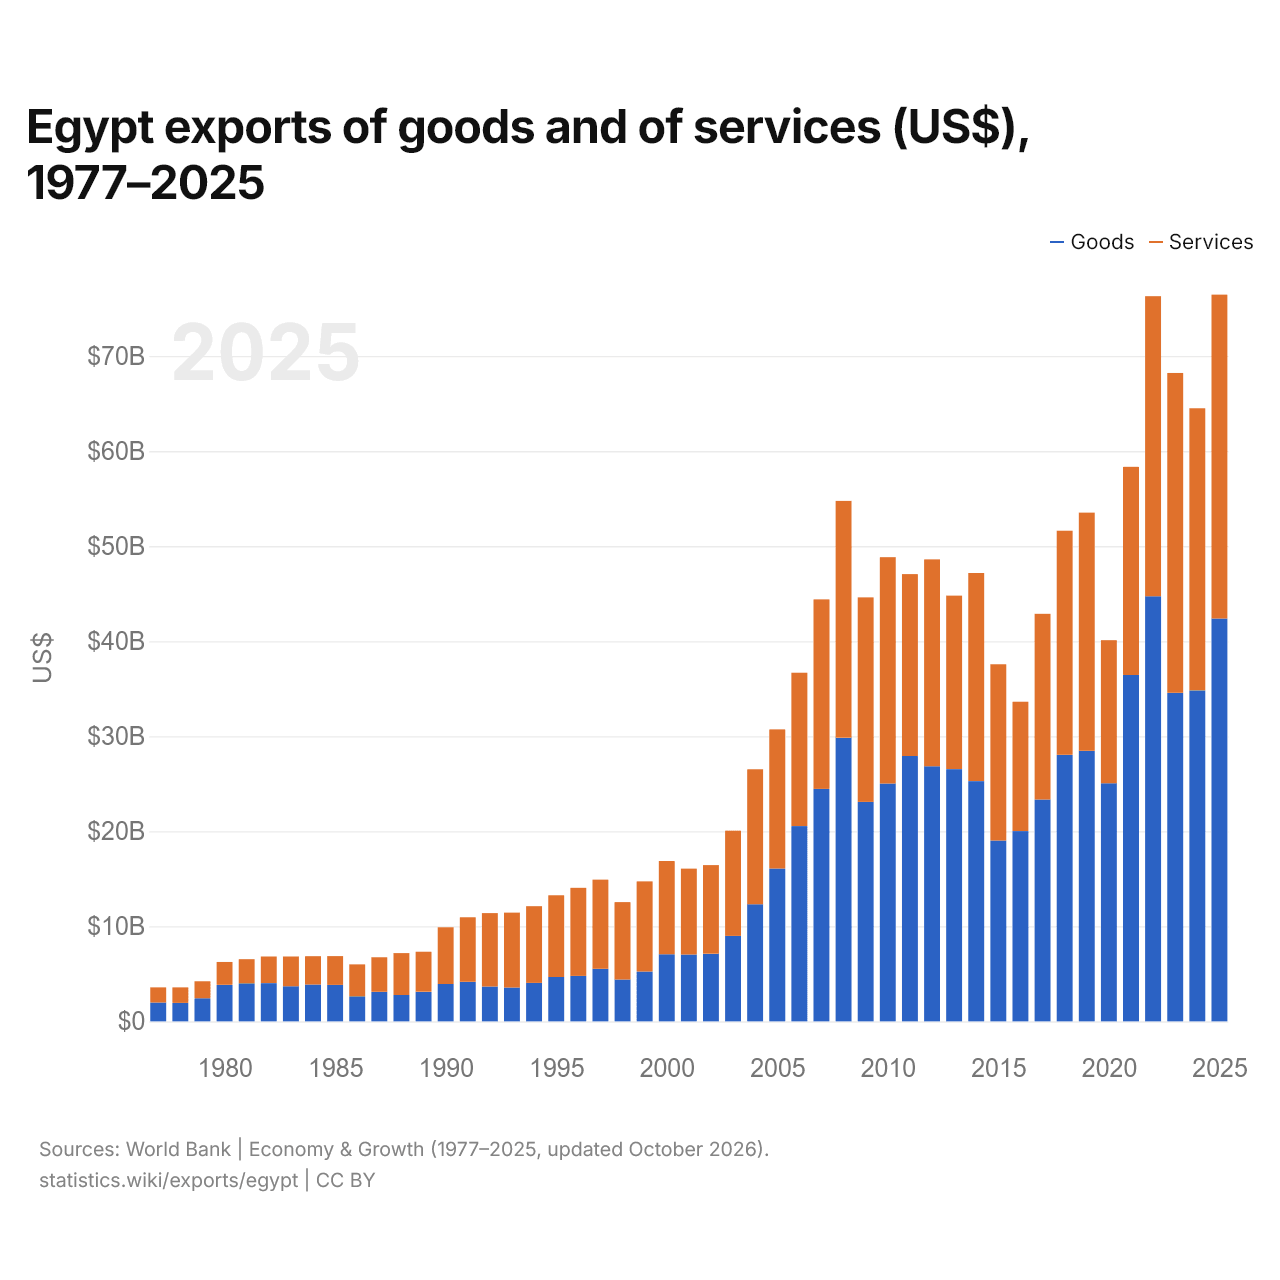
Egypt exports of goods and of services (US$), 1977–2025
| Year | US$ | |
|---|---|---|
| Goods | Services | |
| 2025 | $42,387,700,000 | $34,068,400,000 |
| 2024 | $34,822,700,000 | $29,684,800,000 |
| 2023 | $34,568,500,000 | $33,649,000,000 |
| 2022 | $44,721,800,000 | $31,573,639,000 |
| 2021 | $36,442,176,000 | $21,897,142,000 |
| 2020 | $25,049,007,000 | $15,052,700,000 |
| 2019 | $28,472,107,000 | $25,050,500,000 |
| 2018 | $28,045,807,000 | $23,573,700,000 |
| 2017 | $23,339,400,000 | $19,535,300,000 |
| 2016 | $20,018,300,000 | $13,606,000,000 |
| 2015 | $19,030,900,000 | $18,538,500,000 |
| 2014 | $25,268,700,000 | $21,897,600,000 |
| 2013 | $26,533,700,000 | $18,261,500,000 |
| 2012 | $26,834,500,000 | $21,766,800,000 |
| 2011 | $27,913,400,000 | $19,139,600,000 |
| 2010 | $25,024,200,000 | $23,807,000,000 |
| 2009 | $23,089,300,000 | $21,519,800,000 |
| 2008 | $29,849,000,000 | $24,911,900,000 |
| 2007 | $24,454,600,000 | $19,943,400,000 |
| 2006 | $20,545,600,000 | $16,134,500,000 |
| 2005 | $16,073,200,000 | $14,642,600,000 |
| 2004 | $12,319,600,000 | $14,196,600,000 |
| 2003 | $8,987,300,000 | $11,073,000,000 |
| 2002 | $7,117,700,000 | $9,320,200,000 |
| 2001 | $7,024,900,000 | $9,042,300,000 |
| 2000 | $7,061,000,000 | $9,803,000,000 |
| 1999 | $5,236,500,000 | $9,493,700,000 |
| 1998 | $4,403,000,000 | $8,141,000,000 |
| 1997 | $5,525,300,000 | $9,379,900,000 |
| 1996 | $4,779,000,000 | $9,271,000,000 |
| 1995 | $4,670,000,000 | $8,590,000,000 |
| 1994 | $4,044,000,000 | $8,070,000,000 |
| 1993 | $3,545,000,000 | $7,895,000,000 |
| 1992 | $3,670,000,000 | $7,716,000,000 |
| 1991 | $4,164,000,000 | $6,783,000,000 |
| 1990 | $3,924,000,000 | $5,971,000,000 |
| 1989 | $3,118,818,182 | $4,202,909,091 |
| 1988 | $2,769,714,286 | $4,407,571,429 |
| 1987 | $3,115,142,857 | $3,626,857,143 |
| 1986 | $2,632,285,714 | $3,358,000,000 |
| 1985 | $3,835,571,429 | $3,023,571,429 |
| 1984 | $3,864,142,859 | $2,989,714,287 |
| 1983 | $3,693,000,005 | $3,133,000,004 |
| 1982 | $4,018,000,006 | $2,800,142,861 |
| 1981 | $3,998,714,291 | $2,537,000,004 |
| 1980 | $3,853,571,434 | $2,392,714,289 |
| 1979 | $2,424,000,003 | $1,787,857,145 |
| 1978 | $1,938,896,773 | $1,633,252,838 |
| 1977 | $1,973,907,826 | $1,600,797,336 |
In 2025, Egypt's exports of goods were $42.4 billion and of services $34.1 billion; services made up 44.6% of the total, compared with 44.8% in 1977.
Egypt in the world ranking of exports, 2025
| Rank | Country | Exports | Share of world | |
|---|---|---|---|---|
| 51 |
 Kazakhstan |
$92.1B (2024) | 0.28% | |
| 52 |
 Kuwait |
$83.4B | 0.24% | vs Kuwait |
| 53 |
 Morocco |
$76.5B | 0.22% | vs Morocco |
| 54 |
 Egypt |
$72.4B | 0.21% | |
| 55 |
 Lithuania |
$69.5B | 0.2% | |
| 56 |
 Colombia |
$68.5B | 0.2% | vs Colombia |
| 57 |
 Bulgaria |
$66.4B | 0.19% |
Egypt exports of goods and services, % of GDP, 1960–2025
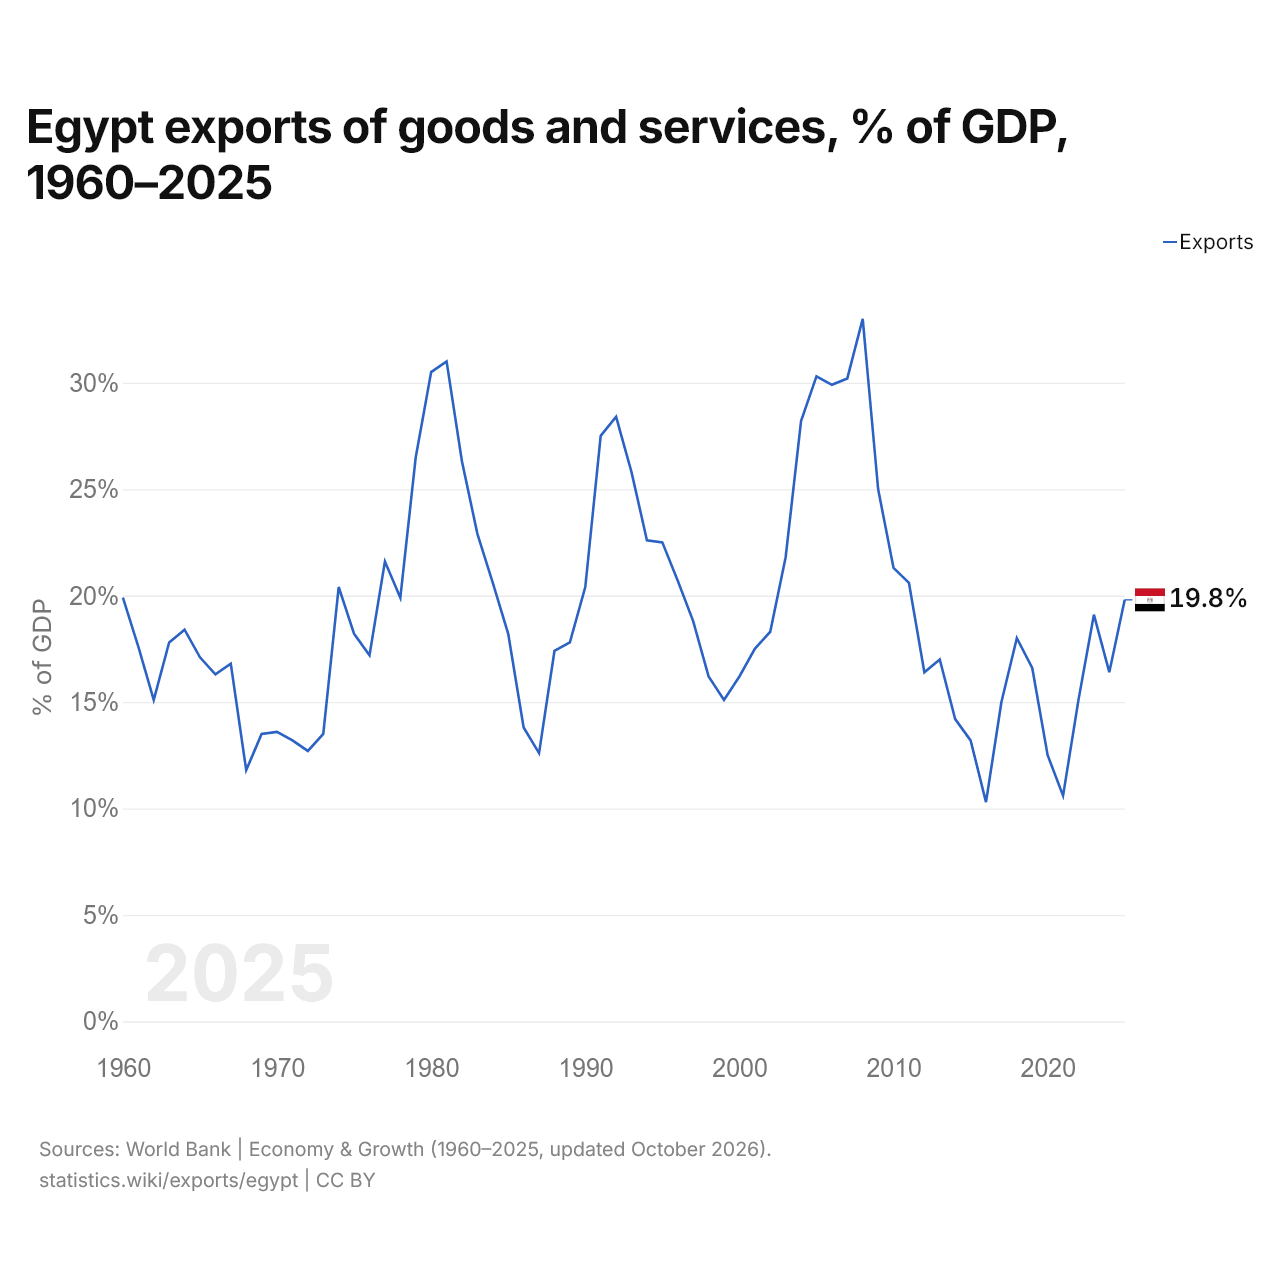
In 2025, Egypt's exports of goods and services were equal to 19.8% of its GDP, down from 19.9% in 1960. The share was highest in 2008, at 33.0%.
Compare Egypt exports with other countries
Sources:
- TradeMap (2001–2025, updated October 2026)
- World Bank | Economy & Growth (1960–2025, updated October 2026)
Creative Commons Attribution (CC BY): you may copy, share, adapt and reuse this content, also commercially, as long as you credit statistics.wiki and note any changes you made. The sources listed above may have their own license terms.