
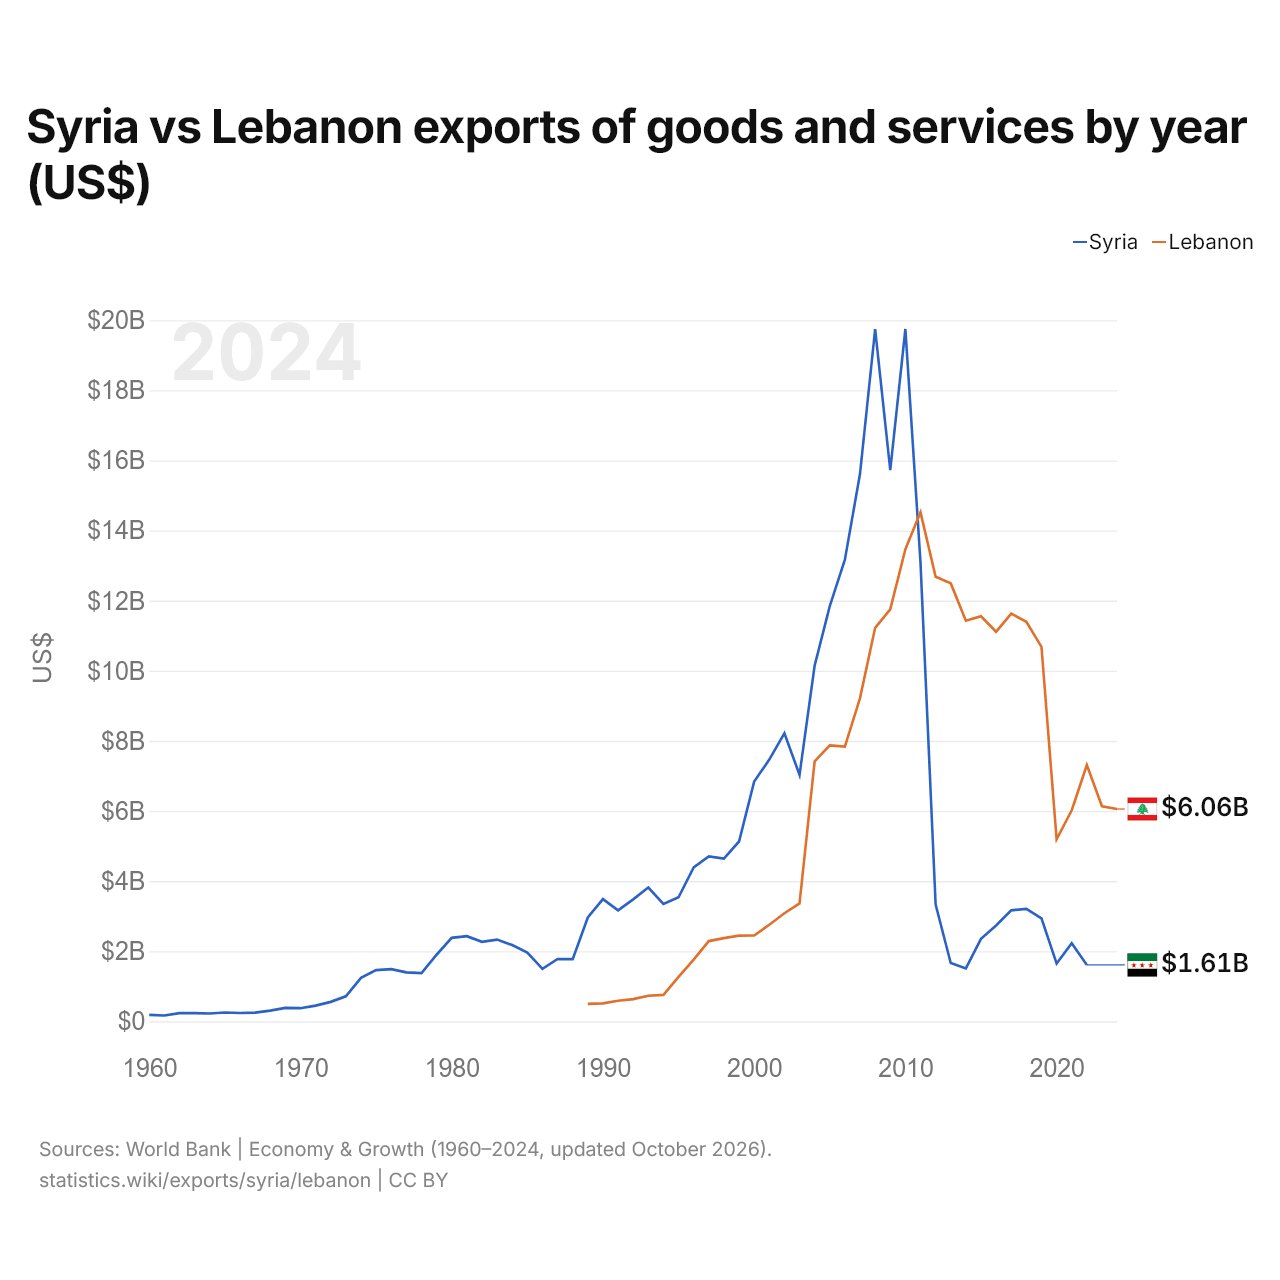
Syrie vs Liban : exportations de biens et services par année ($ US)
| Année | $ US | |
|---|---|---|
 Syrie |
 Liban |
|
| 2024 | - | 6 055 691 106 $ US |
| 2023 | - | 6 134 302 023 $ US |
| 2022 | 1 608 744 496 $ US | 7 311 404 299 $ US |
| 2021 | 2 226 608 573 $ US | 6 020 232 988 $ US |
| 2020 | 1 648 856 244 $ US | 5 192 095 746 $ US |
| 2019 | 2 938 069 172 $ US | 10 681 277 028 $ US |
| 2018 | 3 206 830 228 $ US | 11 394 547 410 $ US |
| 2017 | 3 165 874 598 $ US | 11 627 344 114 $ US |
| 2016 | 2 731 227 397 $ US | 11 112 344 036 $ US |
| 2015 | 2 353 296 642 $ US | 11 553 482 874 $ US |
| 2014 | 1 508 537 236 $ US | 11 425 578 094 $ US |
| 2013 | 1 661 482 225 $ US | 12 492 026 093 $ US |
| 2012 | 3 331 967 972 $ US | 12 680 893 475 $ US |
| 2011 | 13 081 933 251 $ US | 14 518 739 635 $ US |
| 2010 | 19 747 456 812 $ US | 13 464 256 798 $ US |
| 2009 | 15 724 551 096 $ US | 11 751 139 952 $ US |
| 2008 | 19 741 840 053 $ US | 11 224 076 779 $ US |
| 2007 | 15 617 340 809 $ US | 9 221 256 285 $ US |
| 2006 | 13 167 057 674 $ US | 7 837 807 010 $ US |
| 2005 | 11 844 406 130 $ US | 7 873 085 354 $ US |
| 2004 | 10 147 425 743 $ US | 7 417 557 506 $ US |
| 2003 | 7 030 359 683 $ US | 3 361 194 030 $ US |
| 2002 | 8 216 795 445 $ US | 3 083 250 415 $ US |
| 2001 | 7 464 741 326 $ US | 2 754 228 856 $ US |
| 2000 | 6 839 334 310 $ US | 2 447 097 844 $ US |
| 1999 | 5 129 922 481 $ US | 2 445 876 364 $ US |
| 1998 | 4 640 692 308 $ US | 2 373 803 864 $ US |
| 1997 | 4 702 704 280 $ US | 2 289 054 888 $ US |
| 1996 | 4 388 662 675 $ US | 1 758 689 127 $ US |
| 1995 | 3 537 504 990 $ US | 1 266 386 351 $ US |
| 1994 | 3 346 540 000 $ US | 755 509 732 $ US |
| 1993 | 3 816 418 531 $ US | 728 607 316 $ US |
| 1992 | 3 479 921 417 $ US | 634 069 546 $ US |
| 1991 | 3 168 250 000 $ US | 587 654 401 $ US |
| 1990 | 3 488 165 298 $ US | 510 722 597 $ US |
| 1989 | 2 962 782 879 $ US | 498 732 255 $ US |
| 1988 | 1 774 447 445 $ US | - |
| 1987 | 1 778 676 863 $ US | - |
| 1986 | 1 497 286 368 $ US | - |
| 1985 | 1 960 935 036 $ US | - |
| 1984 | 2 174 468 579 $ US | - |
| 1983 | 2 331 285 399 $ US | - |
| 1982 | 2 268 031 466 $ US | - |
| 1981 | 2 427 631 113 $ US | - |
| 1980 | 2 380 891 720 $ US | - |
| 1979 | 1 900 127 389 $ US | - |
| 1978 | 1 376 861 397 $ US | - |
| 1977 | 1 398 290 598 $ US | - |
| 1976 | 1 490 583 513 $ US | - |
| 1975 | 1 461 385 482 $ US | - |
| 1974 | 1 242 591 990 $ US | - |
| 1973 | 714 520 368 $ US | - |
| 1972 | 555 039 788 $ US | - |
| 1971 | 449 256 626 $ US | - |
| 1970 | 374 567 202 $ US | - |
| 1969 | 384 128 067 $ US | - |
| 1968 | 304 528 181 $ US | - |
| 1967 | 248 911 547 $ US | - |
| 1966 | 237 017 340 $ US | - |
| 1965 | 250 836 076 $ US | - |
| 1964 | 223 808 508 $ US | - |
| 1963 | 233 218 639 $ US | - |
| 1962 | 232 483 198 $ US | - |
| 1961 | 166 354 553 $ US | - |
| 1960 | 183 179 972 $ US | - |
Les exportations de biens et services de la Syrie s'élevaient à 1,61 milliard de dollars (2022) et celles du Liban à 7,31 milliards de dollars (2022) : celles du Liban étaient 4,5 fois plus élevées. En 1989, les exportations de la Syrie étaient 5,9 fois plus élevées : 2,96 milliards de dollars pour la Syrie et 499 millions de dollars pour le Liban.
Les exportations de biens et services du Liban sont supérieures à celles de la Syrie chaque année depuis 2011.
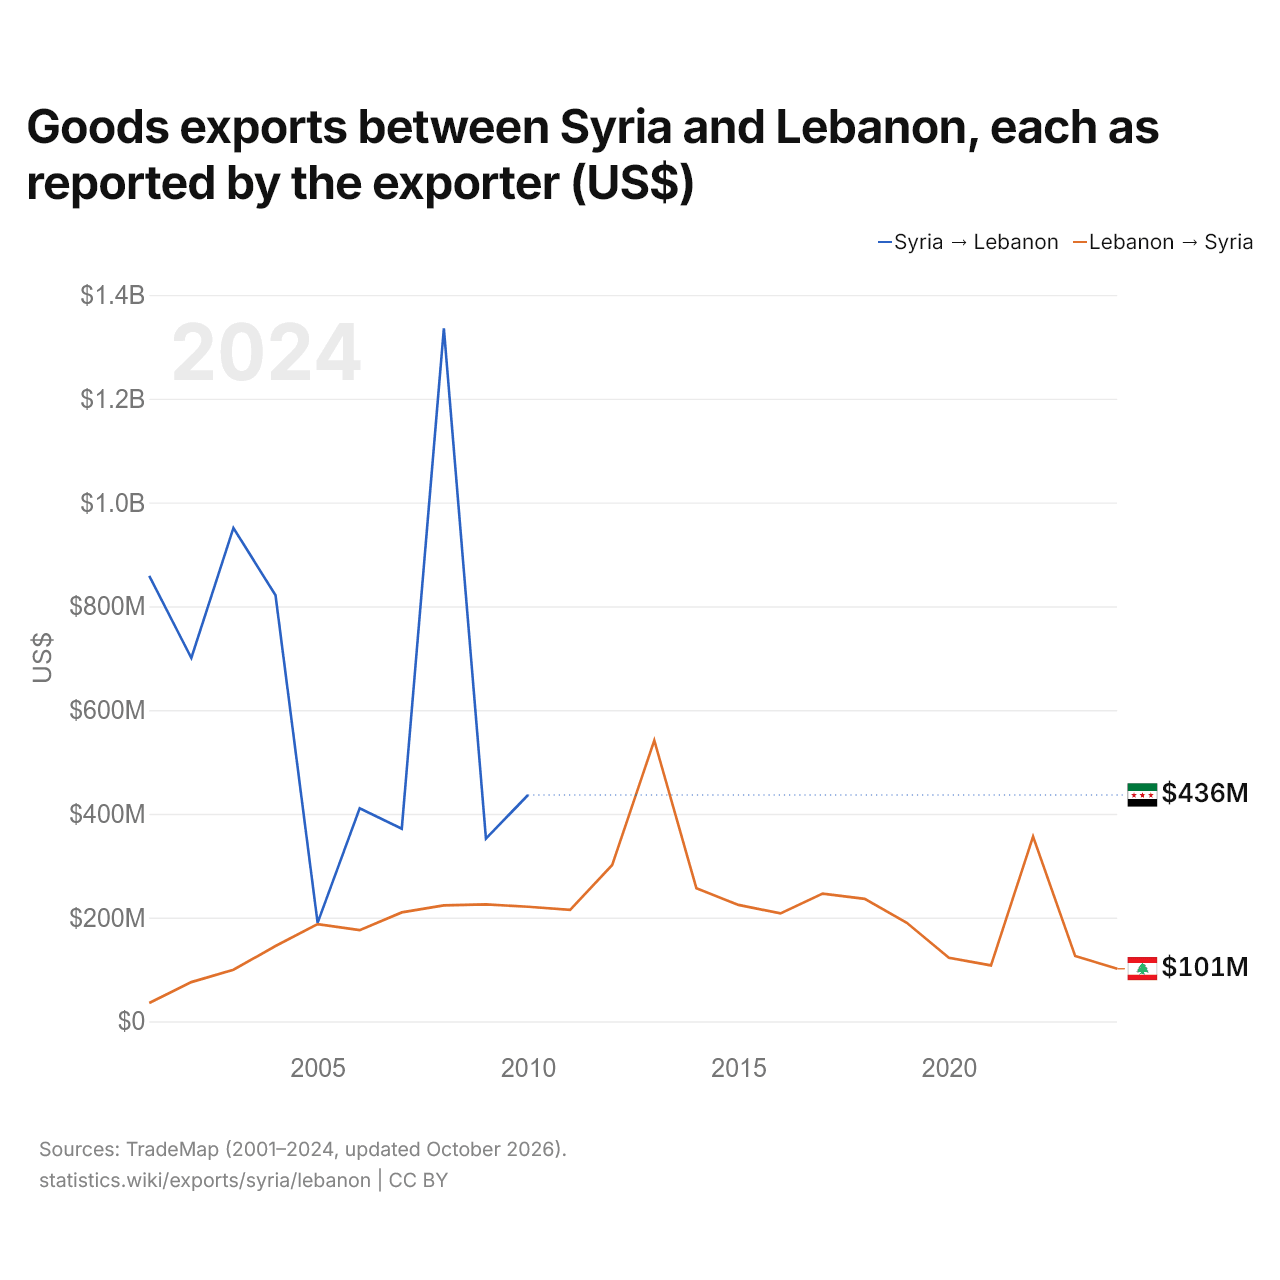
Exportations de biens entre la Syrie et le Liban, selon chaque exportateur ($ US)
| Année | $ US | |
|---|---|---|
| Syrie → Liban | Liban → Syrie | |
| 2024 | - | 101 351 000 $ US |
| 2023 | - | 126 087 000 $ US |
| 2022 | - | 356 224 000 $ US |
| 2021 | - | 107 853 000 $ US |
| 2020 | - | 122 341 000 $ US |
| 2019 | - | 190 020 000 $ US |
| 2018 | - | 236 090 000 $ US |
| 2017 | - | 246 245 000 $ US |
| 2016 | - | 208 074 000 $ US |
| 2015 | - | 224 483 000 $ US |
| 2014 | - | 256 745 000 $ US |
| 2013 | - | 541 447 000 $ US |
| 2012 | - | 301 494 000 $ US |
| 2011 | - | 214 909 000 $ US |
| 2010 | 436 249 000 $ US | 220 818 000 $ US |
| 2009 | 352 257 000 $ US | 225 443 000 $ US |
| 2008 | 1 335 654 000 $ US | 223 587 000 $ US |
| 2007 | 371 231 000 $ US | 209 939 000 $ US |
| 2006 | 410 747 000 $ US | 175 737 000 $ US |
| 2005 | 189 791 000 $ US | 187 453 000 $ US |
| 2004 | 821 309 000 $ US | 145 130 000 $ US |
| 2003 | 951 056 000 $ US | 99 509 000 $ US |
| 2002 | 700 332 000 $ US | 75 595 000 $ US |
| 2001 | 858 822 000 $ US | 35 206 000 $ US |
Les exportations de biens de la Syrie vers le Liban, selon la Syrie, s'élevaient à 436 millions de dollars, et celles du Liban vers la Syrie, selon le Liban, à 221 millions de dollars : 2,0 fois plus pour celles de la Syrie. En 2001, elles s'élevaient à 859 millions de dollars pour la Syrie et à 35,2 millions de dollars pour le Liban.
Syrie vs Liban : chiffres des exportations
|
Syrie
|
Liban
|
|
|---|---|---|
| Exportations | 1,61 Md $US (2022) | 6,06 Md $US (2024) |
| Rang mondial | 153/176 | 129/176 |
| Part mondiale | 0,005 % | 0,02 % |
| % du PIB | 6,8 % | 23,3 % |
| Première catégorie de biens | n.d. | Machines, électronique et véhicules (33,1 %, 2024) |
| Première destination des biens | n.d. | Émirats arabes unis (24,1 %, 2024) |
Comparer les exportations de 2 pays au choix
Sources :
- Banque mondiale | Économie et croissance (1960–2024, mis à jour en octobre 2026)
- TradeMap (2001–2024, mis à jour en octobre 2026)
Creative Commons Attribution (CC BY) : vous pouvez copier, partager, adapter et réutiliser ce contenu, y compris à des fins commerciales, à condition de citer statistics.wiki et d’indiquer les modifications apportées. Les sources citées ci-dessus peuvent avoir leurs propres conditions de licence.