
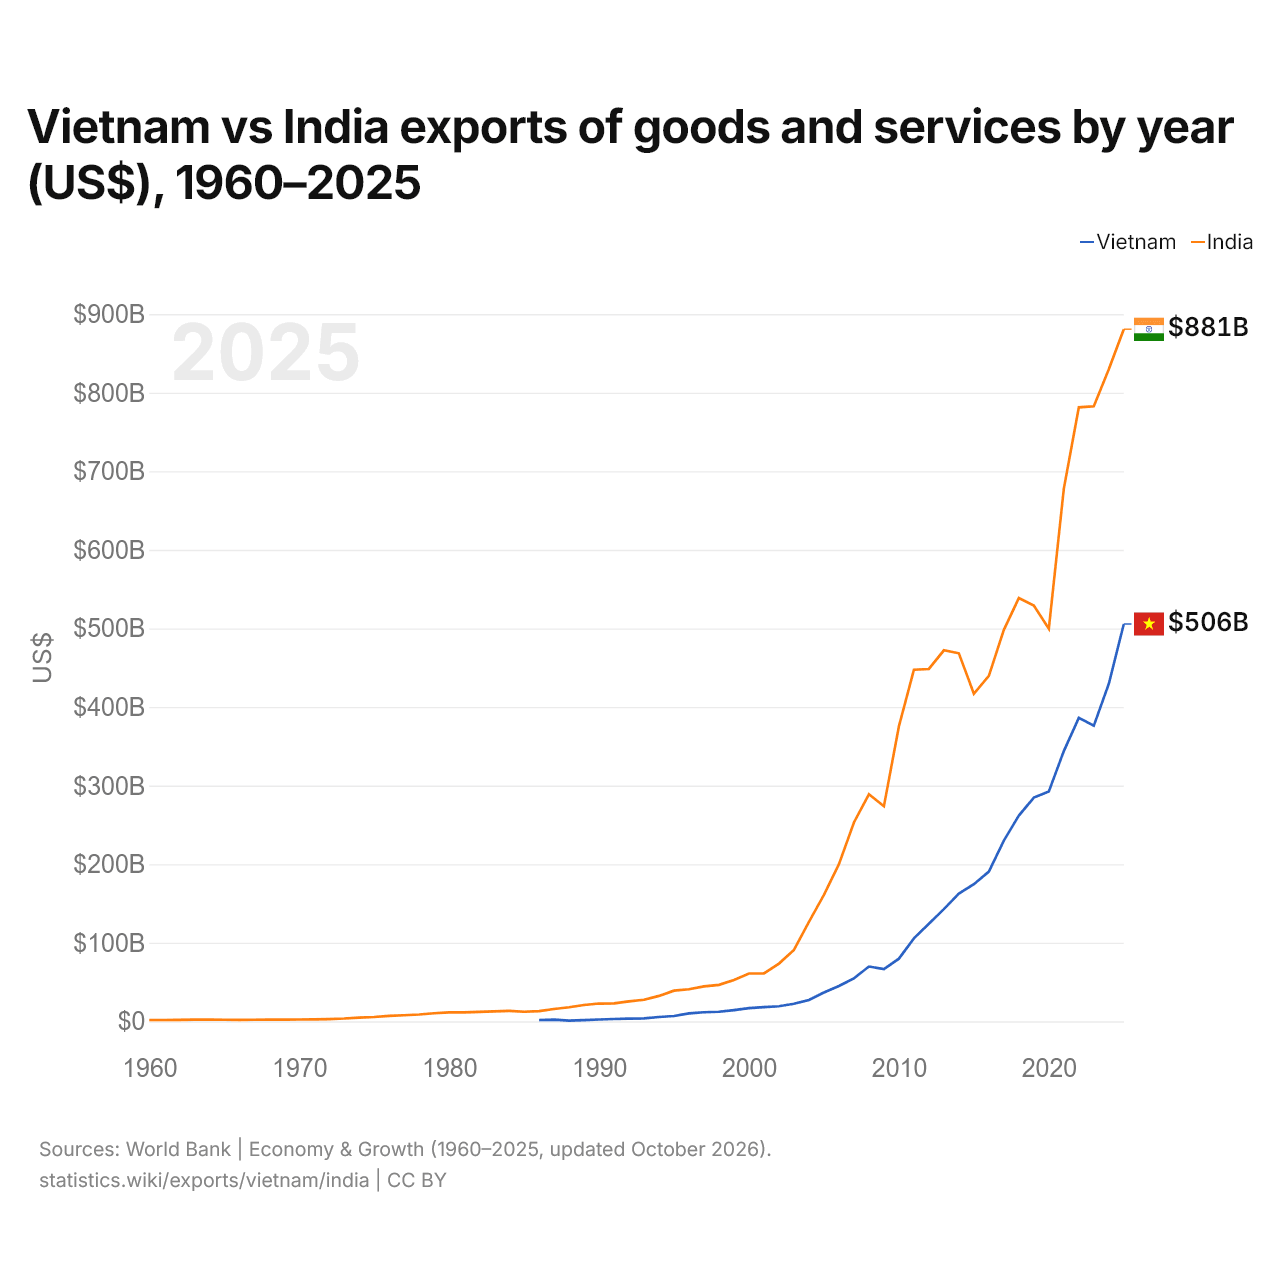
Vietnam vs Inde : exportations de biens et services par année ($ US), 1960–2025
| Année | $ US | |
|---|---|---|
 Vietnam |
 Inde |
|
| 2025 | 505 661 231 330 $ US | 880 740 846 622 $ US |
| 2024 | 429 484 097 217 $ US | 829 785 193 474 $ US |
| 2023 | 376 268 017 649 $ US | 782 620 610 192 $ US |
| 2022 | 386 241 068 015 $ US | 781 290 791 564 $ US |
| 2021 | 343 937 314 546 $ US | 677 769 255 429 $ US |
| 2020 | 292 479 899 129 $ US | 499 728 529 073 $ US |
| 2019 | 284 737 397 483 $ US | 529 245 063 167 $ US |
| 2018 | 261 802 606 599 $ US | 538 635 186 135 $ US |
| 2017 | 230 041 803 530 $ US | 498 258 808 232 $ US |
| 2016 | 190 526 869 545 $ US | 439 642 578 076 $ US |
| 2015 | 174 473 996 313 $ US | 416 787 940 848 $ US |
| 2014 | 162 478 898 406 $ US | 468 345 815 421 $ US |
| 2013 | 142 758 439 316 $ US | 472 180 271 340 $ US |
| 2012 | 124 149 069 364 $ US | 448 400 477 361 $ US |
| 2011 | 105 593 919 858 $ US | 447 384 417 625 $ US |
| 2010 | 79 747 480 853 $ US | 375 353 514 026 $ US |
| 2009 | 66 374 595 301 $ US | 273 752 124 889 $ US |
| 2008 | 69 724 976 614 $ US | 288 902 044 821 $ US |
| 2007 | 54 591 007 521 $ US | 253 077 526 013 $ US |
| 2006 | 44 944 777 029 $ US | 199 973 922 364 $ US |
| 2005 | 36 712 091 515 $ US | 160 838 260 681 $ US |
| 2004 | 27 134 530 700 $ US | 126 648 472 021 $ US |
| 2003 | 22 415 697 836 $ US | 90 838 575 244 $ US |
| 2002 | 19 193 787 587 $ US | 73 452 895 952 $ US |
| 2001 | 17 997 102 361 $ US | 60 963 415 577 $ US |
| 2000 | 16 808 688 578 $ US | 60 878 472 821 $ US |
| 1999 | 14 332 147 613 $ US | 52 544 483 403 $ US |
| 1998 | 12 203 044 875 $ US | 46 426 465 025 $ US |
| 1997 | 11 570 361 483 $ US | 44 459 225 643 $ US |
| 1996 | 10 077 135 261 $ US | 40 803 004 618 $ US |
| 1995 | 6 804 127 646 $ US | 39 068 855 118 $ US |
| 1994 | 5 539 525 589 $ US | 32 361 214 431 $ US |
| 1993 | 3 785 936 655 $ US | 27 466 541 463 $ US |
| 1992 | 3 428 344 547 $ US | 25 486 029 047 $ US |
| 1991 | 2 971 976 969 $ US | 22 943 398 073 $ US |
| 1990 | 2 332 325 665 $ US | 22 639 774 912 $ US |
| 1989 | 1 500 912 820 $ US | 20 770 696 112 $ US |
| 1988 | 1 003 045 229 $ US | 17 899 838 409 $ US |
| 1987 | 2 200 010 145 $ US | 15 638 662 914 $ US |
| 1986 | 1 744 152 761 $ US | 12 937 864 154 $ US |
| 1985 | - | 12 217 447 522 $ US |
| 1984 | - | 13 330 716 432 $ US |
| 1983 | - | 12 741 335 281 $ US |
| 1982 | - | 12 009 417 677 $ US |
| 1981 | - | 11 485 699 151 $ US |
| 1980 | - | 11 439 738 400 $ US |
| 1979 | - | 10 326 638 766 $ US |
| 1978 | - | 8 670 401 540 $ US |
| 1977 | - | 7 754 701 054 $ US |
| 1976 | - | 6 868 148 773 $ US |
| 1975 | - | 5 560 878 503 $ US |
| 1974 | - | 4 808 449 430 $ US |
| 1973 | - | 3 599 236 351 $ US |
| 1972 | - | 2 878 233 145 $ US |
| 1971 | - | 2 469 914 214 $ US |
| 1970 | - | 2 361 333 333 $ US |
| 1969 | - | 2 170 666 667 $ US |
| 1968 | - | 2 144 000 000 $ US |
| 1967 | - | 2 022 666 667 $ US |
| 1966 | - | 1 888 225 565 $ US |
| 1965 | - | 1 969 801 970 $ US |
| 1964 | - | 2 104 202 104 $ US |
| 1963 | - | 2 072 702 073 $ US |
| 1962 | - | 1 757 701 758 $ US |
| 1961 | - | 1 688 401 688 $ US |
| 1960 | - | 1 652 701 653 $ US |
En 2025, les exportations de biens et services du Vietnam s'élevaient à 506 milliards de dollars et celles de l'Inde à 881 milliards de dollars : celles de l'Inde étaient 1,7 fois plus élevées. En 1986, les exportations de l'Inde étaient 7,4 fois plus élevées : 1,74 milliard de dollars pour le Vietnam et 12,9 milliards de dollars pour l'Inde.
Les exportations de biens et services de l'Inde sont supérieures à celles du Vietnam chaque année depuis 1986.
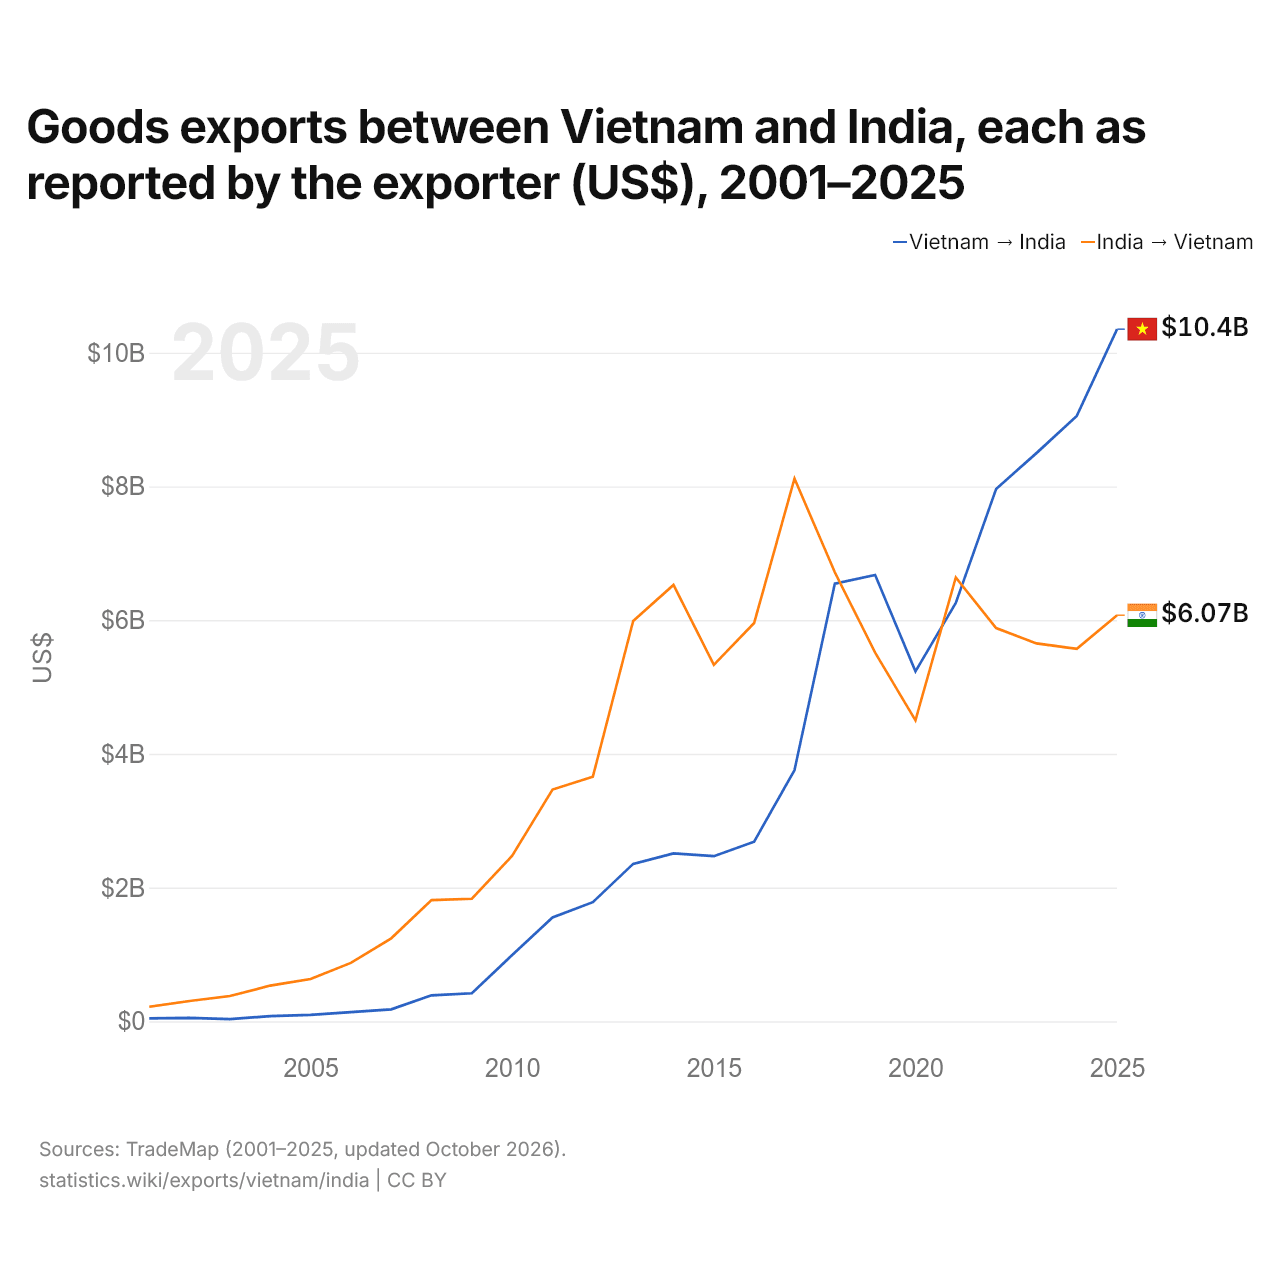
Exportations de biens entre le Vietnam et l'Inde, selon chaque exportateur ($ US), 2001–2025
| Année | $ US | |
|---|---|---|
| Vietnam → Inde | Inde → Vietnam | |
| 2025 | 10 350 969 000 $ US | 6 073 411 000 $ US |
| 2024 | 9 053 284 000 $ US | 5 571 721 000 $ US |
| 2023 | 8 497 250 000 $ US | 5 651 784 000 $ US |
| 2022 | 7 960 864 000 $ US | 5 880 778 000 $ US |
| 2021 | 6 258 022 000 $ US | 6 638 390 000 $ US |
| 2020 | 5 234 077 000 $ US | 4 500 549 000 $ US |
| 2019 | 6 675 949 000 $ US | 5 512 870 000 $ US |
| 2018 | 6 543 814 000 $ US | 6 715 614 000 $ US |
| 2017 | 3 756 251 000 $ US | 8 116 919 000 $ US |
| 2016 | 2 687 193 000 $ US | 5 956 938 000 $ US |
| 2015 | 2 469 722 000 $ US | 5 330 982 000 $ US |
| 2014 | 2 510 734 000 $ US | 6 526 524 000 $ US |
| 2013 | 2 354 695 000 $ US | 5 987 614 000 $ US |
| 2012 | 1 782 178 000 $ US | 3 658 160 000 $ US |
| 2011 | 1 553 921 000 $ US | 3 466 525 000 $ US |
| 2010 | 991 630 000 $ US | 2 475 596 000 $ US |
| 2009 | 419 577 000 $ US | 1 833 500 000 $ US |
| 2008 | 388 993 000 $ US | 1 812 607 000 $ US |
| 2007 | 179 657 000 $ US | 1 241 477 000 $ US |
| 2006 | 137 837 000 $ US | 874 098 000 $ US |
| 2005 | 97 756 000 $ US | 633 465 000 $ US |
| 2004 | 78 615 000 $ US | 534 846 000 $ US |
| 2003 | 32 273 000 $ US | 378 841 000 $ US |
| 2002 | 52 030 000 $ US | 304 441 000 $ US |
| 2001 | 45 365 000 $ US | 217 964 000 $ US |
En 2025, les exportations de biens du Vietnam vers l'Inde, selon le Vietnam, s'élevaient à 10,4 milliards de dollars, et celles de l'Inde vers le Vietnam, selon l'Inde, à 6,07 milliards de dollars : 1,7 fois plus pour celles du Vietnam. En 2001, elles s'élevaient à 45,4 millions de dollars pour le Vietnam et à 218 millions de dollars pour l'Inde.
Vietnam vs Inde : chiffres des exportations
|
Vietnam
|
Inde
|
|
|---|---|---|
| Exportations | 506 Md $US (2025) | 881 Md $US (2025) |
| Rang mondial | 21/176 | 10/176 |
| Part mondiale | 1,45 % | 2,52 % |
| % du PIB | 98,2 % | 22,3 % |
| Première catégorie de biens | Machines, électronique et véhicules (53,4 %, 2025) | Machines, électronique et véhicules (28,5 %, 2025) |
| Première destination des biens | États-Unis (32,4 %, 2025) | États-Unis (20,7 %, 2025) |
Comparer les exportations de 2 pays au choix
Sources :
- Banque mondiale | Économie et croissance (1960–2025, mis à jour en octobre 2026)
- TradeMap (2001–2025, mis à jour en octobre 2026)
Creative Commons Attribution (CC BY) : vous pouvez copier, partager, adapter et réutiliser ce contenu, y compris à des fins commerciales, à condition de citer statistics.wiki et d’indiquer les modifications apportées. Les sources citées ci-dessus peuvent avoir leurs propres conditions de licence.