
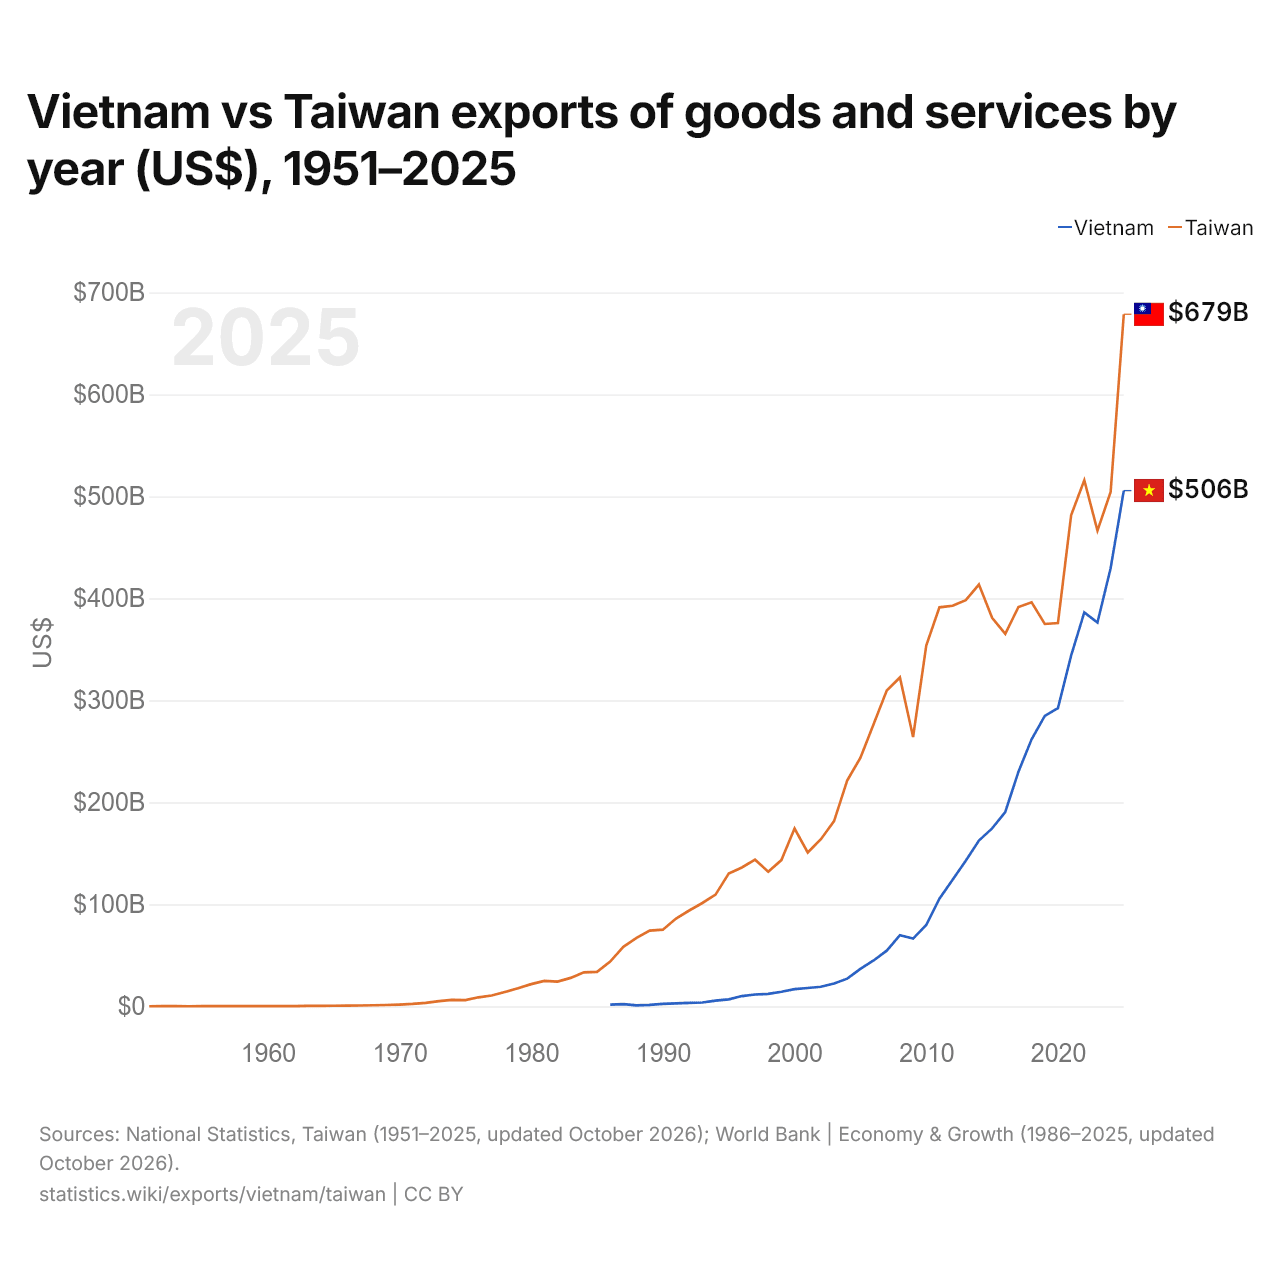
Vietnam vs Taïwan : exportations de biens et services par année ($ US), 1951–2025
| Année | $ US | |
|---|---|---|
 Vietnam |
 Taïwan |
|
| 2025 | 505 661 231 330 $ US | 678 566 116 350 $ US |
| 2024 | 429 484 097 217 $ US | 504 236 753 419 $ US |
| 2023 | 376 268 017 649 $ US | 466 445 326 327 $ US |
| 2022 | 386 241 068 015 $ US | 515 837 534 989 $ US |
| 2021 | 343 937 314 546 $ US | 481 459 688 595 $ US |
| 2020 | 292 479 899 129 $ US | 375 872 712 567 $ US |
| 2019 | 284 737 397 483 $ US | 374 895 590 744 $ US |
| 2018 | 261 802 606 599 $ US | 396 134 914 653 $ US |
| 2017 | 230 041 803 530 $ US | 391 530 628 346 $ US |
| 2016 | 190 526 869 545 $ US | 365 237 210 862 $ US |
| 2015 | 174 473 996 313 $ US | 380 980 430 904 $ US |
| 2014 | 162 478 898 406 $ US | 413 548 470 902 $ US |
| 2013 | 142 758 439 316 $ US | 398 200 754 692 $ US |
| 2012 | 124 149 069 364 $ US | 392 798 243 520 $ US |
| 2011 | 105 593 919 858 $ US | 391 211 487 294 $ US |
| 2010 | 79 747 480 853 $ US | 353 799 284 890 $ US |
| 2009 | 66 374 595 301 $ US | 264 144 048 543 $ US |
| 2008 | 69 724 976 614 $ US | 322 491 171 216 $ US |
| 2007 | 54 591 007 521 $ US | 309 660 821 223 $ US |
| 2006 | 44 944 777 029 $ US | 276 480 799 188 $ US |
| 2005 | 36 712 091 515 $ US | 243 674 106 867 $ US |
| 2004 | 27 134 530 700 $ US | 221 490 611 569 $ US |
| 2003 | 22 415 697 836 $ US | 181 544 738 333 $ US |
| 2002 | 19 193 787 587 $ US | 163 867 680 036 $ US |
| 2001 | 17 997 102 361 $ US | 150 802 861 162 $ US |
| 2000 | 16 808 688 578 $ US | 174 332 570 553 $ US |
| 1999 | 14 332 147 613 $ US | 143 385 134 964 $ US |
| 1998 | 12 203 044 875 $ US | 132 055 972 754 $ US |
| 1997 | 11 570 361 483 $ US | 143 806 932 753 $ US |
| 1996 | 10 077 135 261 $ US | 136 153 265 352 $ US |
| 1995 | 6 804 127 646 $ US | 130 179 556 061 $ US |
| 1994 | 5 539 525 589 $ US | 109 511 904 439 $ US |
| 1993 | 3 785 936 655 $ US | 101 333 514 601 $ US |
| 1992 | 3 428 344 547 $ US | 93 952 248 951 $ US |
| 1991 | 2 971 976 969 $ US | 86 108 179 742 $ US |
| 1990 | 2 332 325 665 $ US | 75 148 151 148 $ US |
| 1989 | 1 500 912 820 $ US | 74 212 678 516 $ US |
| 1988 | 1 003 045 229 $ US | 67 096 528 450 $ US |
| 1987 | 2 200 010 145 $ US | 58 334 391 897 $ US |
| 1986 | 1 744 152 761 $ US | 43 899 342 867 $ US |
| 1985 | - | 33 758 456 455 $ US |
| 1984 | - | 33 375 478 442 $ US |
| 1983 | - | 27 896 422 863 $ US |
| 1982 | - | 24 221 500 550 $ US |
| 1981 | - | 24 932 023 178 $ US |
| 1980 | - | 21 757 798 498 $ US |
| 1979 | - | 17 710 780 314 $ US |
| 1978 | - | 14 056 219 616 $ US |
| 1977 | - | 10 671 745 438 $ US |
| 1976 | - | 8 848 289 208 $ US |
| 1975 | - | 6 149 924 118 $ US |
| 1974 | - | 6 352 465 974 $ US |
| 1973 | - | 5 065 429 671 $ US |
| 1972 | - | 3 340 415 716 $ US |
| 1971 | - | 2 344 365 150 $ US |
| 1970 | - | 1 718 672 282 $ US |
| 1969 | - | 1 322 672 272 $ US |
| 1968 | - | 1 031 652 294 $ US |
| 1967 | - | 807 215 291 $ US |
| 1966 | - | 688 092 912 $ US |
| 1965 | - | 544 265 515 $ US |
| 1964 | - | 509 348 690 $ US |
| 1963 | - | 390 872 132 $ US |
| 1962 | - | 262 433 263 $ US |
| 1961 | - | 245 068 108 $ US |
| 1960 | - | 197 741 995 $ US |
| 1959 | - | 180 709 632 $ US |
| 1958 | - | 189 217 196 $ US |
| 1957 | - | 156 906 557 $ US |
| 1956 | - | 125 487 137 $ US |
| 1955 | - | 159 185 094 $ US |
| 1954 | - | 105 082 046 $ US |
| 1953 | - | 127 552 700 $ US |
| 1952 | - | 134 548 307 $ US |
| 1951 | - | 122 059 625 $ US |
En 2025, les exportations de biens et services du Vietnam s'élevaient à 506 milliards de dollars et celles de Taïwan à 679 milliards de dollars : celles de Taïwan étaient supérieures de 34 %. En 1986, les exportations de Taïwan étaient 25 fois plus élevées : 1,74 milliard de dollars pour le Vietnam et 43,9 milliards de dollars pour Taïwan.
Les exportations de biens et services de Taïwan sont supérieures à celles du Vietnam chaque année depuis 1986.
Vietnam vs Taïwan : chiffres des exportations
|
Vietnam
|
Taïwan
|
|
|---|---|---|
| Exportations | 506 Md $US (2025) | 679 Md $US (2025) |
| Rang mondial | 21/176 | 17/176 |
| Part mondiale | 1,45 % | 1,94 % |
| % du PIB | 98,2 % | 73,6 % |
| Première catégorie de biens | Machines, électronique et véhicules (53,4 %, 2025) | n.d. |
| Première destination des biens | États-Unis (32,4 %, 2025) | n.d. |
Comparer les exportations de 2 pays au choix
Sources :
- National Statistics, Taiwan (1951–2025, mis à jour en octobre 2026)
- Banque mondiale | Économie et croissance (1986–2025, mis à jour en octobre 2026)
- TradeMap (2025, mis à jour en octobre 2026)
Creative Commons Attribution (CC BY) : vous pouvez copier, partager, adapter et réutiliser ce contenu, y compris à des fins commerciales, à condition de citer statistics.wiki et d’indiquer les modifications apportées. Les sources citées ci-dessus peuvent avoir leurs propres conditions de licence.