
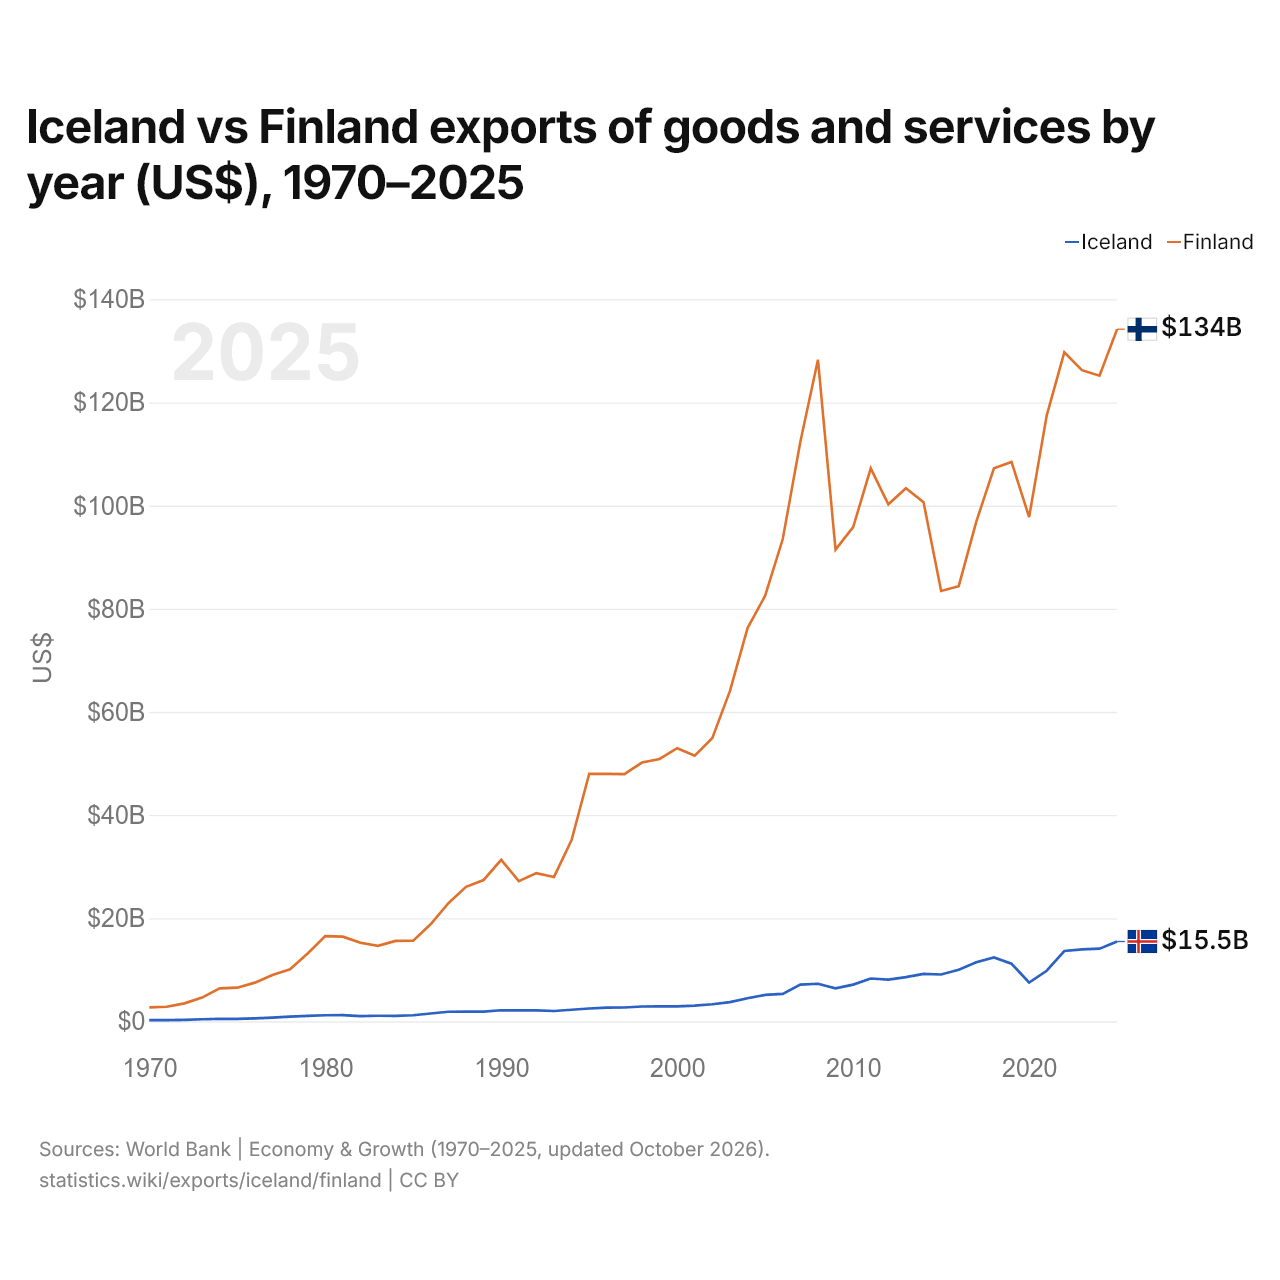
Islande vs Finlande : exportations de biens et services par année ($ US), 1970–2025
| Année | $ US | |
|---|---|---|
 Islande |
 Finlande |
|
| 2025 | 15 476 918 000 $ US | 134 192 277 448 $ US |
| 2024 | 14 090 127 915 $ US | 125 177 301 211 $ US |
| 2023 | 13 940 823 776 $ US | 126 248 924 941 $ US |
| 2022 | 13 632 709 462 $ US | 129 714 531 245 $ US |
| 2021 | 9 802 647 461 $ US | 117 459 122 934 $ US |
| 2020 | 7 522 355 306 $ US | 97 778 840 103 $ US |
| 2019 | 11 172 065 684 $ US | 108 456 929 459 $ US |
| 2018 | 12 397 616 650 $ US | 107 217 678 991 $ US |
| 2017 | 11 445 214 118 $ US | 96 883 717 056 $ US |
| 2016 | 10 012 449 483 $ US | 84 368 155 261 $ US |
| 2015 | 9 086 505 055 $ US | 83 446 464 504 $ US |
| 2014 | 9 191 034 651 $ US | 100 656 518 925 $ US |
| 2013 | 8 580 915 713 $ US | 103 378 051 936 $ US |
| 2012 | 8 097 199 624 $ US | 100 235 357 814 $ US |
| 2011 | 8 306 196 645 $ US | 107 209 785 535 $ US |
| 2010 | 7 121 350 039 $ US | 95 813 520 650 $ US |
| 2009 | 6 408 804 967 $ US | 91 464 252 097 $ US |
| 2008 | 7 284 145 795 $ US | 128 286 645 762 $ US |
| 2007 | 7 110 704 785 $ US | 112 360 012 523 $ US |
| 2006 | 5 310 428 256 $ US | 93 509 466 784 $ US |
| 2005 | 5 116 287 715 $ US | 82 514 287 315 $ US |
| 2004 | 4 480 777 642 $ US | 76 257 431 519 $ US |
| 2003 | 3 728 493 371 $ US | 64 062 137 649 $ US |
| 2002 | 3 309 446 650 $ US | 54 947 289 188 $ US |
| 2001 | 3 042 019 192 $ US | 51 507 654 130 $ US |
| 2000 | 2 899 936 222 $ US | 52 967 332 461 $ US |
| 1999 | 2 915 299 612 $ US | 50 865 246 751 $ US |
| 1998 | 2 871 539 298 $ US | 50 182 465 510 $ US |
| 1997 | 2 689 829 672 $ US | 47 944 107 204 $ US |
| 1996 | 2 658 458 135 $ US | 47 988 609 889 $ US |
| 1995 | 2 493 202 436 $ US | 47 992 919 390 $ US |
| 1994 | 2 251 420 757 $ US | 35 158 793 398 $ US |
| 1993 | 2 007 806 139 $ US | 27 996 252 732 $ US |
| 1992 | 2 113 685 423 $ US | 28 745 686 222 $ US |
| 1991 | 2 130 770 692 $ US | 27 176 885 752 $ US |
| 1990 | 2 144 153 418 $ US | 31 323 277 873 $ US |
| 1989 | 1 873 815 640 $ US | 27 400 581 959 $ US |
| 1988 | 1 910 725 694 $ US | 26 071 073 205 $ US |
| 1987 | 1 864 331 518 $ US | 22 897 335 317 $ US |
| 1986 | 1 516 684 791 $ US | 18 858 784 893 $ US |
| 1985 | 1 183 251 903 $ US | 15 638 910 207 $ US |
| 1984 | 1 072 642 449 $ US | 15 594 578 552 $ US |
| 1983 | 1 081 525 794 $ US | 14 631 725 021 $ US |
| 1982 | 1 016 617 901 $ US | 15 244 850 130 $ US |
| 1981 | 1 191 331 358 $ US | 16 409 479 195 $ US |
| 1980 | 1 182 341 379 $ US | 16 534 905 961 $ US |
| 1979 | 1 066 704 197 $ US | 13 152 190 505 $ US |
| 1978 | 903 769 319 $ US | 10 101 083 032 $ US |
| 1977 | 716 305 627 $ US | 8 995 130 589 $ US |
| 1976 | 568 047 977 $ US | 7 499 615 325 $ US |
| 1975 | 461 359 141 $ US | 6 523 355 423 $ US |
| 1974 | 468 893 447 $ US | 6 381 402 237 $ US |
| 1973 | 404 493 509 $ US | 4 596 304 652 $ US |
| 1972 | 289 636 302 $ US | 3 487 225 409 $ US |
| 1971 | 247 179 545 $ US | 2 827 196 647 $ US |
| 1970 | 233 403 409 $ US | 2 711 046 149 $ US |
En 2025, les exportations de biens et services de l'Islande s'élevaient à 15,5 milliards de dollars et celles de la Finlande à 134 milliards de dollars : celles de la Finlande étaient 8,7 fois plus élevées. En 1970, les exportations de la Finlande étaient 12 fois plus élevées : 233 millions de dollars pour l'Islande et 2,71 milliards de dollars pour la Finlande.
Les exportations de biens et services de la Finlande sont supérieures à celles de l'Islande chaque année depuis 1970.
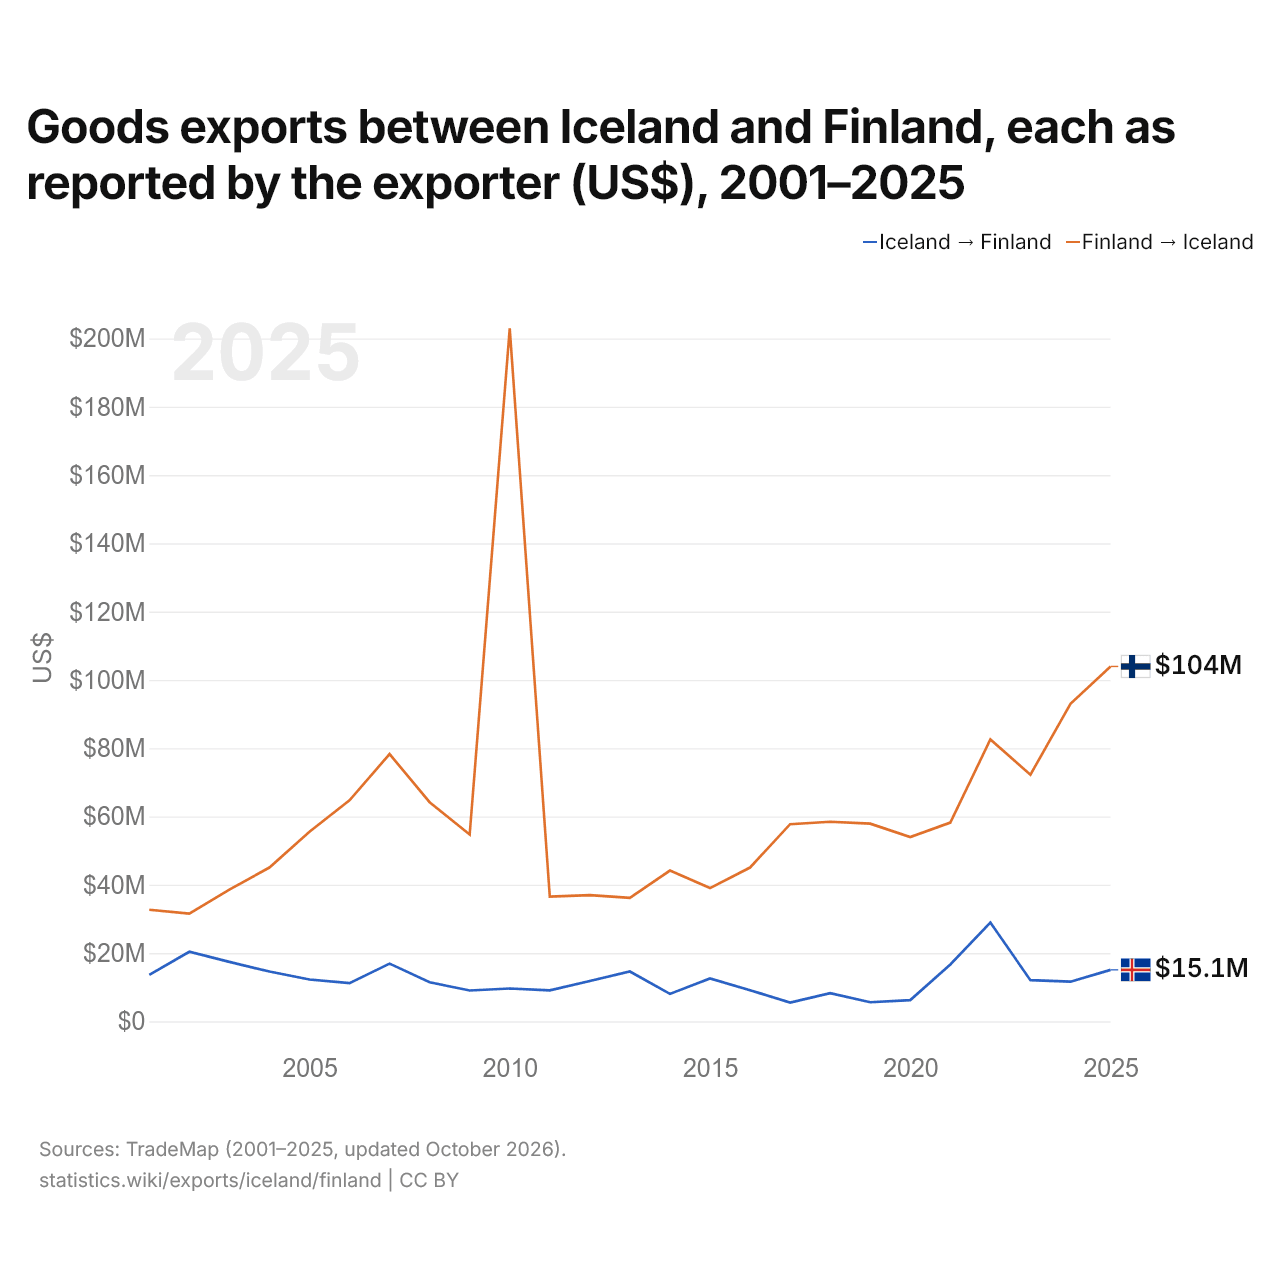
Exportations de biens entre l'Islande et la Finlande, selon chaque exportateur ($ US), 2001–2025
| Année | $ US | |
|---|---|---|
| Islande → Finlande | Finlande → Islande | |
| 2025 | 15 070 000 $ US | 103 939 000 $ US |
| 2024 | 11 620 000 $ US | 92 990 000 $ US |
| 2023 | 12 051 000 $ US | 72 237 000 $ US |
| 2022 | 28 943 000 $ US | 82 557 000 $ US |
| 2021 | 16 643 000 $ US | 58 197 000 $ US |
| 2020 | 6 221 000 $ US | 53 998 000 $ US |
| 2019 | 5 585 000 $ US | 57 910 000 $ US |
| 2018 | 8 266 000 $ US | 58 454 000 $ US |
| 2017 | 5 510 000 $ US | 57 745 000 $ US |
| 2016 | 9 120 000 $ US | 45 044 000 $ US |
| 2015 | 12 545 000 $ US | 39 024 000 $ US |
| 2014 | 8 041 000 $ US | 44 149 000 $ US |
| 2013 | 14 609 000 $ US | 36 160 000 $ US |
| 2012 | 11 814 000 $ US | 36 986 000 $ US |
| 2011 | 9 090 000 $ US | 36 551 000 $ US |
| 2010 | 9 622 000 $ US | 202 961 000 $ US |
| 2009 | 9 039 000 $ US | 54 704 000 $ US |
| 2008 | 11 459 000 $ US | 64 173 000 $ US |
| 2007 | 16 897 000 $ US | 78 281 000 $ US |
| 2006 | 11 190 000 $ US | 64 733 000 $ US |
| 2005 | 12 245 000 $ US | 55 552 000 $ US |
| 2004 | 14 595 000 $ US | 45 041 000 $ US |
| 2003 | 17 418 000 $ US | 38 600 000 $ US |
| 2002 | 20 373 000 $ US | 31 568 000 $ US |
| 2001 | 13 624 000 $ US | 32 692 000 $ US |
En 2025, les exportations de biens de l'Islande vers la Finlande, selon l'Islande, s'élevaient à 15,1 millions de dollars, et celles de la Finlande vers l'Islande, selon la Finlande, à 104 millions de dollars : 6,9 fois plus pour celles de la Finlande. En 2001, elles s'élevaient à 13,6 millions de dollars pour l'Islande et à 32,7 millions de dollars pour la Finlande.
Islande vs Finlande : chiffres des exportations
|
Islande
|
Finlande
|
|
|---|---|---|
| Exportations | 15,5 Md $US (2025) | 134 Md $US (2025) |
| Rang mondial | 96/176 | 40/176 |
| Part mondiale | 0,04 % | 0,38 % |
| % du PIB | 40,1 % | 42,3 % |
| Première catégorie de biens | Animaux, viande, poisson, produits laitiers, cuirs et peaux (40,5 %, 2025) | Machines, électronique et véhicules (36,8 %, 2025) |
| Première destination des biens | Pays-Bas (34,4 %, 2025) | Suède (11,3 %, 2025) |
Comparer les exportations de 2 pays au choix
Sources :
- Banque mondiale | Économie et croissance (1970–2025, mis à jour en octobre 2026)
- TradeMap (2001–2025, mis à jour en octobre 2026)
Creative Commons Attribution (CC BY) : vous pouvez copier, partager, adapter et réutiliser ce contenu, y compris à des fins commerciales, à condition de citer statistics.wiki et d’indiquer les modifications apportées. Les sources citées ci-dessus peuvent avoir leurs propres conditions de licence.