
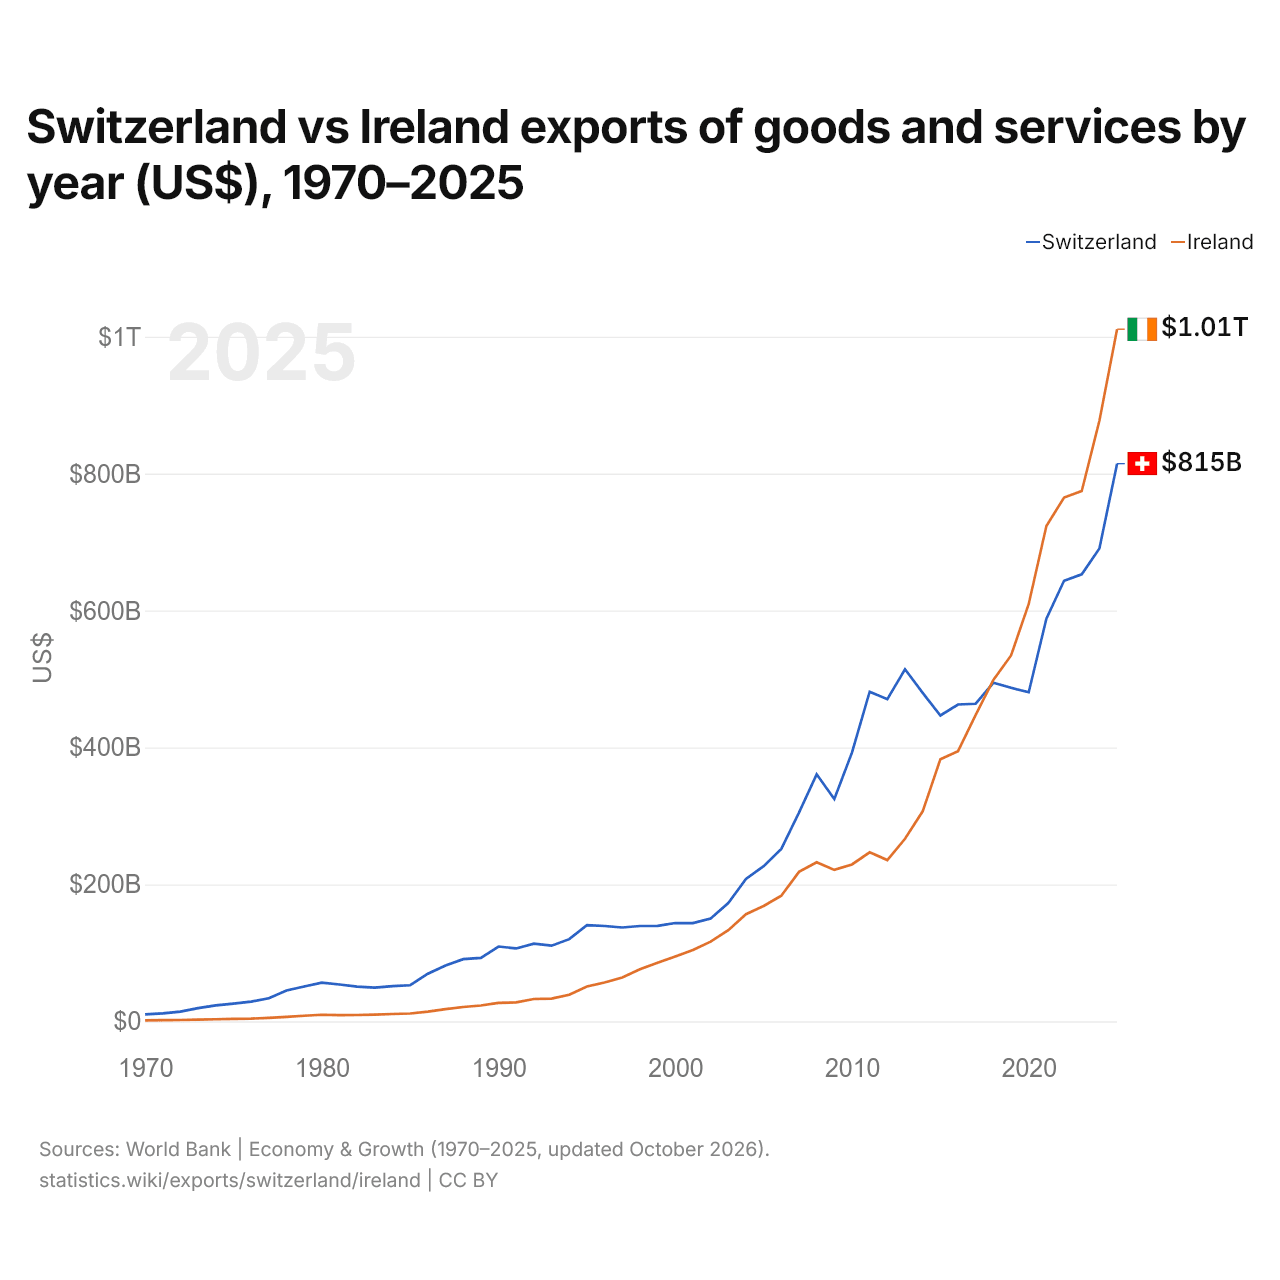
Suisse vs Irlande : exportations de biens et services par année ($ US), 1970–2025
| Année | $ US | |
|---|---|---|
 Suisse |
 Irlande |
|
| 2025 | 814 503 715 316 $ US | 1 010 863 026 885 $ US |
| 2024 | 690 605 094 607 $ US | 877 092 941 905 $ US |
| 2023 | 652 863 970 662 $ US | 774 613 383 952 $ US |
| 2022 | 643 557 905 706 $ US | 764 969 597 259 $ US |
| 2021 | 588 010 521 468 $ US | 723 445 227 903 $ US |
| 2020 | 480 636 933 810 $ US | 609 592 461 958 $ US |
| 2019 | 487 107 111 771 $ US | 534 361 678 398 $ US |
| 2018 | 494 420 271 334 $ US | 498 559 384 825 $ US |
| 2017 | 463 868 583 905 $ US | 447 623 457 263 $ US |
| 2016 | 462 738 867 466 $ US | 394 551 308 719 $ US |
| 2015 | 446 703 273 942 $ US | 382 724 762 971 $ US |
| 2014 | 479 770 769 573 $ US | 306 723 211 567 $ US |
| 2013 | 514 183 960 297 $ US | 266 600 810 534 $ US |
| 2012 | 470 575 706 517 $ US | 235 594 088 469 $ US |
| 2011 | 481 440 666 559 $ US | 246 785 523 404 $ US |
| 2010 | 392 634 157 918 $ US | 229 110 049 419 $ US |
| 2009 | 324 724 149 435 $ US | 221 207 094 301 $ US |
| 2008 | 360 773 405 041 $ US | 232 293 869 047 $ US |
| 2007 | 304 808 429 690 $ US | 218 323 414 732 $ US |
| 2006 | 251 898 409 635 $ US | 183 503 168 969 $ US |
| 2005 | 226 565 868 937 $ US | 168 500 867 903 $ US |
| 2004 | 207 969 226 377 $ US | 156 422 059 727 $ US |
| 2003 | 172 886 129 056 $ US | 133 120 814 360 $ US |
| 2002 | 150 061 817 015 $ US | 116 314 428 261 $ US |
| 2001 | 143 436 436 952 $ US | 104 124 679 774 $ US |
| 2000 | 143 573 715 656 $ US | 94 585 397 045 $ US |
| 1999 | 139 387 859 806 $ US | 85 503 791 297 $ US |
| 1998 | 139 258 235 619 $ US | 76 059 795 895 $ US |
| 1997 | 137 066 002 205 $ US | 63 903 008 596 $ US |
| 1996 | 139 233 532 362 $ US | 56 772 605 847 $ US |
| 1995 | 140 392 942 918 $ US | 50 831 584 596 $ US |
| 1994 | 120 051 280 983 $ US | 38 803 585 395 $ US |
| 1993 | 110 473 243 774 $ US | 33 215 365 740 $ US |
| 1992 | 113 363 416 299 $ US | 32 659 481 442 $ US |
| 1991 | 106 452 728 731 $ US | 27 672 807 707 $ US |
| 1990 | 109 283 796 430 $ US | 26 973 247 362 $ US |
| 1989 | 92 726 782 199 $ US | 23 122 490 233 $ US |
| 1988 | 90 816 316 545 $ US | 20 998 862 627 $ US |
| 1987 | 81 618 607 162 $ US | 17 787 856 976 $ US |
| 1986 | 69 522 234 699 $ US | 14 098 603 222 $ US |
| 1985 | 52 709 137 194 $ US | 11 493 857 750 $ US |
| 1984 | 51 471 115 036 $ US | 10 718 897 046 $ US |
| 1983 | 49 124 446 668 $ US | 9 750 540 276 $ US |
| 1982 | 50 767 115 697 $ US | 9 241 993 070 $ US |
| 1981 | 53 841 540 576 $ US | 8 965 729 497 $ US |
| 1980 | 56 444 626 126 $ US | 9 647 826 509 $ US |
| 1979 | 50 918 283 515 $ US | 8 154 121 534 $ US |
| 1978 | 44 991 603 468 $ US | 6 547 731 803 $ US |
| 1977 | 33 608 278 760 $ US | 4 973 657 096 $ US |
| 1976 | 28 842 385 582 $ US | 3 914 804 699 $ US |
| 1975 | 25 780 629 528 $ US | 3 624 897 213 $ US |
| 1974 | 23 287 832 377 $ US | 3 009 300 313 $ US |
| 1973 | 19 210 253 413 $ US | 2 545 049 199 $ US |
| 1972 | 14 155 280 549 $ US | 1 954 551 534 $ US |
| 1971 | 11 721 599 216 $ US | 1 647 964 737 $ US |
| 1970 | 10 268 487 766 $ US | 1 454 713 665 $ US |
En 2025, les exportations de biens et services de la Suisse s'élevaient à 815 milliards de dollars et celles de l'Irlande à 1,01 billion de dollars : celles de l'Irlande étaient supérieures de 24 %. En 1970, les exportations de la Suisse étaient 7,1 fois plus élevées : 10,3 milliards de dollars pour la Suisse et 1,45 milliard de dollars pour l'Irlande.
Les exportations de biens et services de l'Irlande sont supérieures à celles de la Suisse chaque année depuis 2018.
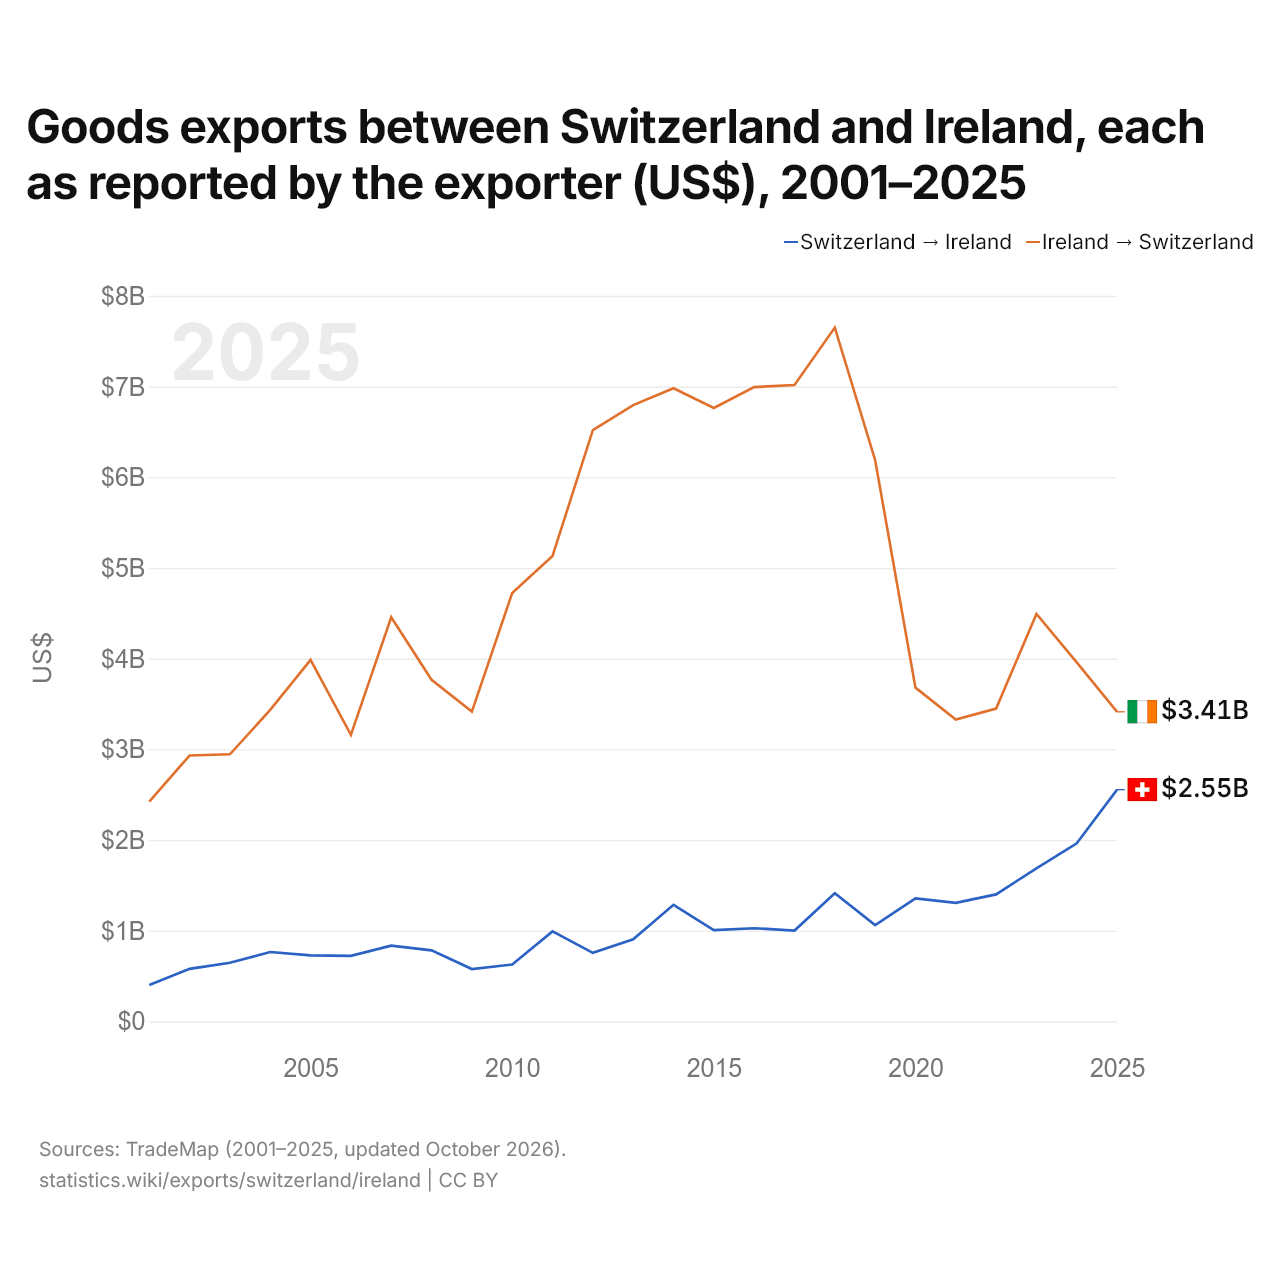
Exportations de biens entre la Suisse et l'Irlande, selon chaque exportateur ($ US), 2001–2025
| Année | $ US | |
|---|---|---|
| Suisse → Irlande | Irlande → Suisse | |
| 2025 | 2 554 985 000 $ US | 3 413 679 000 $ US |
| 2024 | 1 962 740 000 $ US | 3 957 369 000 $ US |
| 2023 | 1 686 774 000 $ US | 4 493 580 000 $ US |
| 2022 | 1 400 058 000 $ US | 3 448 969 000 $ US |
| 2021 | 1 305 864 000 $ US | 3 327 137 000 $ US |
| 2020 | 1 355 091 000 $ US | 3 679 560 000 $ US |
| 2019 | 1 061 099 000 $ US | 6 189 689 000 $ US |
| 2018 | 1 412 166 000 $ US | 7 650 824 000 $ US |
| 2017 | 1 000 981 000 $ US | 7 017 477 000 $ US |
| 2016 | 1 026 863 000 $ US | 6 994 317 000 $ US |
| 2015 | 1 006 522 000 $ US | 6 764 091 000 $ US |
| 2014 | 1 285 197 000 $ US | 6 981 518 000 $ US |
| 2013 | 905 661 000 $ US | 6 795 167 000 $ US |
| 2012 | 755 303 000 $ US | 6 518 757 000 $ US |
| 2011 | 991 765 000 $ US | 5 131 487 000 $ US |
| 2010 | 626 538 000 $ US | 4 722 734 000 $ US |
| 2009 | 576 923 000 $ US | 3 415 298 000 $ US |
| 2008 | 782 620 000 $ US | 3 766 379 000 $ US |
| 2007 | 834 772 000 $ US | 4 456 544 000 $ US |
| 2006 | 722 278 000 $ US | 3 158 521 000 $ US |
| 2005 | 727 635 000 $ US | 3 986 979 000 $ US |
| 2004 | 764 126 000 $ US | 3 434 216 000 $ US |
| 2003 | 645 496 000 $ US | 2 944 668 000 $ US |
| 2002 | 578 787 000 $ US | 2 931 685 000 $ US |
| 2001 | 401 078 000 $ US | 2 423 598 000 $ US |
En 2025, les exportations de biens de la Suisse vers l'Irlande, selon la Suisse, s'élevaient à 2,55 milliards de dollars, et celles de l'Irlande vers la Suisse, selon l'Irlande, à 3,41 milliards de dollars : 34 % de plus pour celles de l'Irlande. En 2001, elles s'élevaient à 401 millions de dollars pour la Suisse et à 2,42 milliards de dollars pour l'Irlande.
Suisse vs Irlande : chiffres des exportations
|
Suisse
|
Irlande
|
|
|---|---|---|
| Exportations | 815 Md $US (2025) | 1,01 Bn $US (2025) |
| Rang mondial | 13/176 | 8/176 |
| Part mondiale | 2,33 % | 2,9 % |
| % du PIB | 78,1 % | 140,1 % |
| Première catégorie de biens | Métaux précieux, pierres précieuses, bijoux, montres, instruments de musique et art (46,1 %, 2025) | Produits chimiques, pharmaceutiques et plastiques (67,2 %, 2025) |
| Première destination des biens | États-Unis (22,5 %, 2025) | États-Unis (42,5 %, 2025) |
Comparer les exportations de 2 pays au choix
Sources :
- Banque mondiale | Économie et croissance (1970–2025, mis à jour en octobre 2026)
- TradeMap (2001–2025, mis à jour en octobre 2026)
Creative Commons Attribution (CC BY) : vous pouvez copier, partager, adapter et réutiliser ce contenu, y compris à des fins commerciales, à condition de citer statistics.wiki et d’indiquer les modifications apportées. Les sources citées ci-dessus peuvent avoir leurs propres conditions de licence.