
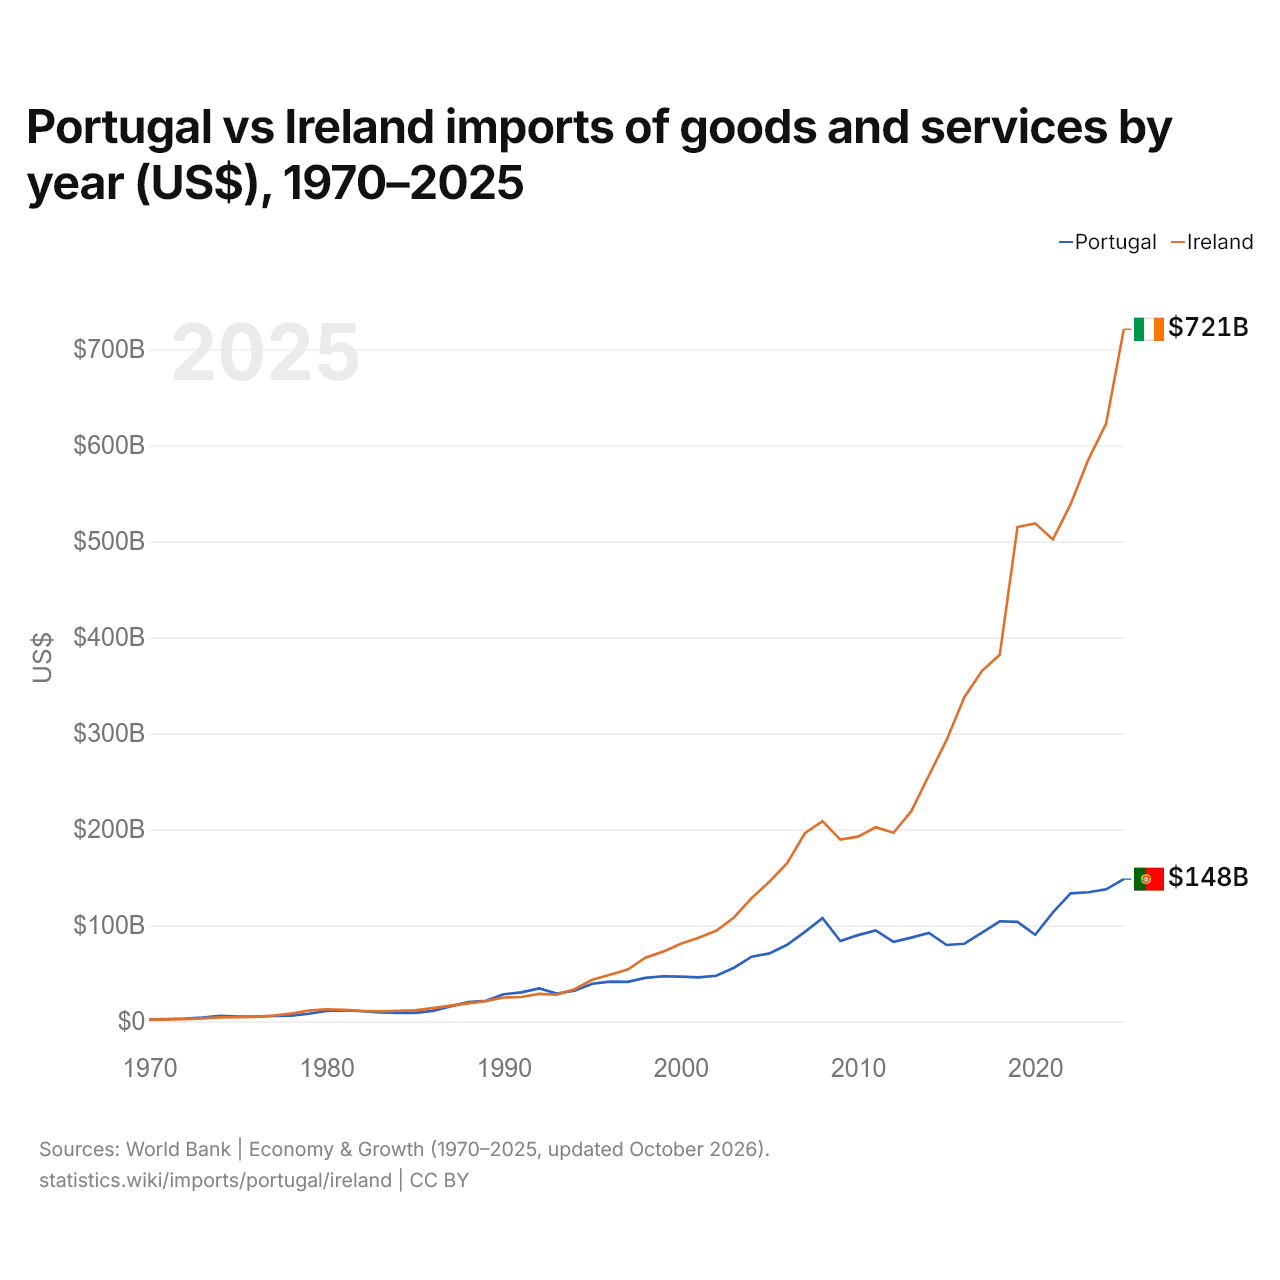
Portugal vs Irlande : importations de biens et services par année ($ US), 1970–2025
| Année | $ US | |
|---|---|---|
 Portugal |
 Irlande |
|
| 2025 | 148 156 593 238 $ US | 720 923 704 651 $ US |
| 2024 | 137 513 069 104 $ US | 622 469 214 439 $ US |
| 2023 | 134 411 585 081 $ US | 585 093 268 388 $ US |
| 2022 | 133 285 364 419 $ US | 538 742 737 110 $ US |
| 2021 | 113 497 070 631 $ US | 501 936 785 224 $ US |
| 2020 | 90 131 397 408 $ US | 518 713 605 706 $ US |
| 2019 | 103 532 874 929 $ US | 514 830 799 947 $ US |
| 2018 | 104 240 636 748 $ US | 381 868 643 805 $ US |
| 2017 | 92 464 542 115 $ US | 365 103 478 210 $ US |
| 2016 | 80 804 179 611 $ US | 337 593 450 587 $ US |
| 2015 | 79 509 937 177 $ US | 293 084 919 846 $ US |
| 2014 | 92 113 305 018 $ US | 256 055 573 294 $ US |
| 2013 | 87 194 990 738 $ US | 218 622 360 431 $ US |
| 2012 | 82 755 123 140 $ US | 196 364 505 336 $ US |
| 2011 | 94 725 068 832 $ US | 202 164 282 000 $ US |
| 2010 | 89 801 905 968 $ US | 192 360 308 446 $ US |
| 2009 | 83 673 807 857 $ US | 189 237 997 749 $ US |
| 2008 | 107 512 515 975 $ US | 208 530 667 033 $ US |
| 2007 | 93 196 905 901 $ US | 195 969 684 482 $ US |
| 2006 | 79 723 354 569 $ US | 164 818 339 201 $ US |
| 2005 | 70 735 904 961 $ US | 145 449 057 042 $ US |
| 2004 | 67 301 751 547 $ US | 128 503 157 353 $ US |
| 2003 | 55 799 780 174 $ US | 108 173 694 049 $ US |
| 2002 | 47 495 078 930 $ US | 94 222 138 296 $ US |
| 2001 | 45 789 575 479 $ US | 87 057 814 273 $ US |
| 2000 | 46 550 613 708 $ US | 80 732 344 853 $ US |
| 1999 | 46 950 345 046 $ US | 72 598 943 756 $ US |
| 1998 | 45 239 506 901 $ US | 66 249 949 535 $ US |
| 1997 | 41 132 256 146 $ US | 53 976 683 381 $ US |
| 1996 | 41 278 931 635 $ US | 48 476 633 065 $ US |
| 1995 | 39 151 232 586 $ US | 43 269 875 000 $ US |
| 1994 | 31 944 022 947 $ US | 33 418 612 485 $ US |
| 1993 | 29 049 311 807 $ US | 27 904 818 002 $ US |
| 1992 | 34 266 584 497 $ US | 28 596 731 877 $ US |
| 1991 | 30 177 947 829 $ US | 25 321 115 477 $ US |
| 1990 | 28 247 582 618 $ US | 24 812 175 329 $ US |
| 1989 | 21 452 554 113 $ US | 21 007 092 309 $ US |
| 1988 | 20 038 610 028 $ US | 18 745 179 364 $ US |
| 1987 | 15 532 868 934 $ US | 16 385 098 315 $ US |
| 1986 | 10 858 608 766 $ US | 13 790 559 559 $ US |
| 1985 | 8 751 378 986 $ US | 11 426 996 752 $ US |
| 1984 | 8 884 931 526 $ US | 11 057 699 334 $ US |
| 1983 | 9 363 968 512 $ US | 10 545 459 528 $ US |
| 1982 | 10 708 695 762 $ US | 10 937 756 539 $ US |
| 1981 | 11 270 547 231 $ US | 11 905 906 959 $ US |
| 1980 | 10 783 476 171 $ US | 12 600 904 677 $ US |
| 1979 | 7 863 475 410 $ US | 11 135 980 013 $ US |
| 1978 | 5 958 549 270 $ US | 8 058 103 292 $ US |
| 1977 | 5 594 295 443 $ US | 6 049 699 134 $ US |
| 1976 | 4 891 100 796 $ US | 4 710 653 835 $ US |
| 1975 | 4 943 349 020 $ US | 4 251 090 592 $ US |
| 1974 | 5 759 928 966 $ US | 4 151 309 151 $ US |
| 1973 | 3 968 323 794 $ US | 3 083 459 386 $ US |
| 1972 | 2 797 946 627 $ US | 2 318 300 551 $ US |
| 1971 | 2 302 600 707 $ US | 2 033 167 880 $ US |
| 1970 | 1 954 344 491 $ US | 1 817 051 597 $ US |
En 2025, les importations de biens et services du Portugal s'élevaient à 148 milliards de dollars et celles de l'Irlande à 721 milliards de dollars : celles de l'Irlande étaient 4,9 fois plus élevées. En 1970, les importations du Portugal étaient supérieures de 7,6 % : 1,95 milliard de dollars pour le Portugal et 1,82 milliard de dollars pour l'Irlande.
Les importations de biens et services de l'Irlande sont supérieures à celles du Portugal chaque année depuis 1994.
Portugal vs Irlande : chiffres des importations
|
Portugal
|
Irlande
|
|
|---|---|---|
| Importations | 148 Md $US (2025) | 721 Md $US (2025) |
| Rang mondial | 40/174 | 15/174 |
| Part mondiale | 0,44 % | 2,14 % |
| % du PIB | 42,7 % | 99,9 % |
| Première catégorie de biens | Machines, électronique et véhicules (34 %, 2025) | Machines, électronique et véhicules (45,5 %, 2025) |
| Première origine des biens | Espagne (32,8 %, 2025) | États-Unis (15,7 %, 2025) |
Comparer les importations de 2 pays au choix
Sources :
- Banque mondiale | Économie et croissance (1970–2025, mis à jour en octobre 2026)
- TradeMap (2001–2025, mis à jour en octobre 2026)
Creative Commons Attribution (CC BY) : vous pouvez copier, partager, adapter et réutiliser ce contenu, y compris à des fins commerciales, à condition de citer statistics.wiki et d’indiquer les modifications apportées. Les sources citées ci-dessus peuvent avoir leurs propres conditions de licence.