
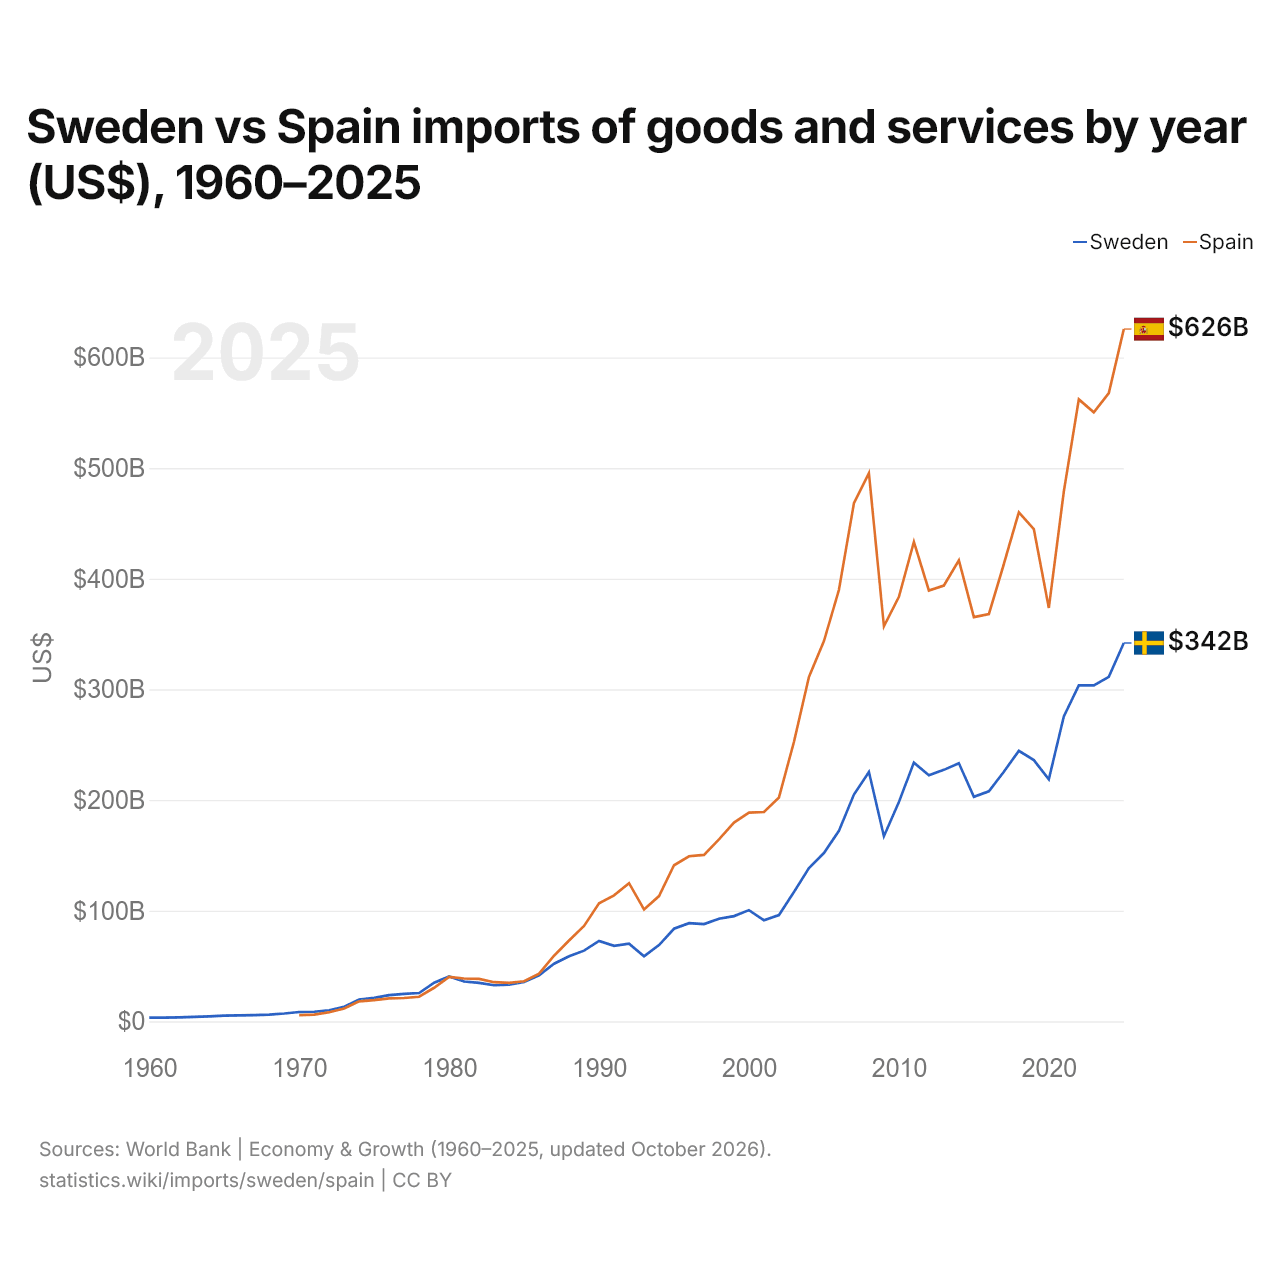
Suède vs Espagne : importations de biens et services par année ($ US), 1960–2025
| Année | $ US | |
|---|---|---|
 Suède |
 Espagne |
|
| 2025 | 341 902 516 919 $ US | 625 571 094 599 $ US |
| 2024 | 311 306 792 242 $ US | 567 649 024 934 $ US |
| 2023 | 303 529 221 657 $ US | 550 315 993 016 $ US |
| 2022 | 303 635 821 943 $ US | 562 067 869 749 $ US |
| 2021 | 275 582 535 325 $ US | 478 813 490 690 $ US |
| 2020 | 218 725 234 276 $ US | 373 587 218 923 $ US |
| 2019 | 236 048 697 363 $ US | 444 777 298 016 $ US |
| 2018 | 244 417 315 964 $ US | 460 052 638 839 $ US |
| 2017 | 225 583 506 107 $ US | 413 273 524 151 $ US |
| 2016 | 207 862 500 839 $ US | 368 077 385 210 $ US |
| 2015 | 202 956 408 286 $ US | 365 267 176 774 $ US |
| 2014 | 233 195 472 530 $ US | 416 556 734 925 $ US |
| 2013 | 227 247 994 887 $ US | 393 853 404 529 $ US |
| 2012 | 222 449 369 430 $ US | 389 373 194 053 $ US |
| 2011 | 233 787 459 646 $ US | 433 230 760 963 $ US |
| 2010 | 198 157 087 923 $ US | 383 637 214 717 $ US |
| 2009 | 167 206 485 667 $ US | 356 955 506 971 $ US |
| 2008 | 225 371 485 791 $ US | 495 421 038 137 $ US |
| 2007 | 204 952 210 452 $ US | 468 185 448 713 $ US |
| 2006 | 172 103 900 680 $ US | 389 916 169 856 $ US |
| 2005 | 152 117 327 481 $ US | 343 612 756 868 $ US |
| 2004 | 138 501 544 449 $ US | 311 226 847 419 $ US |
| 2003 | 116 899 076 215 $ US | 252 597 164 852 $ US |
| 2002 | 96 049 747 872 $ US | 202 315 899 880 $ US |
| 2001 | 91 348 132 945 $ US | 189 199 946 438 $ US |
| 2000 | 100 499 443 365 $ US | 188 597 988 060 $ US |
| 1999 | 95 109 169 249 $ US | 179 579 068 361 $ US |
| 1998 | 92 655 630 888 $ US | 164 461 521 328 $ US |
| 1997 | 87 887 333 167 $ US | 150 448 863 636 $ US |
| 1996 | 88 694 154 489 $ US | 149 160 646 263 $ US |
| 1995 | 83 696 886 434 $ US | 141 040 832 666 $ US |
| 1994 | 68 924 572 317 $ US | 113 185 677 556 $ US |
| 1993 | 58 755 042 783 $ US | 101 028 880 899 $ US |
| 1992 | 70 211 547 443 $ US | 124 858 948 480 $ US |
| 1991 | 68 211 777 594 $ US | 113 803 519 616 $ US |
| 1990 | 72 704 404 947 $ US | 106 698 684 296 $ US |
| 1989 | 63 887 689 897 $ US | 86 193 191 848 $ US |
| 1988 | 58 782 877 823 $ US | 73 014 657 906 $ US |
| 1987 | 52 071 738 849 $ US | 59 270 990 433 $ US |
| 1986 | 41 574 831 686 $ US | 43 101 197 576 $ US |
| 1985 | 35 584 567 928 $ US | 36 161 758 317 $ US |
| 1984 | 33 130 075 921 $ US | 34 830 495 757 $ US |
| 1983 | 32 645 095 929 $ US | 35 374 945 476 $ US |
| 1982 | 34 770 640 977 $ US | 38 319 582 008 $ US |
| 1981 | 36 020 657 858 $ US | 38 729 324 203 $ US |
| 1980 | 40 613 126 300 $ US | 40 198 018 102 $ US |
| 1979 | 34 937 462 154 $ US | 30 326 926 128 $ US |
| 1978 | 25 608 957 619 $ US | 22 235 898 438 $ US |
| 1977 | 24 746 102 062 $ US | 21 074 790 800 $ US |
| 1976 | 23 627 331 206 $ US | 20 751 158 916 $ US |
| 1975 | 21 182 621 020 $ US | 19 179 240 580 $ US |
| 1974 | 19 623 805 920 $ US | 18 006 071 532 $ US |
| 1973 | 13 198 116 685 $ US | 11 627 215 877 $ US |
| 1972 | 10 009 365 236 $ US | 8 184 827 854 $ US |
| 1971 | 8 687 795 704 $ US | 6 004 950 898 $ US |
| 1970 | 8 470 278 358 $ US | 5 612 265 272 $ US |
| 1969 | 7 096 025 481 $ US | - |
| 1968 | 6 121 510 458 $ US | - |
| 1967 | 5 610 432 438 $ US | - |
| 1966 | 5 401 663 227 $ US | - |
| 1965 | 5 103 033 951 $ US | - |
| 1964 | 4 503 064 316 $ US | - |
| 1963 | 3 969 327 638 $ US | - |
| 1962 | 3 645 522 311 $ US | - |
| 1961 | 3 408 478 200 $ US | - |
| 1960 | 3 384 851 091 $ US | - |
En 2025, les importations de biens et services de la Suède s'élevaient à 342 milliards de dollars et celles de l'Espagne à 626 milliards de dollars : celles de l'Espagne étaient 1,8 fois plus élevées. En 1970, les importations de la Suède étaient 1,5 fois plus élevées : 8,47 milliards de dollars pour la Suède et 5,61 milliards de dollars pour l'Espagne.
Les importations de biens et services de l'Espagne sont supérieures à celles de la Suède chaque année depuis 1981.
Suède vs Espagne : chiffres des importations
|
Suède
|
Espagne
|
|
|---|---|---|
| Importations | 342 Md $US (2025) | 626 Md $US (2025) |
| Rang mondial | 28/174 | 16/174 |
| Part mondiale | 1,01 % | 1,85 % |
| % du PIB | 51,1 % | 32,8 % |
| Première catégorie de biens | Machines, électronique et véhicules (40,3 %, 2025) | Machines, électronique et véhicules (32,8 %, 2025) |
| Première origine des biens | Allemagne (15,9 %, 2025) | Chine (11,1 %, 2025) |
Comparer les importations de 2 pays au choix
Sources :
- Banque mondiale | Économie et croissance (1960–2025, mis à jour en octobre 2026)
- TradeMap (2001–2025, mis à jour en octobre 2026)
Creative Commons Attribution (CC BY) : vous pouvez copier, partager, adapter et réutiliser ce contenu, y compris à des fins commerciales, à condition de citer statistics.wiki et d’indiquer les modifications apportées. Les sources citées ci-dessus peuvent avoir leurs propres conditions de licence.