
Royaume-Uni vs Belgique : importations de biens et services par année ($ US), 1970–2025
| Année | $ US | |
|---|---|---|
 Royaume-Uni |
 Belgique |
|
| 2025 | 1 275 239 250 328 $ US | 562 002 311 236 $ US |
| 2024 | 1 174 549 941 083 $ US | 534 805 055 514 $ US |
| 2023 | 1 131 603 446 868 $ US | 541 280 155 477 $ US |
| 2022 | 1 117 793 765 633 $ US | 571 920 929 941 $ US |
| 2021 | 934 375 952 194 $ US | 525 242 552 932 $ US |
| 2020 | 795 714 534 395 $ US | 411 854 672 040 $ US |
| 2019 | 951 880 342 949 $ US | 442 788 775 444 $ US |
| 2018 | 957 619 509 260 $ US | 460 128 692 310 $ US |
| 2017 | 869 550 502 969 $ US | 418 056 820 188 $ US |
| 2016 | 833 100 578 280 $ US | 376 759 269 085 $ US |
| 2015 | 861 463 440 127 $ US | 355 884 802 917 $ US |
| 2014 | 934 525 774 097 $ US | 425 952 025 321 $ US |
| 2013 | 881 359 614 350 $ US | 412 266 300 213 $ US |
| 2012 | 855 876 434 983 $ US | 400 397 837 168 $ US |
| 2011 | 857 771 146 098 $ US | 424 362 474 851 $ US |
| 2010 | 756 632 614 065 $ US | 357 961 529 747 $ US |
| 2009 | 678 917 276 834 $ US | 322 739 959 902 $ US |
| 2008 | 855 805 147 059 $ US | 414 937 621 999 $ US |
| 2007 | 848 867 547 019 $ US | 349 267 150 581 $ US |
| 2006 | 796 610 855 566 $ US | 297 060 116 701 $ US |
| 2005 | 697 472 727 273 $ US | 270 950 047 193 $ US |
| 2004 | 639 128 524 350 $ US | 243 726 488 208 $ US |
| 2003 | 537 968 979 592 $ US | 202 551 914 318 $ US |
| 2002 | 479 947 541 966 $ US | 168 605 250 992 $ US |
| 2001 | 450 228 875 774 $ US | 160 904 233 211 $ US |
| 2000 | 447 681 948 858 $ US | 165 003 474 244 $ US |
| 1999 | 427 731 758 615 $ US | 156 514 813 408 $ US |
| 1998 | 412 207 684 664 $ US | 156 499 555 457 $ US |
| 1997 | 393 672 233 137 $ US | 153 905 164 637 $ US |
| 1996 | 367 588 143 526 $ US | 161 993 745 928 $ US |
| 1995 | 339 072 116 143 $ US | 162 055 281 883 $ US |
| 1994 | 294 340 260 178 $ US | 134 214 479 142 $ US |
| 1993 | 264 458 431 314 $ US | 118 889 056 670 $ US |
| 1992 | 275 832 937 873 $ US | 132 088 996 236 $ US |
| 1991 | 259 644 733 686 $ US | 122 855 235 676 $ US |
| 1990 | 272 419 897 017 $ US | 122 899 593 192 $ US |
| 1989 | 241 323 782 723 $ US | 100 782 764 128 $ US |
| 1988 | 229 258 518 321 $ US | 92 534 612 178 $ US |
| 1987 | 188 351 657 134 $ US | 80 749 672 609 $ US |
| 1986 | 152 907 770 449 $ US | 66 063 110 890 $ US |
| 1985 | 130 952 876 027 $ US | 52 988 261 431 $ US |
| 1984 | 127 268 012 769 $ US | 53 192 322 675 $ US |
| 1983 | 121 326 941 034 $ US | 52 310 487 574 $ US |
| 1982 | 122 122 796 995 $ US | 55 093 659 721 $ US |
| 1981 | 125 119 803 055 $ US | 58 814 105 824 $ US |
| 1980 | 137 927 313 502 $ US | 67 141 114 637 $ US |
| 1979 | 118 503 699 704 $ US | 60 077 552 284 $ US |
| 1978 | 89 608 628 955 $ US | 47 131 229 666 $ US |
| 1977 | 76 156 548 055 $ US | 39 904 208 216 $ US |
| 1976 | 67 727 417 790 $ US | 34 320 538 140 $ US |
| 1975 | 65 493 940 265 $ US | 29 954 319 403 $ US |
| 1974 | 65 219 086 022 $ US | 29 348 848 384 $ US |
| 1973 | 47 681 185 693 $ US | 22 015 693 438 $ US |
| 1972 | 35 239 697 802 $ US | 15 284 572 450 $ US |
| 1971 | 30 409 471 891 $ US | 12 470 410 328 $ US |
| 1970 | 27 400 376 770 $ US | 11 422 513 917 $ US |
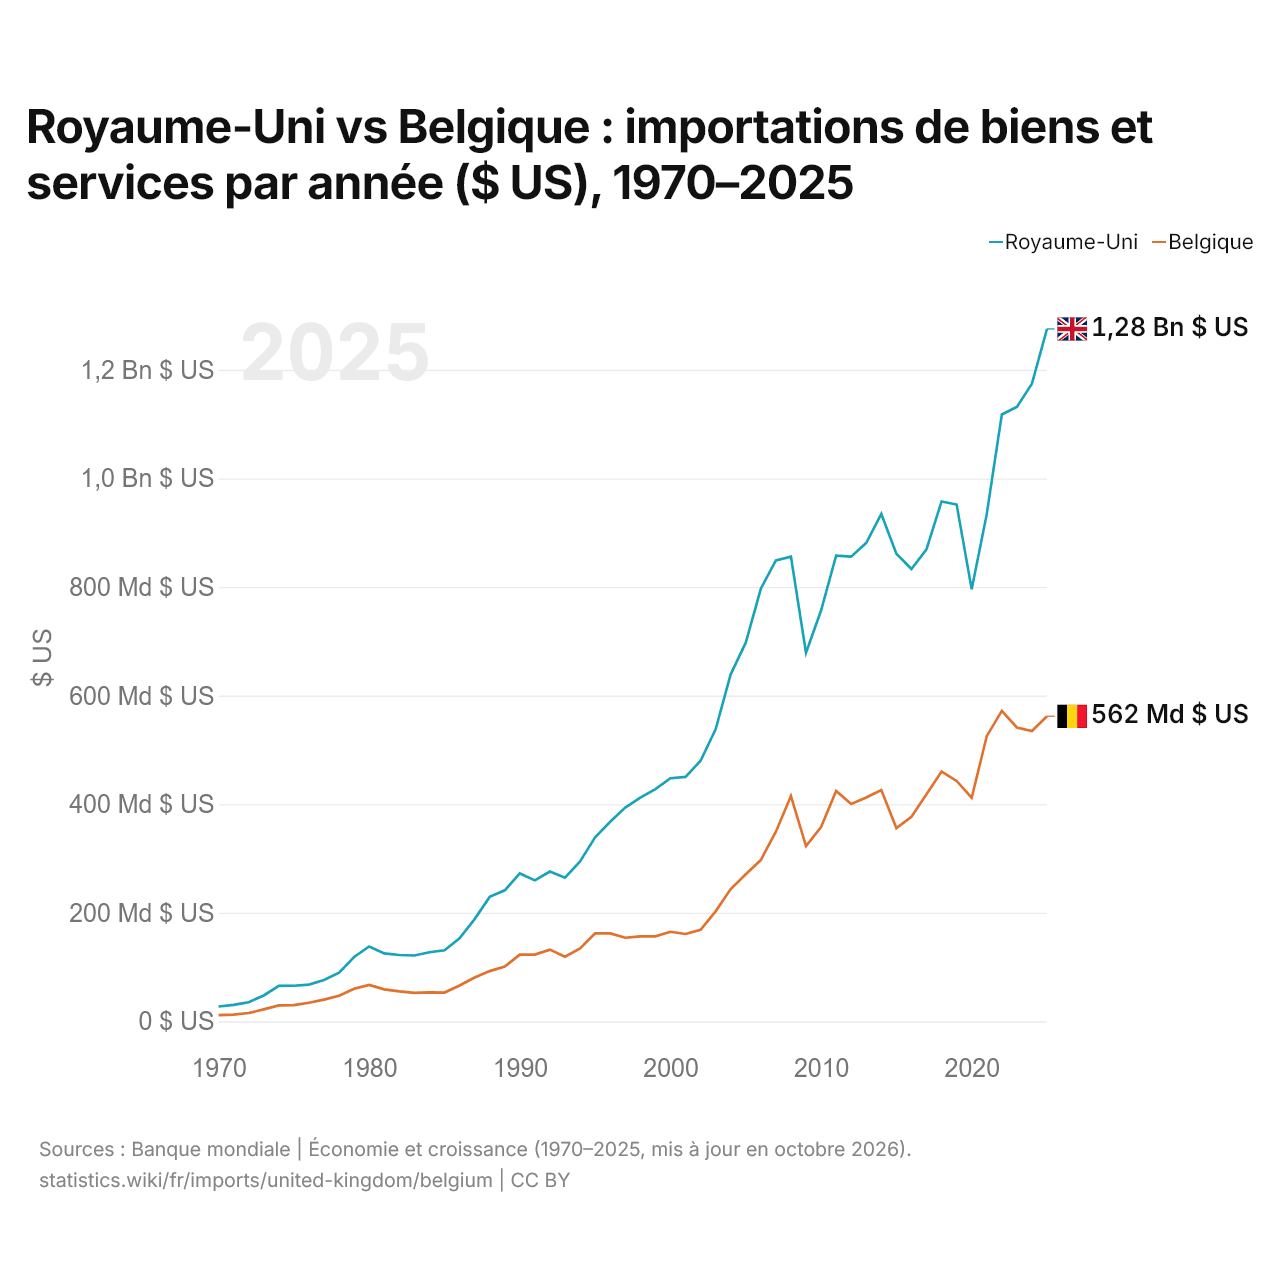
En 2025, les importations de biens et services du Royaume-Uni s'élevaient à 1,28 billion de dollars et celles de la Belgique à 562 milliards de dollars : celles du Royaume-Uni étaient 2,3 fois plus élevées. En 1970, les importations du Royaume-Uni étaient 2,4 fois plus élevées : 27,4 milliards de dollars pour le Royaume-Uni et 11,4 milliards de dollars pour la Belgique.
Les importations de biens et services du Royaume-Uni sont supérieures à celles de la Belgique chaque année depuis 1970.
Royaume-Uni vs Belgique : chiffres des importations
|
Royaume-Uni
|
Belgique
|
|
|---|---|---|
| Importations | 1,28 Bn $US (2025) | 562 Md $US (2025) |
| Rang mondial | 4/174 | 17/174 |
| Part mondiale | 3,78 % | 1,67 % |
| % du PIB | 31,9 % | 77,5 % |
| Première catégorie de biens | Machines, électronique et véhicules (34,4 %, 2025) | Machines, électronique et véhicules (28,2 %, 2025) |
| Première origine des biens | États-Unis (11,8 %, 2025) | Pays-Bas (19,9 %, 2025) |
Comparer les importations de 2 pays au choix
Sources :
- Banque mondiale | Économie et croissance (1970–2025, mis à jour en octobre 2026)
- TradeMap (2001–2025, mis à jour en octobre 2026)
Creative Commons Attribution (CC BY) : vous pouvez copier, partager, adapter et réutiliser ce contenu, y compris à des fins commerciales, à condition de citer statistics.wiki et d’indiquer les modifications apportées. Les sources citées ci-dessus peuvent avoir leurs propres conditions de licence.