
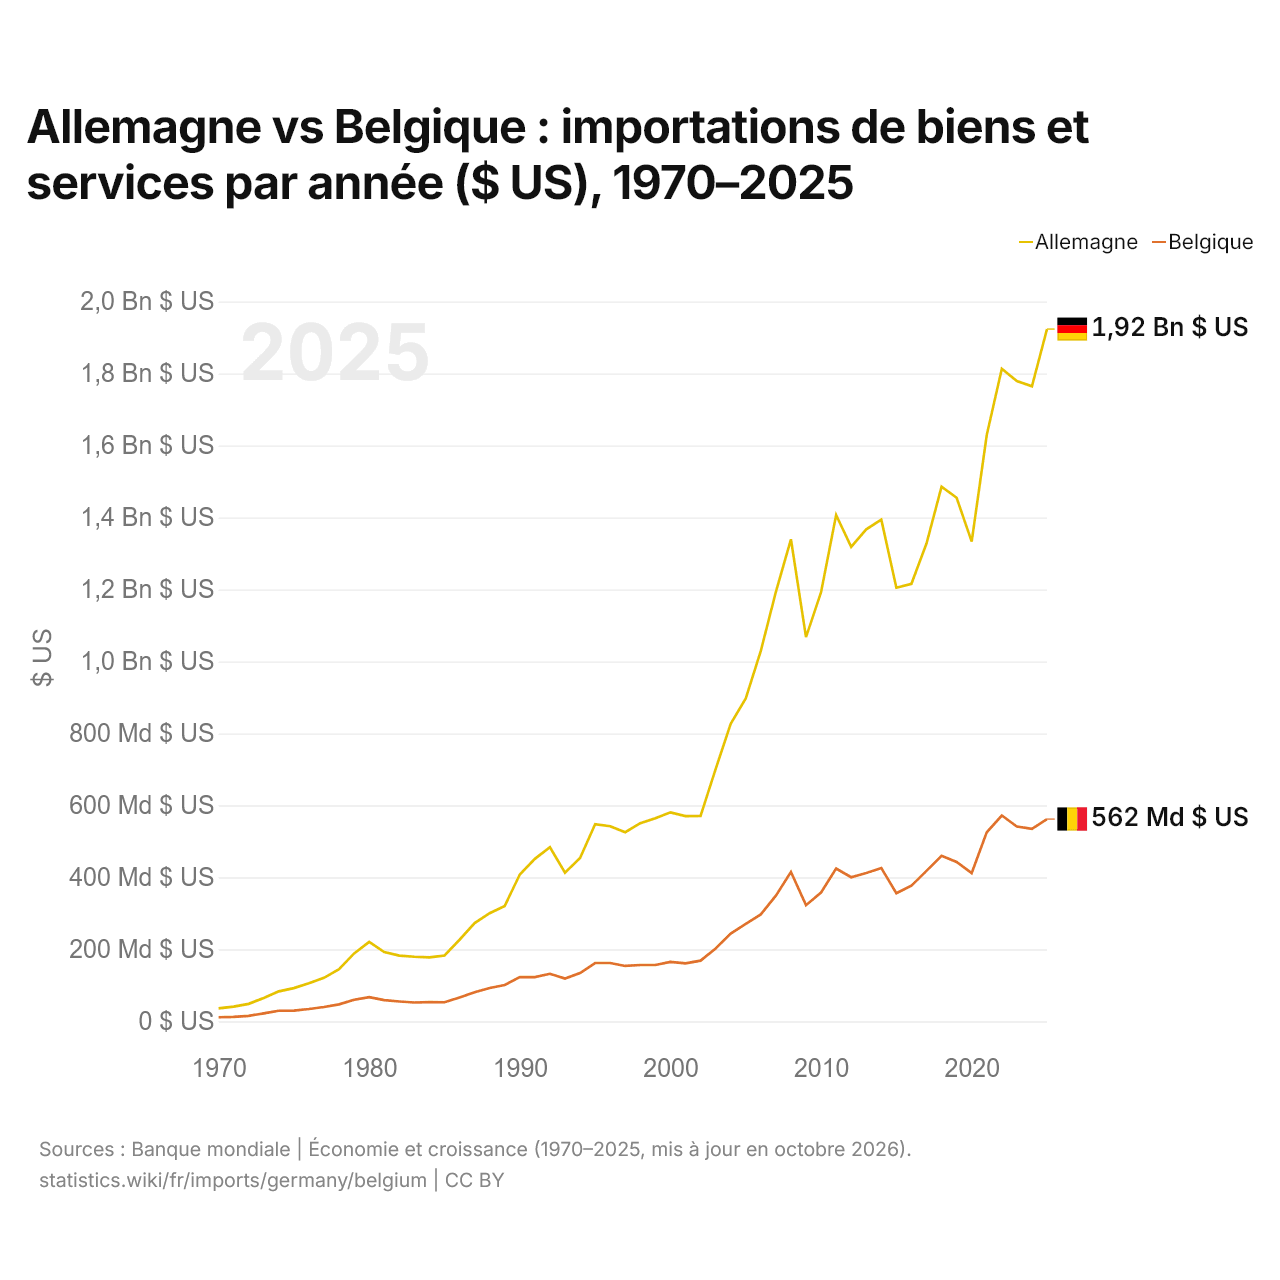
Allemagne vs Belgique : importations de biens et services par année ($ US), 1970–2025
| Année | $ US | |
|---|---|---|
 Allemagne |
 Belgique |
|
| 2025 | 1 923 292 318 697 $ US | 562 002 311 236 $ US |
| 2024 | 1 764 438 191 611 $ US | 534 805 055 514 $ US |
| 2023 | 1 779 045 873 341 $ US | 541 280 155 477 $ US |
| 2022 | 1 813 049 636 002 $ US | 571 920 929 941 $ US |
| 2021 | 1 628 851 031 194 $ US | 525 242 552 932 $ US |
| 2020 | 1 332 733 837 256 $ US | 411 854 672 040 $ US |
| 2019 | 1 454 588 084 839 $ US | 442 788 775 444 $ US |
| 2018 | 1 485 437 649 158 $ US | 460 128 692 310 $ US |
| 2017 | 1 327 357 307 454 $ US | 418 056 820 188 $ US |
| 2016 | 1 215 609 853 746 $ US | 376 759 269 085 $ US |
| 2015 | 1 204 648 073 432 $ US | 355 884 802 917 $ US |
| 2014 | 1 393 837 781 387 $ US | 425 952 025 321 $ US |
| 2013 | 1 366 940 257 620 $ US | 412 266 300 213 $ US |
| 2012 | 1 317 969 624 115 $ US | 400 397 837 168 $ US |
| 2011 | 1 406 669 611 897 $ US | 424 362 474 851 $ US |
| 2010 | 1 192 329 684 250 $ US | 357 961 529 747 $ US |
| 2009 | 1 067 378 170 076 $ US | 322 739 959 902 $ US |
| 2008 | 1 339 125 795 808 $ US | 414 937 621 999 $ US |
| 2007 | 1 193 186 147 673 $ US | 349 267 150 581 $ US |
| 2006 | 1 029 339 915 529 $ US | 297 060 116 701 $ US |
| 2005 | 896 950 519 583 $ US | 270 950 047 193 $ US |
| 2004 | 826 352 918 672 $ US | 243 726 488 208 $ US |
| 2003 | 700 765 174 545 $ US | 202 551 914 318 $ US |
| 2002 | 570 622 539 400 $ US | 168 605 250 992 $ US |
| 2001 | 570 228 511 977 $ US | 160 904 233 211 $ US |
| 2000 | 580 553 292 712 $ US | 165 003 474 244 $ US |
| 1999 | 564 301 984 739 $ US | 156 514 813 408 $ US |
| 1998 | 550 595 754 140 $ US | 156 499 555 457 $ US |
| 1997 | 525 385 743 289 $ US | 153 905 164 637 $ US |
| 1996 | 541 957 369 379 $ US | 161 993 745 928 $ US |
| 1995 | 547 772 621 810 $ US | 162 055 281 883 $ US |
| 1994 | 453 912 257 442 $ US | 134 214 479 142 $ US |
| 1993 | 413 095 942 269 $ US | 118 889 056 670 $ US |
| 1992 | 483 833 437 696 $ US | 132 088 996 236 $ US |
| 1991 | 451 492 044 785 $ US | 122 855 235 676 $ US |
| 1990 | 408 062 314 490 $ US | 122 899 593 192 $ US |
| 1989 | 320 659 348 799 $ US | 100 782 764 128 $ US |
| 1988 | 300 437 976 389 $ US | 92 534 612 178 $ US |
| 1987 | 272 758 220 892 $ US | 80 749 672 609 $ US |
| 1986 | 226 641 451 860 $ US | 66 063 110 890 $ US |
| 1985 | 182 999 144 300 $ US | 52 988 261 431 $ US |
| 1984 | 177 813 724 143 $ US | 53 192 322 675 $ US |
| 1983 | 179 485 369 590 $ US | 52 310 487 574 $ US |
| 1982 | 182 672 746 836 $ US | 55 093 659 721 $ US |
| 1981 | 192 540 531 372 $ US | 58 814 105 824 $ US |
| 1980 | 220 826 310 523 $ US | 67 141 114 637 $ US |
| 1979 | 188 647 315 121 $ US | 60 077 552 284 $ US |
| 1978 | 144 746 943 525 $ US | 47 131 229 666 $ US |
| 1977 | 120 869 841 658 $ US | 39 904 208 216 $ US |
| 1976 | 105 524 313 345 $ US | 34 320 538 140 $ US |
| 1975 | 92 240 550 918 $ US | 29 954 319 403 $ US |
| 1974 | 83 360 334 820 $ US | 29 348 848 384 $ US |
| 1973 | 65 139 754 848 $ US | 22 015 693 438 $ US |
| 1972 | 48 517 046 556 $ US | 15 284 572 450 $ US |
| 1971 | 40 715 115 151 $ US | 12 470 410 328 $ US |
| 1970 | 35 798 334 313 $ US | 11 422 513 917 $ US |
En 2025, les importations de biens et services de l'Allemagne s'élevaient à 1,92 billion de dollars et celles de la Belgique à 562 milliards de dollars : celles de l'Allemagne étaient 3,4 fois plus élevées. En 1970, les importations de l'Allemagne étaient 3,1 fois plus élevées : 35,8 milliards de dollars pour l'Allemagne et 11,4 milliards de dollars pour la Belgique.
Les importations de biens et services de l'Allemagne sont supérieures à celles de la Belgique chaque année depuis 1970.
Allemagne vs Belgique : chiffres des importations
|
Allemagne
|
Belgique
|
|
|---|---|---|
| Importations | 1,92 Bn $US (2025) | 562 Md $US (2025) |
| Rang mondial | 3/174 | 17/174 |
| Part mondiale | 5,7 % | 1,67 % |
| % du PIB | 38,1 % | 77,5 % |
| Première catégorie de biens | Machines, électronique et véhicules (42,1 %, 2025) | Machines, électronique et véhicules (28,2 %, 2025) |
| Première origine des biens | Chine (12,6 %, 2025) | Pays-Bas (19,9 %, 2025) |
Comparer les importations de 2 pays au choix
Sources :
- Banque mondiale | Économie et croissance (1970–2025, mis à jour en octobre 2026)
- TradeMap (2001–2025, mis à jour en octobre 2026)
Creative Commons Attribution (CC BY) : vous pouvez copier, partager, adapter et réutiliser ce contenu, y compris à des fins commerciales, à condition de citer statistics.wiki et d’indiquer les modifications apportées. Les sources citées ci-dessus peuvent avoir leurs propres conditions de licence.