
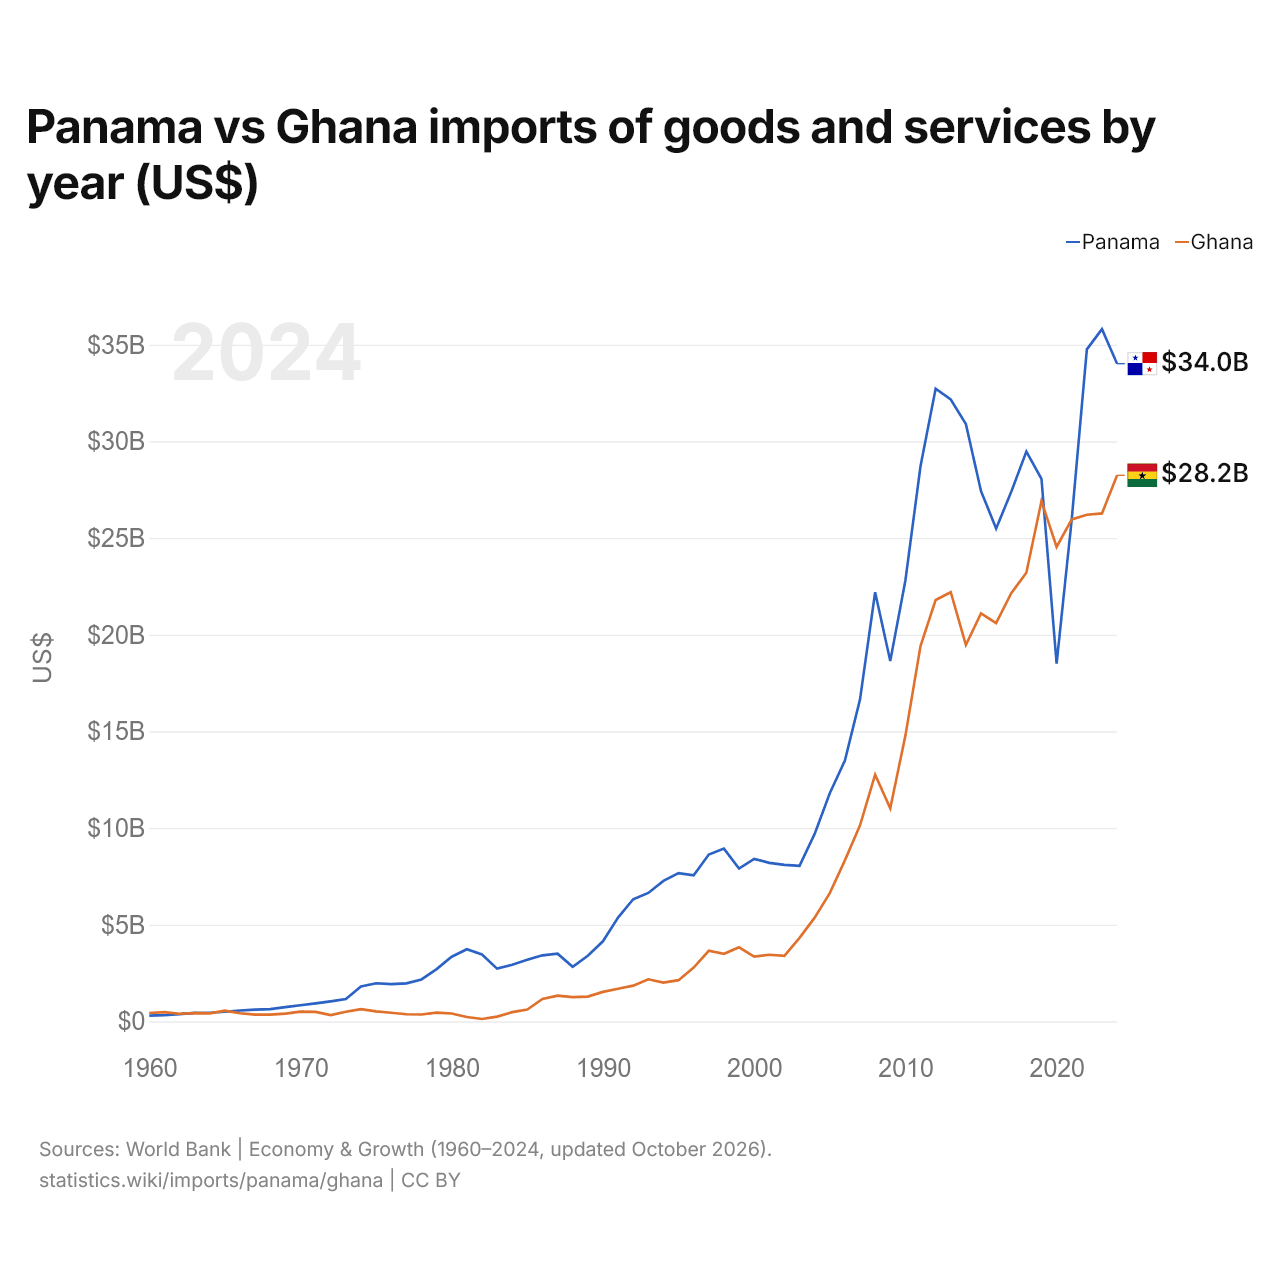
Panama vs Ghana : importations de biens et services par année ($ US)
| Année | $ US | |
|---|---|---|
 Panama |
 Ghana |
|
| 2024 | 34 017 704 900 $ US | 28 244 066 026 $ US |
| 2023 | 35 804 273 200 $ US | 26 272 099 172 $ US |
| 2022 | 34 758 827 500 $ US | 26 205 330 554 $ US |
| 2021 | 25 965 646 100 $ US | 25 963 543 827 $ US |
| 2020 | 18 505 270 200 $ US | 24 537 944 240 $ US |
| 2019 | 28 061 255 700 $ US | 26 913 986 432 $ US |
| 2018 | 29 473 747 500 $ US | 23 206 913 262 $ US |
| 2017 | 27 388 495 500 $ US | 22 144 229 691 $ US |
| 2016 | 25 491 123 600 $ US | 20 595 796 191 $ US |
| 2015 | 27 433 598 900 $ US | 21 104 358 074 $ US |
| 2014 | 30 898 187 800 $ US | 19 468 106 209 $ US |
| 2013 | 32 165 330 900 $ US | 22 196 190 510 $ US |
| 2012 | 32 720 763 400 $ US | 21 795 097 067 $ US |
| 2011 | 28 715 326 100 $ US | 19 416 125 146 $ US |
| 2010 | 22 801 278 400 $ US | 14 779 077 374 $ US |
| 2009 | 18 642 684 400 $ US | 11 019 356 825 $ US |
| 2008 | 22 194 340 800 $ US | 12 757 957 188 $ US |
| 2007 | 16 654 324 300 $ US | 10 136 811 817 $ US |
| 2006 | 13 486 936 400 $ US | 8 325 374 082 $ US |
| 2005 | 11 798 912 400 $ US | 6 631 794 425 $ US |
| 2004 | 9 692 055 300 $ US | 5 361 446 367 $ US |
| 2003 | 8 044 255 200 $ US | 4 320 740 017 $ US |
| 2002 | 8 089 552 400 $ US | 3 383 577 207 $ US |
| 2001 | 8 195 266 400 $ US | 3 444 719 917 $ US |
| 2000 | 8 405 006 400 $ US | 3 350 776 354 $ US |
| 1999 | 7 902 775 100 $ US | 3 830 248 310 $ US |
| 1998 | 8 934 147 100 $ US | 3 496 235 606 $ US |
| 1997 | 8 629 854 000 $ US | 3 651 882 361 $ US |
| 1996 | 7 558 309 100 $ US | 2 779 627 875 $ US |
| 1995 | 7 664 630 500 $ US | 2 128 504 595 $ US |
| 1994 | 7 264 372 200 $ US | 2 002 227 733 $ US |
| 1993 | 6 641 440 500 $ US | 2 173 595 289 $ US |
| 1992 | 6 315 044 100 $ US | 1 845 761 703 $ US |
| 1991 | 5 369 275 600 $ US | 1 685 450 045 $ US |
| 1990 | 4 137 057 400 $ US | 1 522 350 993 $ US |
| 1989 | 3 393 593 400 $ US | 1 278 473 226 $ US |
| 1988 | 2 824 846 900 $ US | 1 250 692 247 $ US |
| 1987 | 3 497 613 100 $ US | 1 328 870 748 $ US |
| 1986 | 3 413 764 500 $ US | 1 154 912 517 $ US |
| 1985 | 3 180 313 400 $ US | 612 106 092 $ US |
| 1984 | 2 929 064 300 $ US | 475 228 311 $ US |
| 1983 | 2 724 782 300 $ US | 242 989 418 $ US |
| 1982 | 3 460 434 900 $ US | 120 354 809 $ US |
| 1981 | 3 730 569 700 $ US | 224 767 442 $ US |
| 1980 | 3 343 857 700 $ US | 406 950 207 $ US |
| 1979 | 2 701 126 300 $ US | 448 717 949 $ US |
| 1978 | 2 167 125 500 $ US | 354 799 302 $ US |
| 1977 | 1 963 649 700 $ US | 368 285 714 $ US |
| 1976 | 1 920 906 000 $ US | 443 644 068 $ US |
| 1975 | 1 968 574 100 $ US | 518 085 106 $ US |
| 1974 | 1 806 463 200 $ US | 631 055 901 $ US |
| 1973 | 1 152 110 300 $ US | 492 968 900 $ US |
| 1972 | 1 030 379 300 $ US | 321 158 623 $ US |
| 1971 | 925 391 300 $ US | 489 222 776 $ US |
| 1970 | 832 024 900 $ US | 503 014 460 $ US |
| 1969 | 731 327 800 $ US | 399 077 749 $ US |
| 1968 | 630 826 500 $ US | 347 109 394 $ US |
| 1967 | 603 791 100 $ US | 348 508 174 $ US |
| 1966 | 560 299 300 $ US | 417 416 074 $ US |
| 1965 | 496 433 000 $ US | 549 084 232 $ US |
| 1964 | 441 970 400 $ US | 413 213 899 $ US |
| 1963 | 434 329 900 $ US | 423 018 974 $ US |
| 1962 | 372 814 600 $ US | 393 603 748 $ US |
| 1961 | 321 486 400 $ US | 474 845 802 $ US |
| 1960 | 292 100 100 $ US | 431 423 325 $ US |
Les importations de biens et services du Panama s'élèvent à 34 milliards de dollars (2024) et celles du Ghana à 28,2 milliards de dollars (2024) : celles du Panama sont supérieures de 20 %. En 1960, les importations du Ghana étaient supérieures de 48 % : 292 millions de dollars pour le Panama et 431 millions de dollars pour le Ghana.
Les importations de biens et services du Panama sont supérieures à celles du Ghana chaque année depuis 2022.
Panama vs Ghana : chiffres des importations
|
Panama
|
Ghana
|
|
|---|---|---|
| Importations | 34,0 Md $US (2024) | 28,2 Md $US (2024) |
| Rang mondial | 77/174 | 84/174 |
| Part mondiale | 0,11 % | 0,09 % |
| % du PIB | 39,3 % | 33,9 % |
| Première catégorie de biens | Machines, électronique et véhicules (30,2 %, 2025) | Pétrole, gaz, minerais et autres matières premières (31,8 %, 2025) |
| Première origine des biens | Chine (26,9 %, 2025) | Chine (22,7 %, 2025) |
Comparer les importations de 2 pays au choix
Sources :
- Banque mondiale | Économie et croissance (1960–2024, mis à jour en octobre 2026)
- TradeMap (2001–2025, mis à jour en octobre 2026)
Creative Commons Attribution (CC BY) : vous pouvez copier, partager, adapter et réutiliser ce contenu, y compris à des fins commerciales, à condition de citer statistics.wiki et d’indiquer les modifications apportées. Les sources citées ci-dessus peuvent avoir leurs propres conditions de licence.