
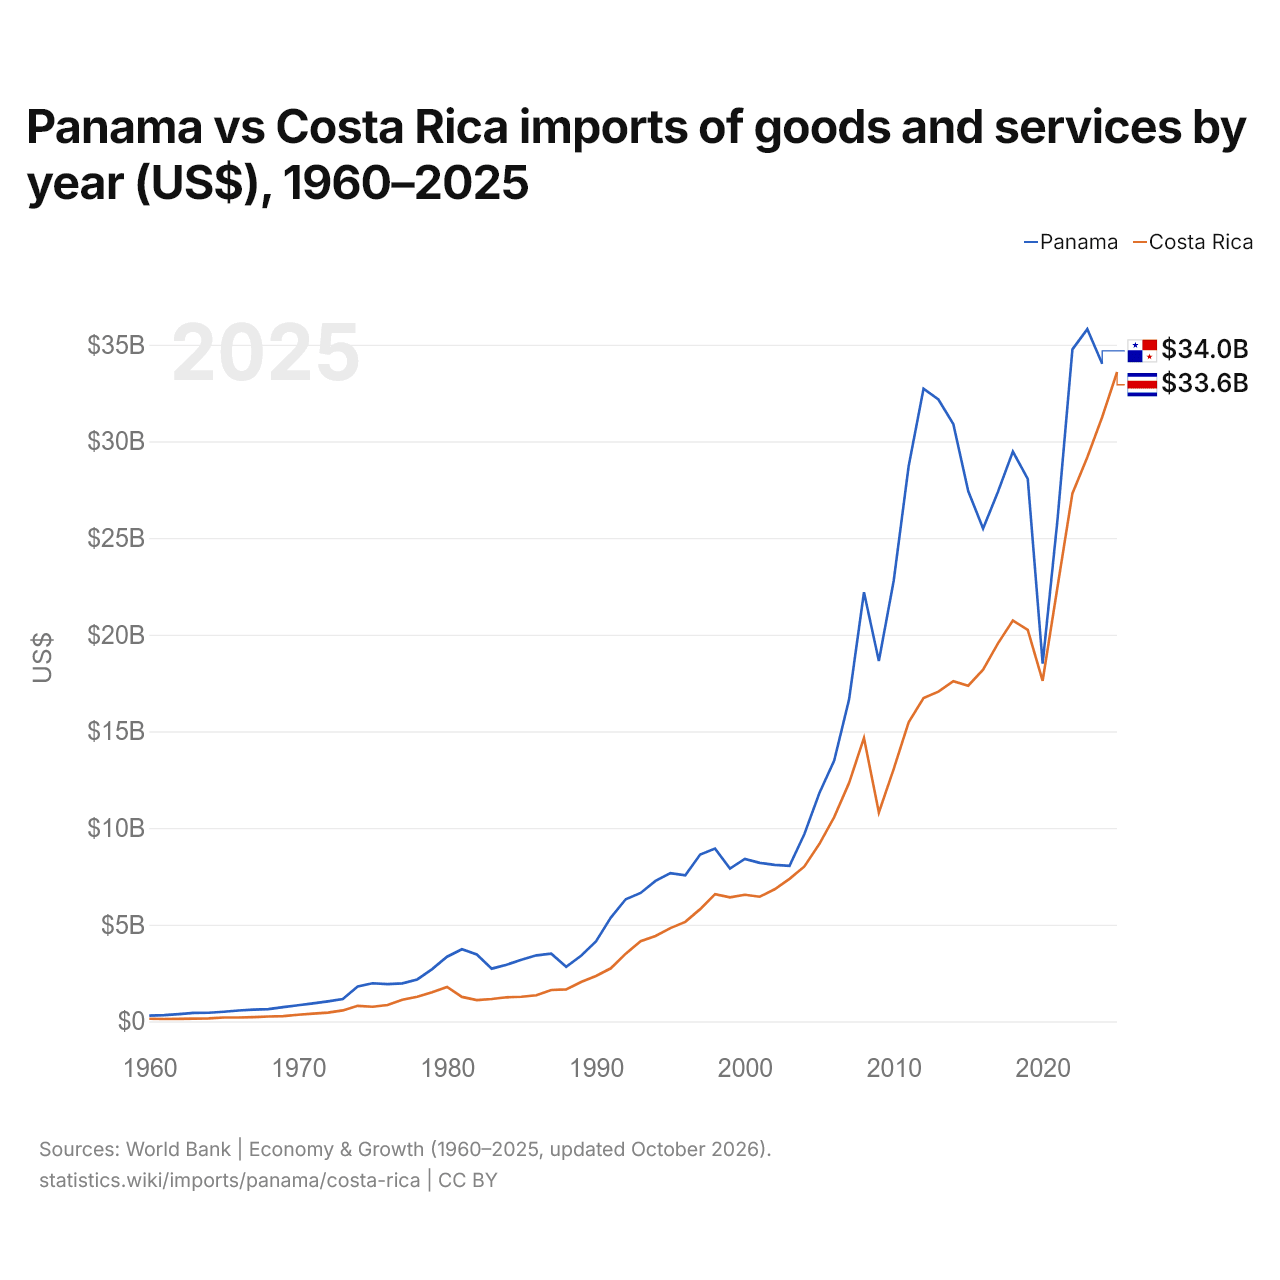
Panama vs Costa Rica : importations de biens et services par année ($ US), 1960–2025
| Année | $ US | |
|---|---|---|
 Panama |
 Costa Rica |
|
| 2025 | - | 33 590 223 066 $ US |
| 2024 | 34 017 704 900 $ US | 31 261 918 867 $ US |
| 2023 | 35 804 273 200 $ US | 29 178 710 518 $ US |
| 2022 | 34 758 827 500 $ US | 27 309 613 389 $ US |
| 2021 | 25 965 646 100 $ US | 22 479 844 381 $ US |
| 2020 | 18 505 270 200 $ US | 17 616 395 175 $ US |
| 2019 | 28 061 255 700 $ US | 20 249 829 099 $ US |
| 2018 | 29 473 747 500 $ US | 20 727 758 739 $ US |
| 2017 | 27 388 495 500 $ US | 19 552 292 618 $ US |
| 2016 | 25 491 123 600 $ US | 18 194 546 421 $ US |
| 2015 | 27 433 598 900 $ US | 17 360 351 936 $ US |
| 2014 | 30 898 187 800 $ US | 17 596 280 747 $ US |
| 2013 | 32 165 330 900 $ US | 17 055 280 057 $ US |
| 2012 | 32 720 763 400 $ US | 16 718 693 890 $ US |
| 2011 | 28 715 326 100 $ US | 15 465 815 617 $ US |
| 2010 | 22 801 278 400 $ US | 13 061 016 911 $ US |
| 2009 | 18 642 684 400 $ US | 10 800 050 872 $ US |
| 2008 | 22 194 340 800 $ US | 14 660 107 004 $ US |
| 2007 | 16 654 324 300 $ US | 12 333 210 843 $ US |
| 2006 | 13 486 936 400 $ US | 10 562 844 205 $ US |
| 2005 | 11 798 912 400 $ US | 9 170 225 580 $ US |
| 2004 | 9 692 055 300 $ US | 8 011 642 043 $ US |
| 2003 | 8 044 255 200 $ US | 7 367 441 178 $ US |
| 2002 | 8 089 552 400 $ US | 6 828 718 248 $ US |
| 2001 | 8 195 266 400 $ US | 6 445 457 476 $ US |
| 2000 | 8 405 006 400 $ US | 6 545 131 899 $ US |
| 1999 | 7 902 775 100 $ US | 6 411 945 533 $ US |
| 1998 | 8 934 147 100 $ US | 6 578 730 511 $ US |
| 1997 | 8 629 854 000 $ US | 5 803 237 747 $ US |
| 1996 | 7 558 309 100 $ US | 5 143 781 715 $ US |
| 1995 | 7 664 630 500 $ US | 4 821 923 955 $ US |
| 1994 | 7 264 372 200 $ US | 4 417 576 105 $ US |
| 1993 | 6 641 440 500 $ US | 4 143 011 092 $ US |
| 1992 | 6 315 044 100 $ US | 3 501 782 363 $ US |
| 1991 | 5 369 275 600 $ US | 2 744 397 215 $ US |
| 1990 | 4 137 057 400 $ US | 2 347 212 148 $ US |
| 1989 | 3 393 593 400 $ US | 2 033 817 039 $ US |
| 1988 | 2 824 846 900 $ US | 1 652 553 107 $ US |
| 1987 | 3 497 613 100 $ US | 1 621 277 680 $ US |
| 1986 | 3 413 764 500 $ US | 1 347 578 853 $ US |
| 1985 | 3 180 313 400 $ US | 1 272 805 941 $ US |
| 1984 | 2 929 064 300 $ US | 1 243 520 405 $ US |
| 1983 | 2 724 782 300 $ US | 1 157 473 274 $ US |
| 1982 | 3 460 434 900 $ US | 1 099 079 477 $ US |
| 1981 | 3 730 569 700 $ US | 1 264 048 112 $ US |
| 1980 | 3 343 857 700 $ US | 1 778 891 482 $ US |
| 1979 | 2 701 126 300 $ US | 1 500 945 158 $ US |
| 1978 | 2 167 125 500 $ US | 1 269 463 244 $ US |
| 1977 | 1 963 649 700 $ US | 1 116 359 393 $ US |
| 1976 | 1 920 906 000 $ US | 842 240 373 $ US |
| 1975 | 1 968 574 100 $ US | 755 869 312 $ US |
| 1974 | 1 806 463 200 $ US | 801 954 603 $ US |
| 1973 | 1 152 110 300 $ US | 563 763 567 $ US |
| 1972 | 1 030 379 300 $ US | 453 262 999 $ US |
| 1971 | 925 391 300 $ US | 399 678 048 $ US |
| 1970 | 832 024 900 $ US | 340 543 396 $ US |
| 1969 | 731 327 800 $ US | 272 754 717 $ US |
| 1968 | 630 826 500 $ US | 251 154 717 $ US |
| 1967 | 603 791 100 $ US | 218 369 811 $ US |
| 1966 | 560 299 300 $ US | 199 200 000 $ US |
| 1965 | 496 433 000 $ US | 196 800 000 $ US |
| 1964 | 441 970 400 $ US | 155 005 188 $ US |
| 1963 | 434 329 900 $ US | 138 870 092 $ US |
| 1962 | 372 814 600 $ US | 124 825 191 $ US |
| 1961 | 321 486 400 $ US | 122 861 638 $ US |
| 1960 | 292 100 100 $ US | 132 338 591 $ US |
Les importations de biens et services du Panama s'élevaient à 34 milliards de dollars (2024) et celles du Costa Rica à 31,3 milliards de dollars (2024) : celles du Panama étaient supérieures de 8,8 %. En 1960, les importations du Panama étaient 2,2 fois plus élevées : 292 millions de dollars pour le Panama et 132 millions de dollars pour le Costa Rica.
Les importations de biens et services du Panama sont supérieures à celles du Costa Rica chaque année depuis 1960.
Panama vs Costa Rica : chiffres des importations
|
Panama
|
Costa Rica
|
|
|---|---|---|
| Importations | 34,0 Md $US (2024) | 33,6 Md $US (2025) |
| Rang mondial | 77/174 | 78/174 |
| Part mondiale | 0,11 % | 0,1 % |
| % du PIB | 39,3 % | 32,6 % |
| Première catégorie de biens | Machines, électronique et véhicules (30,2 %, 2025) | Machines, électronique et véhicules (33,4 %, 2025) |
| Première origine des biens | Chine (26,9 %, 2025) | États-Unis (36,8 %, 2025) |
Comparer les importations de 2 pays au choix
Sources :
- Banque mondiale | Économie et croissance (1960–2025, mis à jour en octobre 2026)
- TradeMap (2001–2025, mis à jour en octobre 2026)
Creative Commons Attribution (CC BY) : vous pouvez copier, partager, adapter et réutiliser ce contenu, y compris à des fins commerciales, à condition de citer statistics.wiki et d’indiquer les modifications apportées. Les sources citées ci-dessus peuvent avoir leurs propres conditions de licence.