
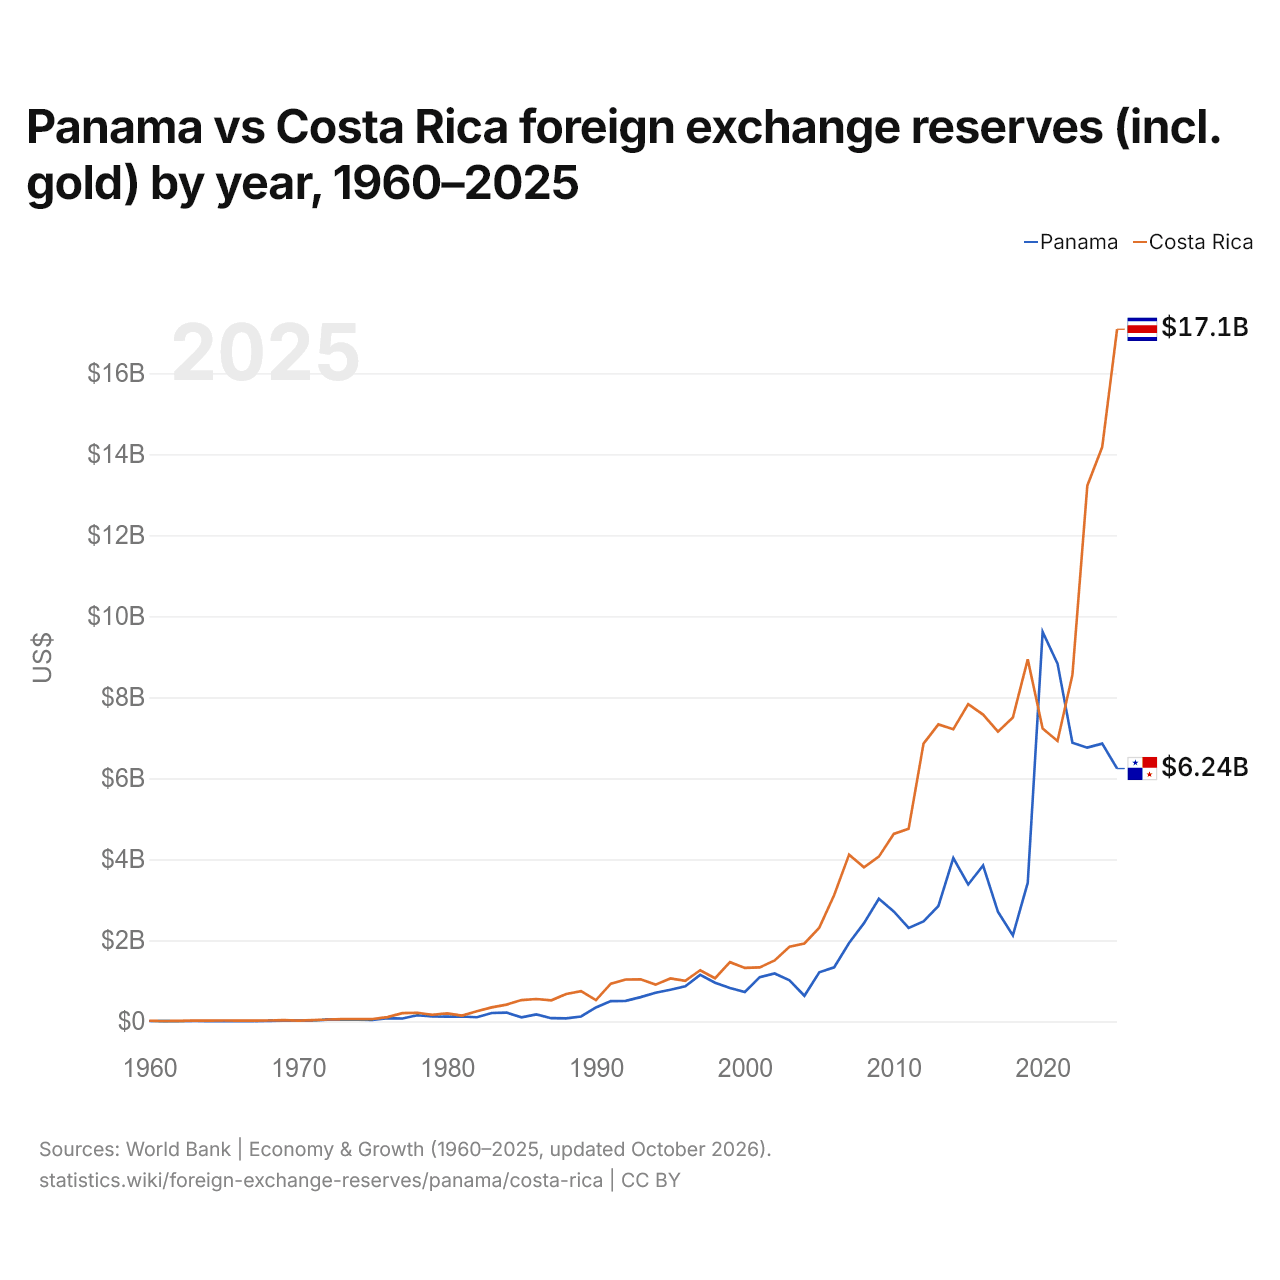
Panama vs Costa Rica : réserves de change (or compris) par année, 1960–2025
| Année | $ US | |
|---|---|---|
 Panama |
 Costa Rica |
|
| 2025 | 6 240 726 722 $ US | 17 086 422 923 $ US |
| 2024 | 6 855 505 288 $ US | 14 177 018 014 $ US |
| 2023 | 6 756 683 682 $ US | 13 225 042 447 $ US |
| 2022 | 6 876 072 134 $ US | 8 554 013 584 $ US |
| 2021 | 8 832 242 051 $ US | 6 921 168 831 $ US |
| 2020 | 9 613 847 649 $ US | 7 231 533 677 $ US |
| 2019 | 3 423 477 098 $ US | 8 937 069 411 $ US |
| 2018 | 2 121 303 718 $ US | 7 500 924 411 $ US |
| 2017 | 2 703 336 162 $ US | 7 149 834 514 $ US |
| 2016 | 3 846 753 359 $ US | 7 573 806 768 $ US |
| 2015 | 3 378 098 354 $ US | 7 833 931 555 $ US |
| 2014 | 4 032 196 741 $ US | 7 211 431 940 $ US |
| 2013 | 2 847 991 008 $ US | 7 330 880 579 $ US |
| 2012 | 2 466 273 020 $ US | 6 856 696 346 $ US |
| 2011 | 2 303 727 320 $ US | 4 755 830 028 $ US |
| 2010 | 2 714 469 856 $ US | 4 627 252 202 $ US |
| 2009 | 3 028 272 378 $ US | 4 066 199 745 $ US |
| 2008 | 2 423 782 839 $ US | 3 800 532 462 $ US |
| 2007 | 1 935 051 625 $ US | 4 115 350 419 $ US |
| 2006 | 1 334 983 348 $ US | 3 117 011 524 $ US |
| 2005 | 1 210 531 906 $ US | 2 313 689 169 $ US |
| 2004 | 630 646 277 $ US | 1 922 625 761 $ US |
| 2003 | 1 010 969 631 $ US | 1 840 008 318 $ US |
| 2002 | 1 182 833 361 $ US | 1 502 388 943 $ US |
| 2001 | 1 091 760 798 $ US | 1 330 363 591 $ US |
| 2000 | 722 595 057 $ US | 1 318 296 304 $ US |
| 1999 | 822 912 160 $ US | 1 460 959 448 $ US |
| 1998 | 954 498 535 $ US | 1 063 939 794 $ US |
| 1997 | 1 147 778 004 $ US | 1 262 391 835 $ US |
| 1996 | 866 521 776 $ US | 1 000 948 787 $ US |
| 1995 | 781 372 879 $ US | 1 059 760 042 $ US |
| 1994 | 704 267 833 $ US | 906 223 458 $ US |
| 1993 | 597 409 903 $ US | 1 037 650 453 $ US |
| 1992 | 504 386 328 $ US | 1 031 845 246 $ US |
| 1991 | 499 075 404 $ US | 930 999 963 $ US |
| 1990 | 343 513 777 $ US | 524 889 929 $ US |
| 1989 | 119 413 142 $ US | 745 844 326 $ US |
| 1988 | 72 213 457 $ US | 676 709 064 $ US |
| 1987 | 77 814 187 $ US | 519 159 165 $ US |
| 1986 | 170 173 635 $ US | 550 496 783 $ US |
| 1985 | 97 962 478 $ US | 525 326 850 $ US |
| 1984 | 215 639 208 $ US | 412 066 217 $ US |
| 1983 | 206 695 891 $ US | 344 714 207 $ US |
| 1982 | 100 969 746 $ US | 249 778 698 $ US |
| 1981 | 119 947 433 $ US | 142 904 172 $ US |
| 1980 | 117 382 779 $ US | 196 831 741 $ US |
| 1979 | 118 717 752 $ US | 163 150 482 $ US |
| 1978 | 150 418 500 $ US | 212 000 581 $ US |
| 1977 | 70 866 207 $ US | 202 573 247 $ US |
| 1976 | 78 941 524 $ US | 103 437 863 $ US |
| 1975 | 34 445 389 $ US | 57 175 042 $ US |
| 1974 | 39 316 005 $ US | 53 239 717 $ US |
| 1973 | 41 714 880 $ US | 55 175 242 $ US |
| 1972 | 43 128 033 $ US | 44 482 171 $ US |
| 1971 | 21 021 736 $ US | 29 789 084 $ US |
| 1970 | 15 750 000 $ US | 16 386 168 $ US |
| 1969 | 14 100 000 $ US | 29 156 899 $ US |
| 1968 | 11 100 000 $ US | 20 946 025 $ US |
| 1967 | 6 730 000 $ US | 18 166 899 $ US |
| 1966 | 5 930 000 $ US | 17 096 303 $ US |
| 1965 | 5 730 000 $ US | 19 822 134 $ US |
| 1964 | 5 030 000 $ US | 18 612 134 $ US |
| 1963 | 7 430 000 $ US | 15 619 751 $ US |
| 1962 | 4 730 000 $ US | 12 599 155 $ US |
| 1961 | 4 930 000 $ US | 6 263 921 $ US |
| 1960 | 7 430 000 $ US | 13 460 728 $ US |
En 2025, les réserves de change du Panama s'élevaient à 6,24 milliards de dollars et celles du Costa Rica à 17,1 milliards de dollars : celles du Costa Rica étaient 2,7 fois plus élevées. En 1960, les réserves du Costa Rica étaient 1,8 fois plus élevées : 7,43 millions de dollars pour le Panama et 13,5 millions de dollars pour le Costa Rica.
Les réserves de change du Costa Rica sont supérieures à celles du Panama chaque année depuis 2022.
Panama vs Costa Rica : réserves, or compris, et mois d'importations couverts
|
Panama
|
Costa Rica
|
|
|---|---|---|
| Réserves, or compris | 6,24 Md $US | 17,1 Md $US |
| Mois d'importations | 2,4 (2024) | 6,1 (2025) |
| Rang mondial | 92/168 | 69/168 |
| Écart des réserves | 0,37× | 2,7× |
Comparer les réserves de change de 2 pays au choix
Sources :
- Banque mondiale | Économie et croissance (1960–2025, mis à jour en octobre 2026)
Creative Commons Attribution (CC BY) : vous pouvez copier, partager, adapter et réutiliser ce contenu, y compris à des fins commerciales, à condition de citer statistics.wiki et d’indiquer les modifications apportées. Les sources citées ci-dessus peuvent avoir leurs propres conditions de licence.