
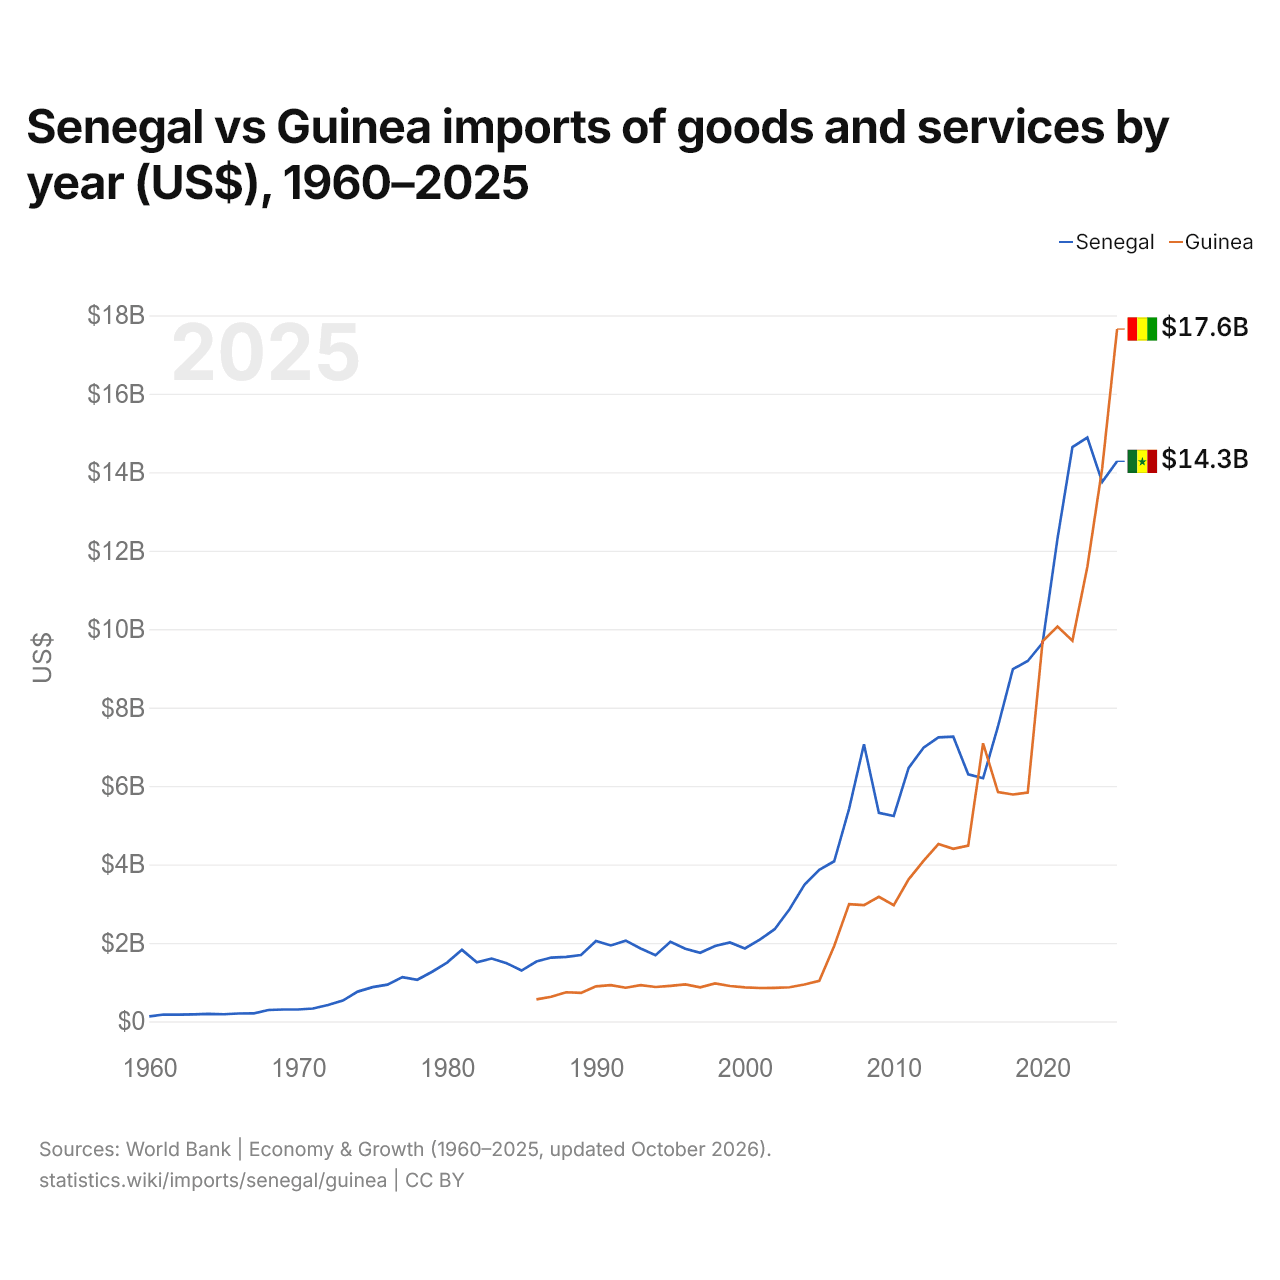
Sénégal vs Guinée : importations de biens et services par année ($ US), 1960–2025
1x
| Année | $ US | |
|---|---|---|
 Sénégal |
 Guinée |
|
| 2025 | 14 277 431 783 $ US | 17 649 957 799 $ US |
| 2024 | 13 754 025 059 $ US | 14 101 095 980 $ US |
| 2023 | 14 883 981 467 $ US | 11 584 168 920 $ US |
| 2022 | 14 641 332 039 $ US | 9 705 672 892 $ US |
| 2021 | 12 311 805 835 $ US | 10 066 835 236 $ US |
| 2020 | 9 651 853 853 $ US | 9 692 379 046 $ US |
| 2019 | 9 186 797 791 $ US | 5 830 607 792 $ US |
| 2018 | 8 978 699 798 $ US | 5 783 505 600 $ US |
| 2017 | 7 516 719 955 $ US | 5 842 867 642 $ US |
| 2016 | 6 197 109 692 $ US | 7 088 908 468 $ US |
| 2015 | 6 298 158 532 $ US | 4 480 281 599 $ US |
| 2014 | 7 258 510 977 $ US | 4 396 562 755 $ US |
| 2013 | 7 241 502 995 $ US | 4 519 671 025 $ US |
| 2012 | 6 976 207 985 $ US | 4 089 175 128 $ US |
| 2011 | 6 461 833 841 $ US | 3 620 035 711 $ US |
| 2010 | 5 235 657 921 $ US | 2 961 065 627 $ US |
| 2009 | 5 314 157 879 $ US | 3 177 066 476 $ US |
| 2008 | 7 064 428 723 $ US | 2 962 825 500 $ US |
| 2007 | 5 418 129 806 $ US | 2 988 313 290 $ US |
| 2006 | 4 080 719 717 $ US | 1 922 724 849 $ US |
| 2005 | 3 863 797 090 $ US | 1 031 237 398 $ US |
| 2004 | 3 482 299 976 $ US | 938 538 723 $ US |
| 2003 | 2 858 883 233 $ US | 868 000 000 $ US |
| 2002 | 2 349 065 891 $ US | 854 685 094 $ US |
| 2001 | 2 083 798 870 $ US | 849 347 060 $ US |
| 2000 | 1 859 032 675 $ US | 867 392 057 $ US |
| 1999 | 2 009 562 329 $ US | 901 094 019 $ US |
| 1998 | 1 920 046 181 $ US | 966 133 230 $ US |
| 1997 | 1 746 494 219 $ US | 864 726 231 $ US |
| 1996 | 1 849 069 201 $ US | 941 903 160 $ US |
| 1995 | 2 028 765 972 $ US | 905 896 319 $ US |
| 1994 | 1 687 427 596 $ US | 874 952 721 $ US |
| 1993 | 1 858 224 797 $ US | 920 896 382 $ US |
| 1992 | 2 056 499 106 $ US | 856 408 259 $ US |
| 1991 | 1 934 759 331 $ US | 922 173 163 $ US |
| 1990 | 2 049 748 975 $ US | 891 809 028 $ US |
| 1989 | 1 691 678 612 $ US | 724 403 472 $ US |
| 1988 | 1 643 548 736 $ US | 740 909 325 $ US |
| 1987 | 1 626 029 779 $ US | 626 828 735 $ US |
| 1986 | 1 524 007 492 $ US | 560 097 159 $ US |
| 1985 | 1 294 595 860 $ US | - |
| 1984 | 1 482 612 971 $ US | - |
| 1983 | 1 600 297 544 $ US | - |
| 1982 | 1 504 650 626 $ US | - |
| 1981 | 1 822 808 299 $ US | - |
| 1980 | 1 496 960 300 $ US | - |
| 1979 | 1 264 686 528 $ US | - |
| 1978 | 1 060 183 571 $ US | - |
| 1977 | 1 126 395 026 $ US | - |
| 1976 | 936 697 270 $ US | - |
| 1975 | 872 642 940 $ US | - |
| 1974 | 757 849 593 $ US | - |
| 1973 | 529 963 308 $ US | - |
| 1972 | 417 121 328 $ US | - |
| 1971 | 326 227 163 $ US | - |
| 1970 | 301 688 941 $ US | - |
| 1969 | 301 745 804 $ US | - |
| 1968 | 288 978 829 $ US | - |
| 1967 | 201 513 831 $ US | - |
| 1966 | 198 969 377 $ US | - |
| 1965 | 180 697 023 $ US | - |
| 1964 | 190 639 575 $ US | - |
| 1963 | 177 791 211 $ US | - |
| 1962 | 173 017 580 $ US | - |
| 1961 | 174 678 731 $ US | - |
| 1960 | 126 271 877 $ US | - |
En 2025, les importations de biens et services du Sénégal s'élevaient à 14,3 milliards de dollars et celles de la Guinée à 17,6 milliards de dollars : celles de la Guinée étaient supérieures de 24 %. En 1986, les importations du Sénégal étaient 2,7 fois plus élevées : 1,52 milliard de dollars pour le Sénégal et 560 millions de dollars pour la Guinée.
Sénégal vs Guinée : chiffres des importations
|
Sénégal
|
Guinée
|
|
|---|---|---|
| Importations | 14,3 Md $US (2025) | 17,6 Md $US (2025) |
| Rang mondial | 105/174 | 97/174 |
| Part mondiale | 0,04 % | 0,05 % |
| % du PIB | 38,6 % | 62,3 % |
| Première catégorie de biens | Pétrole, gaz, minerais et autres matières premières (32,1 %, 2025) | Machines, électronique et véhicules (37,1 %, 2016) |
| Première origine des biens | Chine (14,2 %, 2025) | Chine (16,8 %, 2016) |
Comparer les importations de 2 pays au choix
Sources :
- Banque mondiale | Économie et croissance (1960–2025, mis à jour en octobre 2026)
- TradeMap (2001–2025, mis à jour en octobre 2026)
Creative Commons Attribution (CC BY) : vous pouvez copier, partager, adapter et réutiliser ce contenu, y compris à des fins commerciales, à condition de citer statistics.wiki et d’indiquer les modifications apportées. Les sources citées ci-dessus peuvent avoir leurs propres conditions de licence.