
Italie vs Brésil : PIB, 1960–2025
| Année | PIB, dollars US courants | |
|---|---|---|
 Italie |
 Brésil |
|
| 2025 | 2 551 556 954 100 $ US | 2 279 920 092 492 $ US |
| 2024 | 2 383 435 562 458 $ US | 2 185 821 610 689 $ US |
| 2023 | 2 316 882 296 366 $ US | 2 191 131 765 685 $ US |
| 2022 | 2 104 067 630 319 $ US | 1 951 923 942 083 $ US |
| 2021 | 2 179 207 773 596 $ US | 1 670 647 398 905 $ US |
| 2020 | 1 907 481 094 079 $ US | 1 476 107 231 310 $ US |
| 2019 | 2 019 606 796 584 $ US | 1 873 288 205 060 $ US |
| 2018 | 2 099 435 266 459 $ US | 1 916 933 898 011 $ US |
| 2017 | 1 970 720 904 585 $ US | 2 063 514 977 366 $ US |
| 2016 | 1 887 111 188 177 $ US | 1 795 693 482 853 $ US |
| 2015 | 1 845 428 048 839 $ US | 1 802 212 206 815 $ US |
| 2014 | 2 173 255 507 986 $ US | 2 456 043 727 199 $ US |
| 2013 | 2 153 225 581 941 $ US | 2 472 819 535 557 $ US |
| 2012 | 2 097 929 495 122 $ US | 2 465 227 802 807 $ US |
| 2011 | 2 306 974 020 278 $ US | 2 616 156 223 918 $ US |
| 2010 | 2 144 936 254 535 $ US | 2 208 837 745 101 $ US |
| 2009 | 2 209 484 319 013 $ US | 1 666 996 438 581 $ US |
| 2008 | 2 417 508 414 187 $ US | 1 695 855 083 498 $ US |
| 2007 | 2 222 524 108 128 $ US | 1 397 114 486 369 $ US |
| 2006 | 1 958 563 654 386 $ US | 1 107 626 541 435 $ US |
| 2005 | 1 864 982 261 287 $ US | 891 633 839 894 $ US |
| 2004 | 1 812 808 753 295 $ US | 669 289 424 806 $ US |
| 2003 | 1 582 930 016 539 $ US | 558 233 745 652 $ US |
| 2002 | 1 281 746 271 196 $ US | 509 795 273 807 $ US |
| 2001 | 1 172 041 488 806 $ US | 559 983 634 799 $ US |
| 2000 | 1 149 661 363 439 $ US | 655 448 231 984 $ US |
| 1999 | 1 255 004 736 464 $ US | 599 642 024 320 $ US |
| 1998 | 1 272 729 786 997 $ US | 863 710 759 256 $ US |
| 1997 | 1 244 988 176 444 $ US | 883 206 179 730 $ US |
| 1996 | 1 314 776 508 972 $ US | 850 426 432 992 $ US |
| 1995 | 1 177 369 428 266 $ US | 769 333 050 987 $ US |
| 1994 | 1 101 750 159 702 $ US | 525 369 467 296 $ US |
| 1993 | 1 067 412 587 671 $ US | 368 292 034 381 $ US |
| 1992 | 1 323 204 350 354 $ US | 328 191 909 882 $ US |
| 1991 | 1 249 092 439 519 $ US | 342 534 090 909 $ US |
| 1990 | 1 183 945 130 899 $ US | 384 959 818 182 $ US |
| 1989 | 930 801 709 004 $ US | 412 990 820 287 $ US |
| 1988 | 893 663 934 841 $ US | 307 881 930 752 $ US |
| 1987 | 807 570 134 449 $ US | 283 056 836 894 $ US |
| 1986 | 641 862 313 287 $ US | 256 480 852 471 $ US |
| 1985 | 453 259 761 687 $ US | 210 879 844 639 $ US |
| 1984 | 438 896 930 791 $ US | 188 339 974 087 $ US |
| 1983 | 444 063 496 940 $ US | 189 656 506 321 $ US |
| 1982 | 428 257 421 618 $ US | 271 314 113 768 $ US |
| 1981 | 431 695 533 981 $ US | 258 015 174 749 $ US |
| 1980 | 478 356 755 596 $ US | 237 393 489 893 $ US |
| 1979 | 394 584 507 108 $ US | 221 338 204 480 $ US |
| 1978 | 315 784 469 541 $ US | 200 278 646 124 $ US |
| 1977 | 258 190 019 750 $ US | 176 344 101 402 $ US |
| 1976 | 225 235 205 862 $ US | 153 168 949 208 $ US |
| 1975 | 228 220 643 535 $ US | 129 203 555 239 $ US |
| 1974 | 200 024 444 775 $ US | 109 794 519 728 $ US |
| 1973 | 175 896 529 392 $ US | 83 592 275 863 $ US |
| 1972 | 145 594 833 997 $ US | 58 434 858 375 $ US |
| 1971 | 124 959 712 859 $ US | 48 869 830 902 $ US |
| 1970 | 113 656 669 765 $ US | 42 327 664 794 $ US |
| 1969 | 100 996 667 239 $ US | 37 171 640 819 $ US |
| 1968 | 91 485 448 148 $ US | 33 930 457 425 $ US |
| 1967 | 84 401 995 573 $ US | 31 086 389 195 $ US |
| 1966 | 76 622 444 787 $ US | 28 283 323 733 $ US |
| 1965 | 70 717 012 186 $ US | 22 465 522 884 $ US |
| 1964 | 65 720 771 779 $ US | 20 963 733 695 $ US |
| 1963 | 60 035 924 618 $ US | 23 287 712 878 $ US |
| 1962 | 52 413 872 628 $ US | 19 231 747 852 $ US |
| 1961 | 46 649 487 320 $ US | 17 275 940 449 $ US |
| 1960 | 42 012 422 612 $ US | 17 030 465 539 $ US |
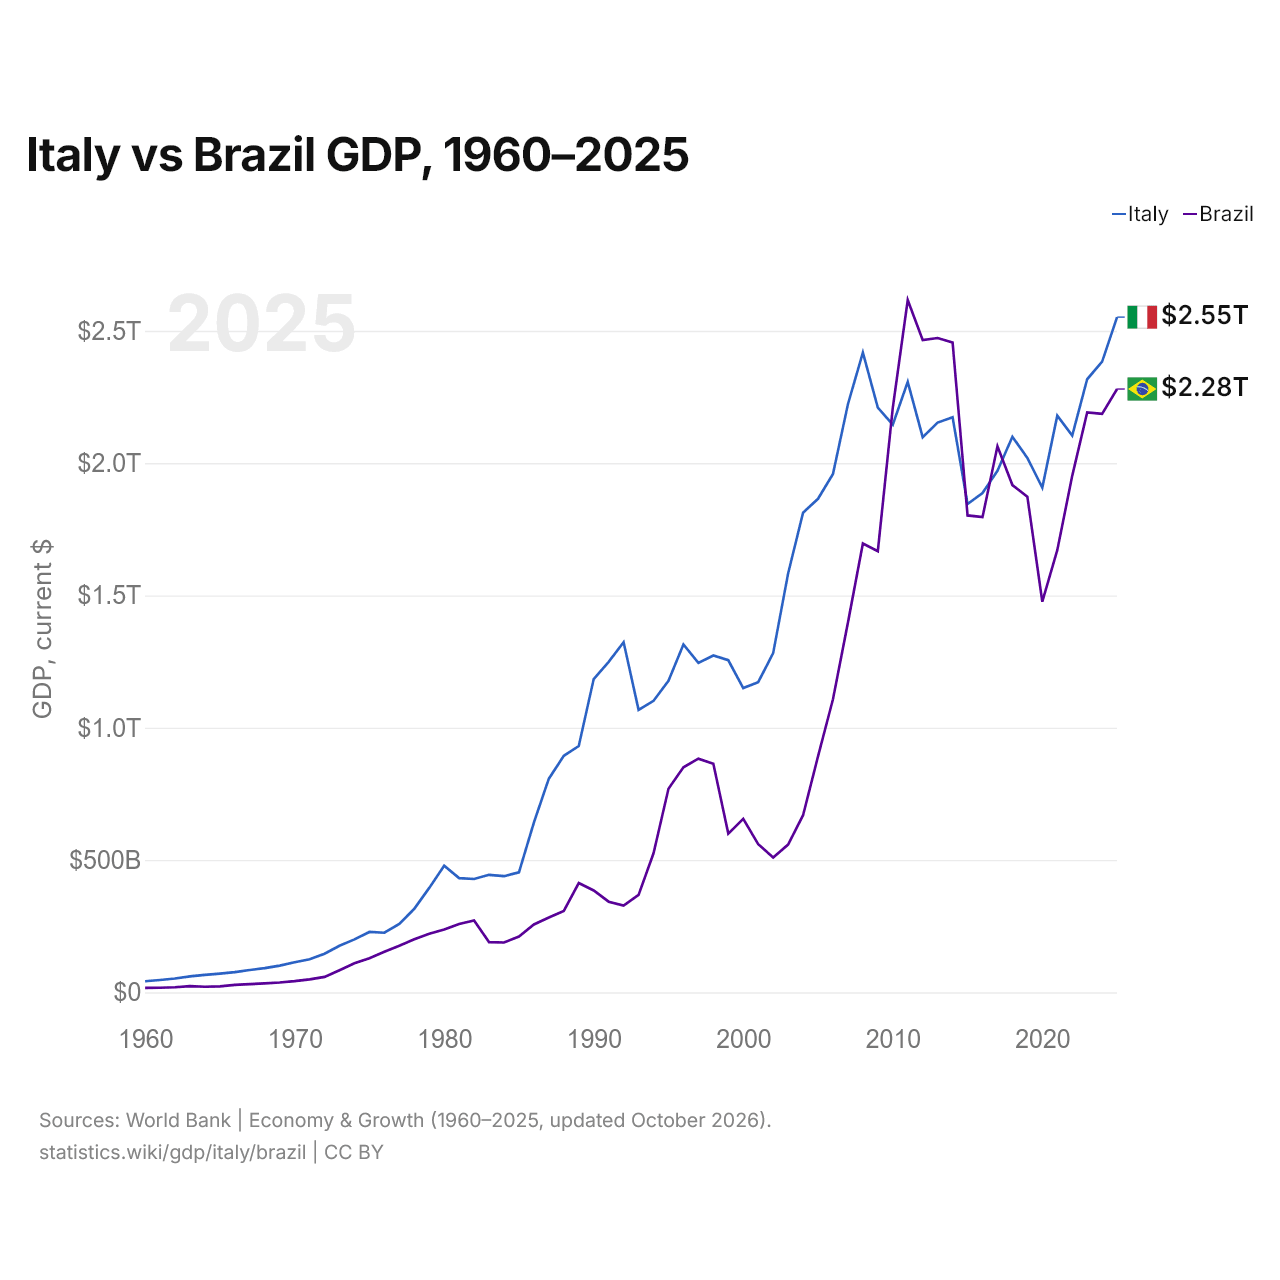
En 2025, le PIB de l'Italie (2,55 billions de dollars US) était supérieur de 12 % à celui du Brésil (2,28 billions de dollars US). En 2015, le PIB de l'Italie était à peu près égal à celui du Brésil. De 2015 à 2025, à prix constants de 2015, le PIB de l'Italie a progressé de 10,8 % et celui du Brésil de 15,1 %.
Depuis 2018, le PIB de l'Italie est le plus élevé des deux ; il l'était aussi en 1960, 2,5 fois celui du Brésil. En 2025, le PIB par habitant était de 43 309 $ US en Italie et de 10 713 $ US au Brésil, soit 4,0 fois plus élevé en Italie. En parité de pouvoir d'achat, l'ordre s'inverse : le PIB (PPA) est de 4,99 billions de dollars au Brésil et de 3,7 billions de dollars en Italie.
Italie vs Brésil : derniers chiffres du PIB
|
Italie
|
Brésil
|
|
|---|---|---|
| PIB, dollars US courants | 2,55 Bn $US | 2,28 Bn $US |
| Rang mondial | 9/197 | 11/197 |
| Part mondiale | 2,16 % | 1,93 % |
| PIB, dollars US constants de 2015 | 2,05 Bn $US | 2,07 Bn $US |
| Écart de PIB | 1,1× | 0,89× |
Comparer le PIB de 2 pays au choix
Sources :
- Banque mondiale | Économie et croissance (1960–2025, mis à jour en octobre 2026)
Creative Commons Attribution (CC BY) : vous pouvez copier, partager, adapter et réutiliser ce contenu, y compris à des fins commerciales, à condition de citer statistics.wiki et d’indiquer les modifications apportées. Les sources citées ci-dessus peuvent avoir leurs propres conditions de licence.