
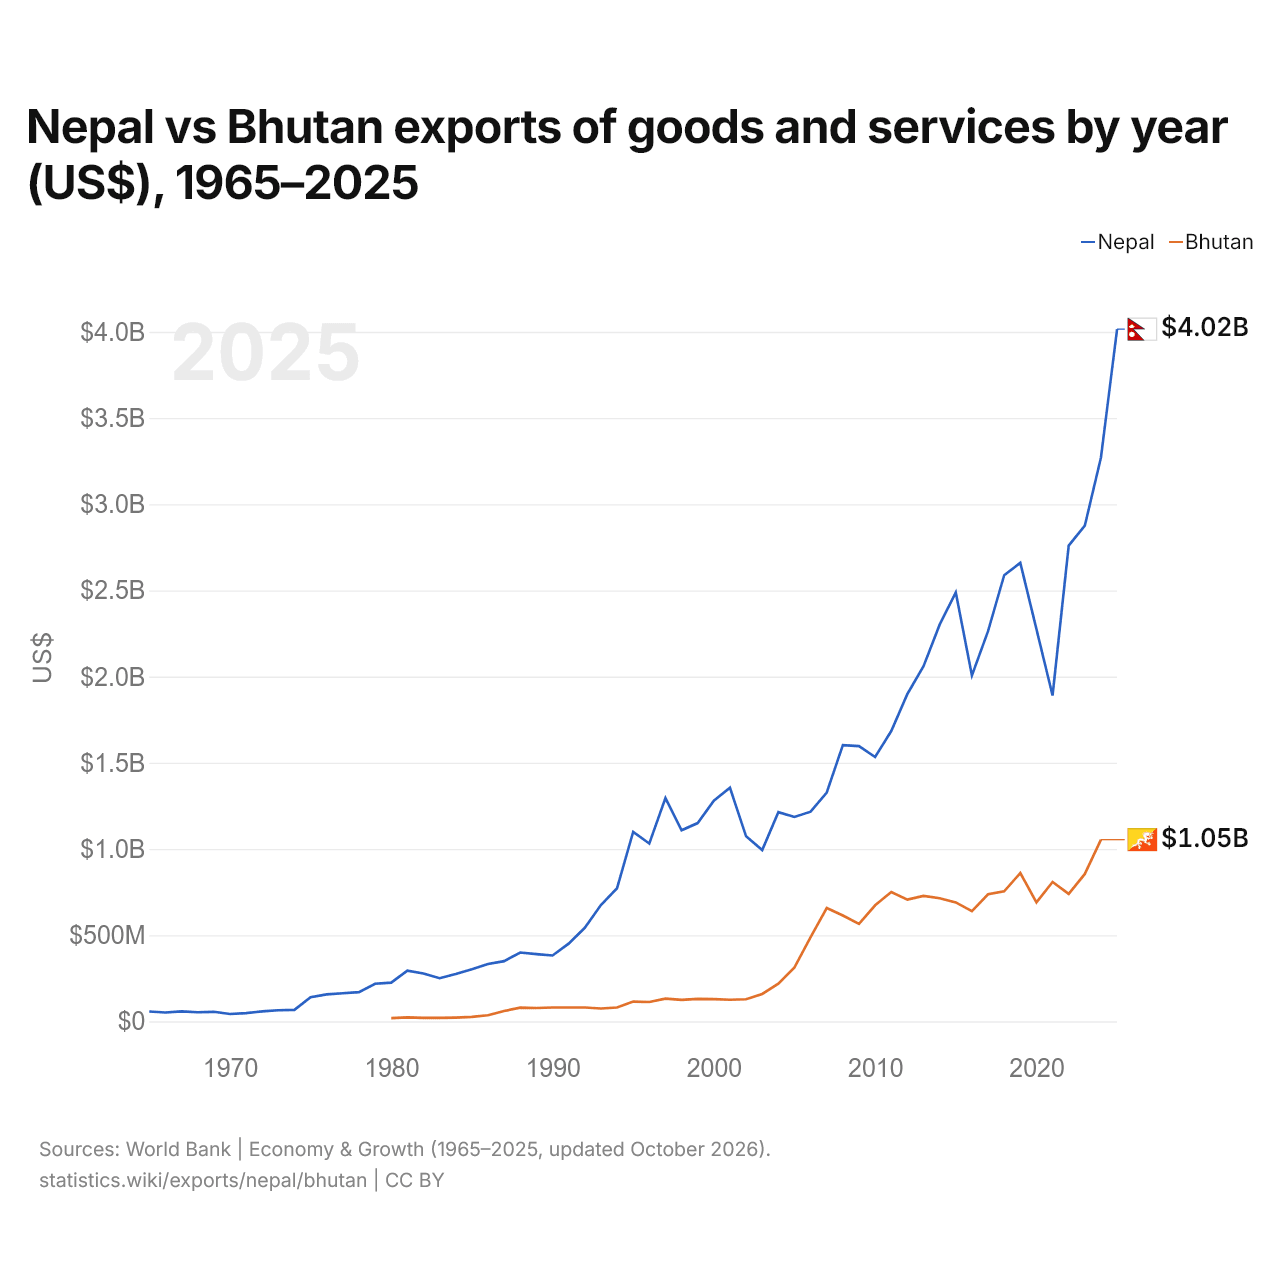
Népal vs Bhoutan : exportations de biens et services par année ($ US), 1965–2025
| Année | $ US | |
|---|---|---|
 Népal |
 Bhoutan |
|
| 2025 | 4 015 673 777 $ US | - |
| 2024 | 3 270 900 881 $ US | 1 054 008 208 $ US |
| 2023 | 2 875 902 618 $ US | 855 304 392 $ US |
| 2022 | 2 760 241 576 $ US | 739 014 454 $ US |
| 2021 | 1 890 245 951 $ US | 808 455 597 $ US |
| 2020 | 2 275 260 267 $ US | 689 742 275 $ US |
| 2019 | 2 659 663 141 $ US | 860 577 748 $ US |
| 2018 | 2 587 877 950 $ US | 754 068 443 $ US |
| 2017 | 2 263 315 185 $ US | 737 148 273 $ US |
| 2016 | 2 005 968 674 $ US | 639 422 101 $ US |
| 2015 | 2 488 355 629 $ US | 689 951 583 $ US |
| 2014 | 2 301 358 066 $ US | 714 242 547 $ US |
| 2013 | 2 059 901 303 $ US | 727 610 630 $ US |
| 2012 | 1 899 084 545 $ US | 706 237 988 $ US |
| 2011 | 1 684 085 753 $ US | 750 018 032 $ US |
| 2010 | 1 533 460 341 $ US | 673 077 626 $ US |
| 2009 | 1 596 506 175 $ US | 565 372 359 $ US |
| 2008 | 1 602 782 687 $ US | 613 949 837 $ US |
| 2007 | 1 327 426 849 $ US | 657 484 027 $ US |
| 2006 | 1 216 071 411 $ US | 488 533 694 $ US |
| 2005 | 1 185 691 417 $ US | 313 220 132 $ US |
| 2004 | 1 213 488 963 $ US | 218 044 359 $ US |
| 2003 | 993 875 698 $ US | 158 790 866 $ US |
| 2002 | 1 073 251 679 $ US | 128 203 232 $ US |
| 2001 | 1 355 238 095 $ US | 125 226 723 $ US |
| 2000 | 1 279 281 888 $ US | 129 011 859 $ US |
| 1999 | 1 150 110 375 $ US | 130 394 709 $ US |
| 1998 | 1 108 297 014 $ US | 124 774 097 $ US |
| 1997 | 1 294 985 096 $ US | 131 386 623 $ US |
| 1996 | 1 031 715 001 $ US | 112 281 787 $ US |
| 1995 | 1 099 094 803 $ US | 114 470 385 $ US |
| 1994 | 772 440 816 $ US | 79 954 760 $ US |
| 1993 | 674 654 167 $ US | 74 253 380 $ US |
| 1992 | 542 824 053 $ US | 80 226 227 $ US |
| 1991 | 450 607 064 $ US | 80 401 688 $ US |
| 1990 | 381 884 480 $ US | 80 463 907 $ US |
| 1989 | 390 158 053 $ US | 77 419 494 $ US |
| 1988 | 399 163 908 $ US | 79 702 765 $ US |
| 1987 | 349 348 713 $ US | 59 610 385 $ US |
| 1986 | 332 466 752 $ US | 35 502 016 $ US |
| 1985 | 302 055 496 $ US | 25 823 143 $ US |
| 1984 | 274 961 829 $ US | 21 882 348 $ US |
| 1983 | 250 371 505 $ US | 19 970 496 $ US |
| 1982 | 277 667 558 $ US | 20 411 138 $ US |
| 1981 | 293 583 342 $ US | 22 606 627 $ US |
| 1980 | 224 583 342 $ US | 18 503 245 $ US |
| 1979 | 218 166 658 $ US | - |
| 1978 | 169 586 602 $ US | - |
| 1977 | 162 959 992 $ US | - |
| 1976 | 156 521 017 $ US | - |
| 1975 | 140 262 467 $ US | - |
| 1974 | 66 375 048 $ US | - |
| 1973 | 64 260 709 $ US | - |
| 1972 | 57 975 286 $ US | - |
| 1971 | 47 703 704 $ US | - |
| 1970 | 42 469 136 $ US | - |
| 1969 | 55 308 642 $ US | - |
| 1968 | 52 860 114 $ US | - |
| 1967 | 57 881 612 $ US | - |
| 1966 | 51 187 820 $ US | - |
| 1965 | 57 094 107 $ US | - |
Les exportations de biens et services du Népal s'élevaient à 3,27 milliards de dollars (2024) et celles du Bhoutan à 1,05 milliard de dollars (2024) : celles du Népal étaient 3,1 fois plus élevées. En 1980, les exportations du Népal étaient 12 fois plus élevées : 225 millions de dollars pour le Népal et 18,5 millions de dollars pour le Bhoutan.
Les exportations de biens et services du Népal sont supérieures à celles du Bhoutan chaque année depuis 1980.
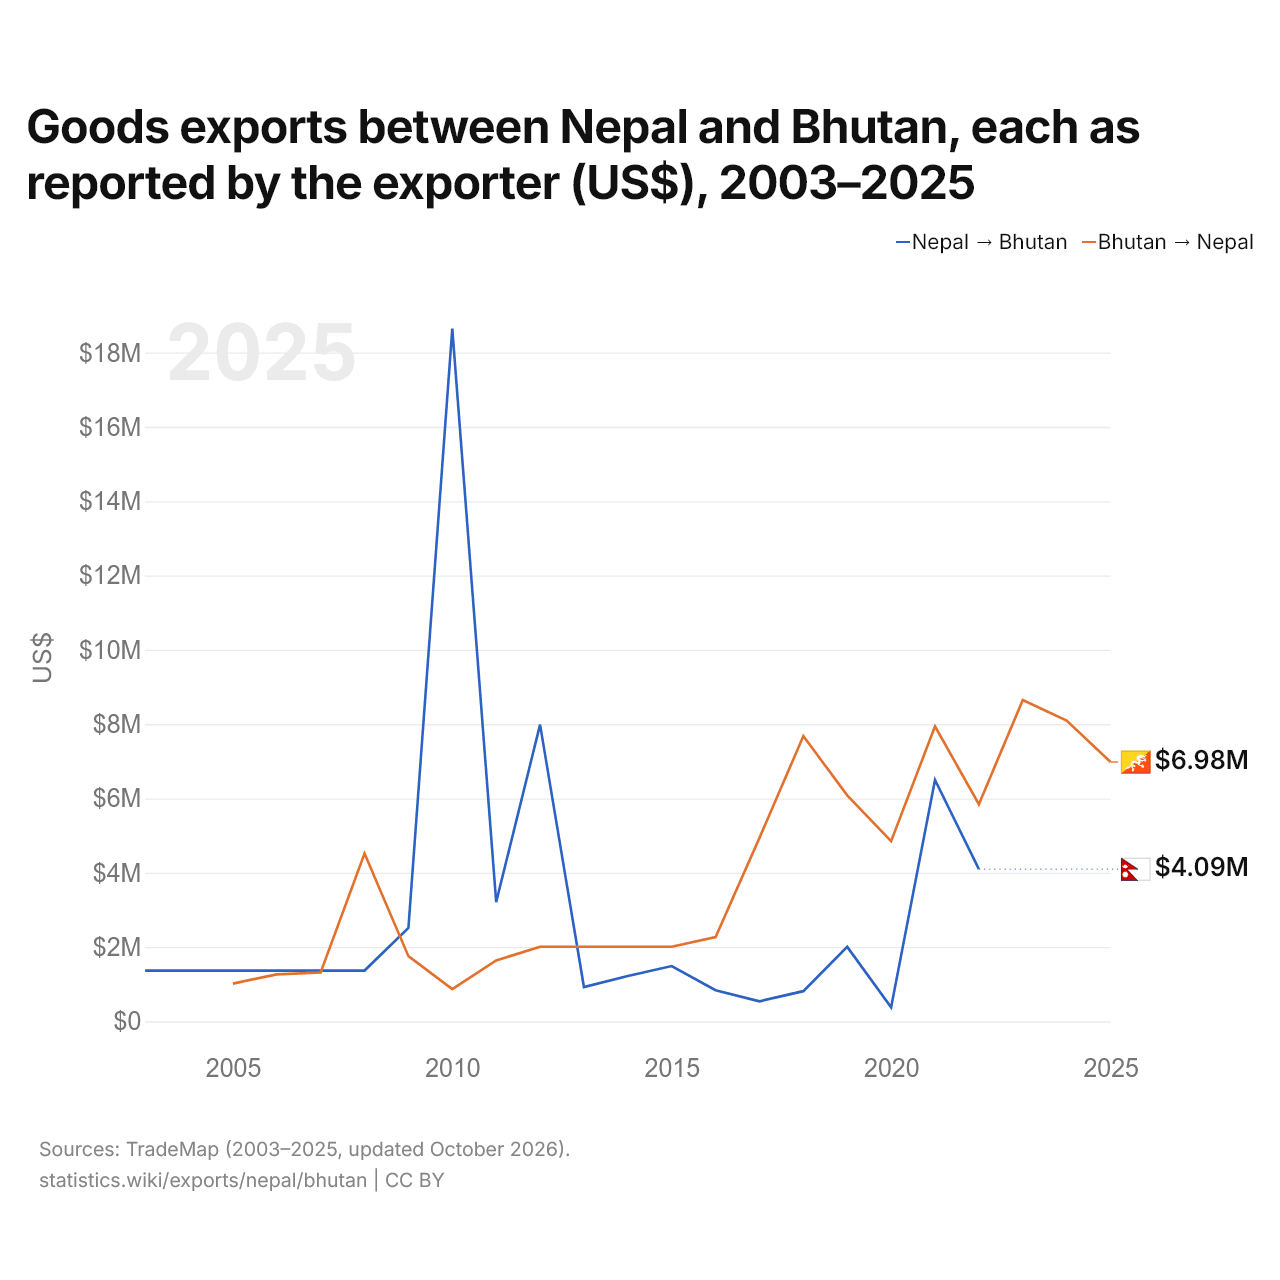
Exportations de biens entre le Népal et le Bhoutan, selon chaque exportateur ($ US), 2003–2025
| Année | $ US | |
|---|---|---|
| Népal → Bhoutan | Bhoutan → Népal | |
| 2025 | - | 6 978 000 $ US |
| 2024 | - | 8 095 000 $ US |
| 2023 | - | 8 649 000 $ US |
| 2022 | 4 094 000 $ US | 5 842 000 $ US |
| 2021 | 6 498 000 $ US | 7 940 000 $ US |
| 2020 | 376 000 $ US | 4 847 000 $ US |
| 2019 | 2 004 000 $ US | 6 081 000 $ US |
| 2018 | 812 000 $ US | 7 678 000 $ US |
| 2017 | 539 000 $ US | 4 938 000 $ US |
| 2016 | 836 000 $ US | 2 268 000 $ US |
| 2015 | 1 488 000 $ US | 2 008 000 $ US |
| 2014 | 1 221 000 $ US | 2 008 000 $ US |
| 2013 | 923 000 $ US | 2 008 000 $ US |
| 2012 | 7 985 000 $ US | 2 008 000 $ US |
| 2011 | 3 209 000 $ US | 1 639 000 $ US |
| 2010 | 18 644 000 $ US | 867 000 $ US |
| 2009 | 2 516 000 $ US | 1 753 000 $ US |
| 2008 | 1 366 000 $ US | 4 518 000 $ US |
| 2007 | 1 366 000 $ US | 1 315 000 $ US |
| 2006 | 1 366 000 $ US | 1 265 000 $ US |
| 2005 | 1 366 000 $ US | 1 016 000 $ US |
| 2004 | 1 366 000 $ US | - |
| 2003 | 1 366 000 $ US | - |
Les exportations de biens du Népal vers le Bhoutan, selon le Népal, s'élevaient à 4,09 millions de dollars, et celles du Bhoutan vers le Népal, selon le Bhoutan, à 5,84 millions de dollars : 43 % de plus pour celles du Bhoutan. En 2005, elles s'élevaient à 1,37 million de dollars pour le Népal et à 1,02 million de dollars pour le Bhoutan.
Népal vs Bhoutan : chiffres des exportations
|
Népal
|
Bhoutan
|
|
|---|---|---|
| Exportations | 4,02 Md $US (2025) | 1,05 Md $US (2024) |
| Rang mondial | 137/176 | 158/176 |
| Part mondiale | 0,01 % | 0,003 % |
| % du PIB | 8,8 % | 31,5 % |
| Première catégorie de biens | Aliments transformés, huiles, aliments pour animaux, boissons et tabac (39,9 %, 2022) | Métaux communs (fer, acier, cuivre, aluminium) (51,9 %, 2025) |
| Première destination des biens | Inde (71,9 %, 2022) | Inde (78,4 %, 2025) |
Comparer les exportations de 2 pays au choix
Sources :
- Banque mondiale | Économie et croissance (1965–2025, mis à jour en octobre 2026)
- TradeMap (2003–2025, mis à jour en octobre 2026)
Creative Commons Attribution (CC BY) : vous pouvez copier, partager, adapter et réutiliser ce contenu, y compris à des fins commerciales, à condition de citer statistics.wiki et d’indiquer les modifications apportées. Les sources citées ci-dessus peuvent avoir leurs propres conditions de licence.