
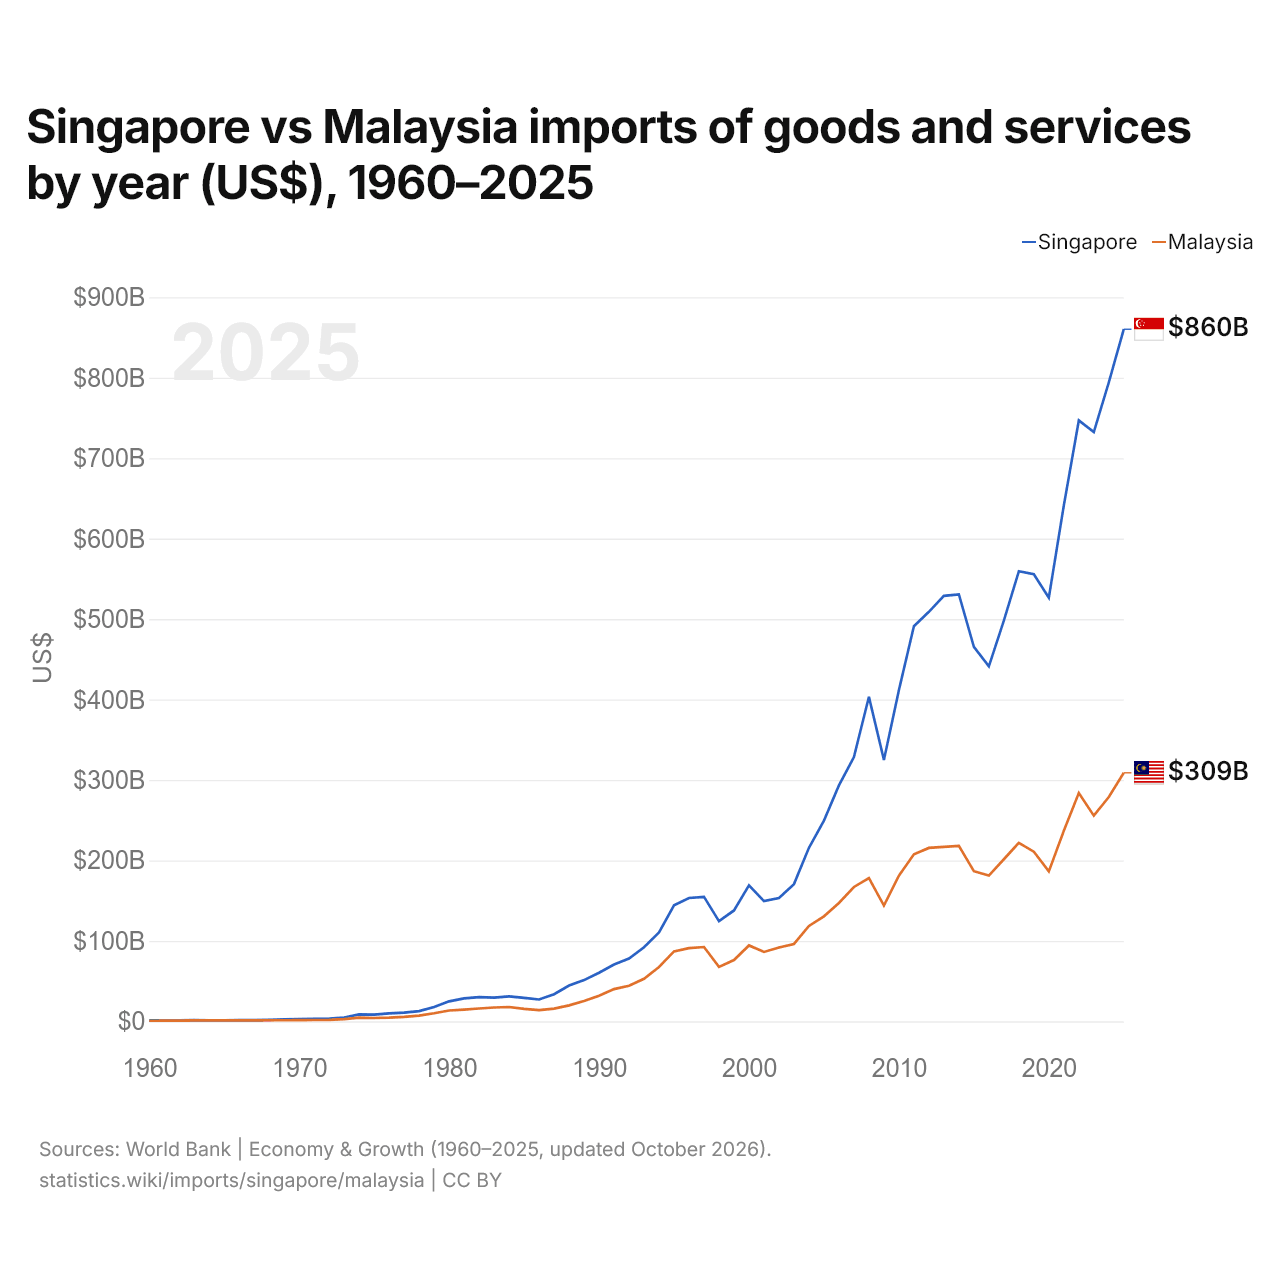
Singapour vs Malaisie : importations de biens et services par année ($ US), 1960–2025
| Année | $ US | |
|---|---|---|
 Singapour |
 Malaisie |
|
| 2025 | 860 239 550 270 $ US | 308 949 499 863 $ US |
| 2024 | 794 257 214 124 $ US | 278 760 544 031 $ US |
| 2023 | 732 376 279 727 $ US | 255 625 703 550 $ US |
| 2022 | 746 881 154 042 $ US | 283 918 591 272 $ US |
| 2021 | 641 260 365 781 $ US | 236 990 392 678 $ US |
| 2020 | 526 490 604 765 $ US | 186 310 380 061 $ US |
| 2019 | 555 635 930 735 $ US | 210 893 037 729 $ US |
| 2018 | 559 453 294 011 $ US | 221 902 484 183 $ US |
| 2017 | 497 980 411 681 $ US | 201 496 430 250 $ US |
| 2016 | 441 180 387 768 $ US | 181 125 866 049 $ US |
| 2015 | 465 345 116 651 $ US | 186 603 344 673 $ US |
| 2014 | 530 588 532 418 $ US | 218 115 959 742 $ US |
| 2013 | 528 920 562 615 $ US | 216 892 331 705 $ US |
| 2012 | 509 015 616 848 $ US | 215 525 053 249 $ US |
| 2011 | 491 027 496 152 $ US | 207 619 404 295 $ US |
| 2010 | 411 718 156 402 $ US | 181 099 423 890 $ US |
| 2009 | 324 906 377 727 $ US | 143 890 358 442 $ US |
| 2008 | 403 368 670 138 $ US | 178 114 431 987 $ US |
| 2007 | 328 425 614 192 $ US | 167 027 920 021 $ US |
| 2006 | 293 279 955 794 $ US | 147 060 242 731 $ US |
| 2005 | 249 571 466 423 $ US | 130 552 677 358 $ US |
| 2004 | 215 770 830 917 $ US | 118 513 157 895 $ US |
| 2003 | 170 522 212 649 $ US | 96 153 421 053 $ US |
| 2002 | 153 298 972 181 $ US | 91 820 789 474 $ US |
| 2001 | 149 415 004 440 $ US | 86 253 947 368 $ US |
| 2000 | 169 107 805 678 $ US | 94 349 736 842 $ US |
| 1999 | 137 834 470 137 $ US | 76 187 894 737 $ US |
| 1998 | 124 555 957 749 $ US | 67 655 931 512 $ US |
| 1997 | 154 758 870 856 $ US | 92 380 580 595 $ US |
| 1996 | 153 364 122 036 $ US | 90 962 318 149 $ US |
| 1995 | 144 309 656 936 $ US | 86 952 551 834 $ US |
| 1994 | 110 550 174 016 $ US | 67 592 211 553 $ US |
| 1993 | 91 975 756 766 $ US | 52 860 519 911 $ US |
| 1992 | 77 981 321 905 $ US | 44 155 181 215 $ US |
| 1991 | 70 627 959 479 $ US | 40 044 733 779 $ US |
| 1990 | 60 411 526 432 $ US | 31 883 543 602 $ US |
| 1989 | 51 266 199 563 $ US | 25 372 465 430 $ US |
| 1988 | 44 438 888 889 $ US | 19 826 003 147 $ US |
| 1987 | 33 687 287 591 $ US | 15 776 869 534 $ US |
| 1986 | 27 154 402 073 $ US | 13 922 838 476 $ US |
| 1985 | 29 103 089 400 $ US | 15 529 741 341 $ US |
| 1984 | 30 939 233 318 $ US | 17 772 765 636 $ US |
| 1983 | 29 571 682 243 $ US | 17 142 918 686 $ US |
| 1982 | 30 107 256 118 $ US | 15 971 622 751 $ US |
| 1981 | 28 576 639 268 $ US | 14 633 320 675 $ US |
| 1980 | 24 854 915 847 $ US | 13 478 905 389 $ US |
| 1979 | 17 695 118 734 $ US | 9 999 808 083 $ US |
| 1978 | 12 716 323 686 $ US | 7 114 292 401 $ US |
| 1977 | 10 869 354 055 $ US | 5 601 956 378 $ US |
| 1976 | 9 896 765 487 $ US | 4 571 968 169 $ US |
| 1975 | 8 250 441 134 $ US | 4 193 454 364 $ US |
| 1974 | 8 589 077 887 $ US | 4 565 307 073 $ US |
| 1973 | 4 708 693 333 $ US | 2 747 070 596 $ US |
| 1972 | 3 328 711 443 $ US | 1 884 339 236 $ US |
| 1971 | 3 165 523 324 $ US | 1 656 477 495 $ US |
| 1970 | 2 785 458 085 $ US | 1 596 749 009 $ US |
| 1969 | 2 349 945 447 $ US | 1 356 648 656 $ US |
| 1968 | 1 869 679 409 $ US | 1 322 348 606 $ US |
| 1967 | 1 505 968 209 $ US | 1 228 595 135 $ US |
| 1966 | 1 430 834 765 $ US | 1 212 261 778 $ US |
| 1965 | 1 308 987 920 $ US | 1 194 948 419 $ US |
| 1964 | 1 188 741 743 $ US | 1 132 554 994 $ US |
| 1963 | 1 428 972 762 $ US | 1 104 134 953 $ US |
| 1962 | 1 227 157 800 $ US | 863 381 266 $ US |
| 1961 | 1 200 305 760 $ US | 790 861 160 $ US |
| 1960 | 1 243 752 491 $ US | 752 314 437 $ US |
En 2025, les importations de biens et services de Singapour s'élevaient à 860 milliards de dollars et celles de la Malaisie à 309 milliards de dollars : celles de Singapour étaient 2,8 fois plus élevées. En 1960, les importations de Singapour étaient 1,7 fois plus élevées : 1,24 milliard de dollars pour Singapour et 752 millions de dollars pour la Malaisie.
Les importations de biens et services de Singapour sont supérieures à celles de la Malaisie chaque année depuis 1960.
Singapour vs Malaisie : chiffres des importations
|
Singapour
|
Malaisie
|
|
|---|---|---|
| Importations | 860 Md $US (2025) | 309 Md $US (2025) |
| Rang mondial | 9/174 | 29/174 |
| Part mondiale | 2,55 % | 0,92 % |
| % du PIB | 142,5 % | 65,4 % |
| Première catégorie de biens | Machines, électronique et véhicules (61,2 %, 2025) | Machines, électronique et véhicules (54,4 %, 2025) |
| Première origine des biens | Chine (12,5 %, 2025) | Chine (24,3 %, 2025) |
Comparer les importations de 2 pays au choix
Sources :
- Banque mondiale | Économie et croissance (1960–2025, mis à jour en octobre 2026)
- TradeMap (2001–2025, mis à jour en octobre 2026)
Creative Commons Attribution (CC BY) : vous pouvez copier, partager, adapter et réutiliser ce contenu, y compris à des fins commerciales, à condition de citer statistics.wiki et d’indiquer les modifications apportées. Les sources citées ci-dessus peuvent avoir leurs propres conditions de licence.