
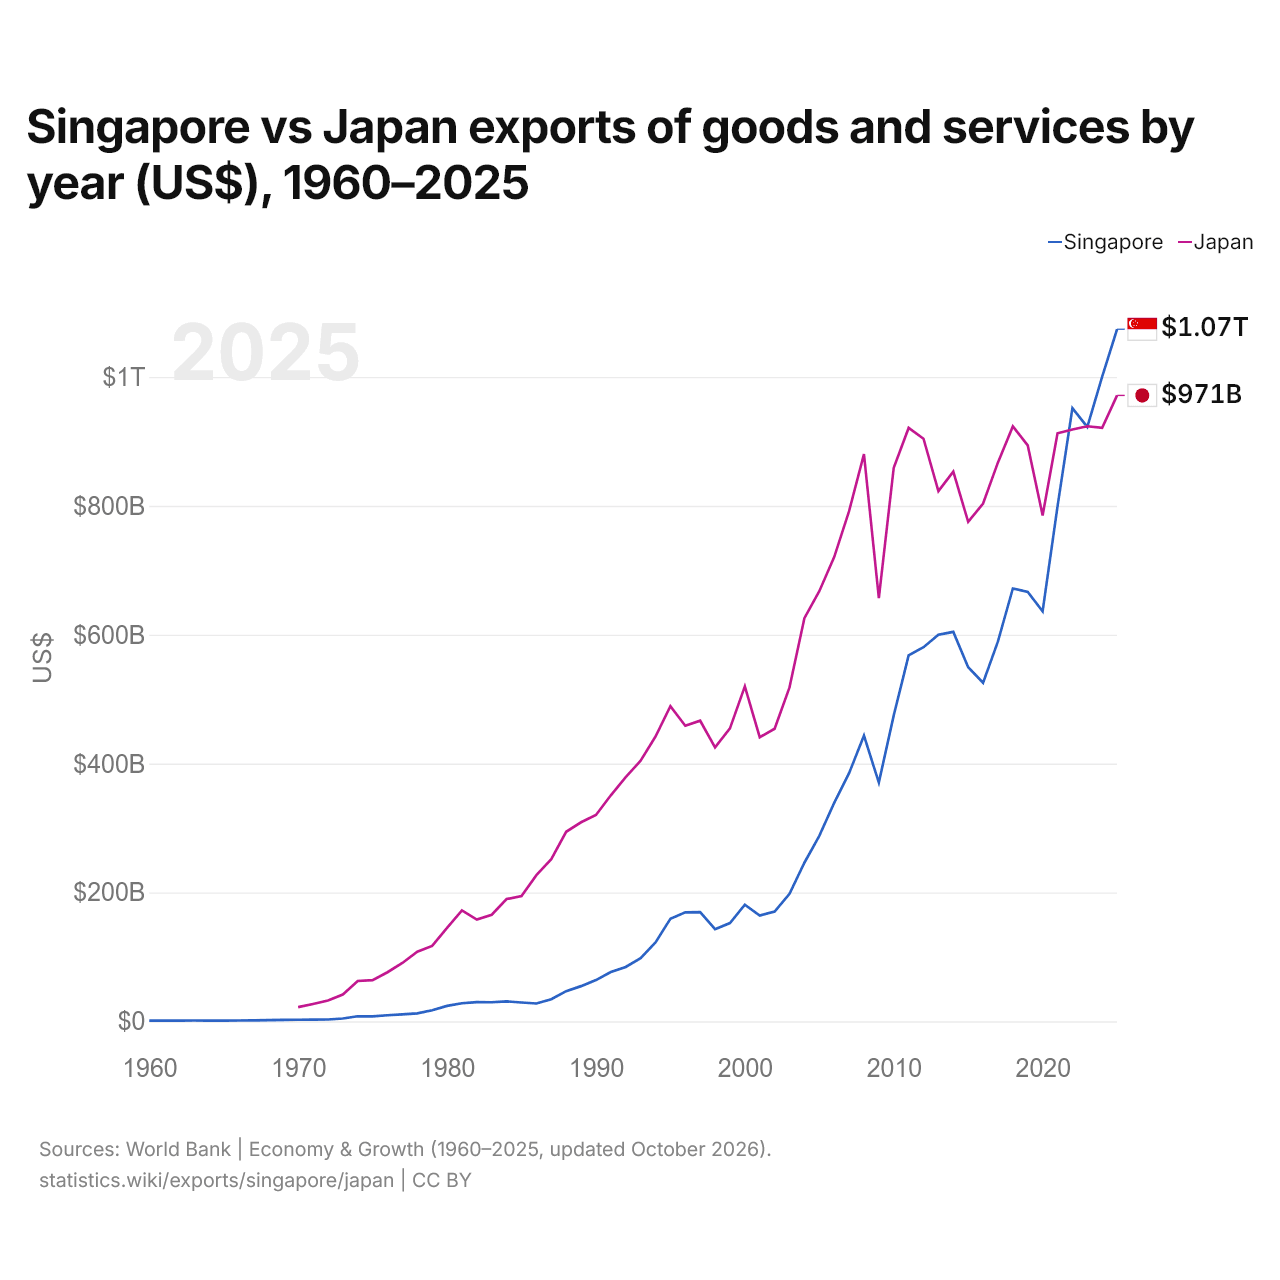
Singapour vs Japon : exportations de biens et services par année ($ US), 1960–2025
| Année | $ US | |
|---|---|---|
 Singapour |
 Japon |
|
| 2025 | 1 073 990 898 314 $ US | 971 285 188 334 $ US |
| 2024 | 1 000 563 674 150 $ US | 920 960 002 390 $ US |
| 2023 | 922 325 317 795 $ US | 923 420 059 651 $ US |
| 2022 | 951 421 989 501 $ US | 918 412 226 914 $ US |
| 2021 | 799 113 423 839 $ US | 912 551 747 360 $ US |
| 2020 | 636 352 158 592 $ US | 785 057 625 362 $ US |
| 2019 | 666 302 583 718 $ US | 893 761 110 034 $ US |
| 2018 | 671 713 291 846 $ US | 923 192 943 803 $ US |
| 2017 | 589 508 336 803 $ US | 867 373 157 903 $ US |
| 2016 | 525 391 771 248 $ US | 803 470 630 550 $ US |
| 2015 | 549 421 999 164 $ US | 775 031 229 091 $ US |
| 2014 | 604 391 776 173 $ US | 852 957 541 825 $ US |
| 2013 | 600 013 186 286 $ US | 822 673 891 615 $ US |
| 2012 | 580 505 587 048 $ US | 904 081 818 095 $ US |
| 2011 | 568 009 168 564 $ US | 920 847 566 474 $ US |
| 2010 | 474 817 309 469 $ US | 859 110 359 863 $ US |
| 2009 | 370 525 982 888 $ US | 656 874 364 781 $ US |
| 2008 | 443 371 610 356 $ US | 880 075 851 760 $ US |
| 2007 | 385 006 655 157 $ US | 791 701 308 241 $ US |
| 2006 | 338 926 122 121 $ US | 720 411 902 737 $ US |
| 2005 | 287 771 727 539 $ US | 667 445 122 493 $ US |
| 2004 | 246 116 322 768 $ US | 625 631 972 494 $ US |
| 2003 | 197 818 139 656 $ US | 518 203 970 380 $ US |
| 2002 | 170 350 298 338 $ US | 454 066 577 344 $ US |
| 2001 | 164 227 617 774 $ US | 440 830 946 384 $ US |
| 2000 | 180 961 018 305 $ US | 519 863 963 885 $ US |
| 1999 | 152 507 703 735 $ US | 454 583 045 086 $ US |
| 1998 | 142 983 995 000 $ US | 425 156 200 704 $ US |
| 1997 | 169 506 454 042 $ US | 466 482 189 983 $ US |
| 1996 | 169 132 174 171 $ US | 458 650 604 758 $ US |
| 1995 | 159 046 900 079 $ US | 488 922 980 748 $ US |
| 1994 | 122 465 766 339 $ US | 441 885 061 610 $ US |
| 1993 | 97 966 383 028 $ US | 404 418 972 318 $ US |
| 1992 | 84 309 872 453 $ US | 378 894 650 114 $ US |
| 1991 | 76 631 490 593 $ US | 350 804 377 214 $ US |
| 1990 | 64 045 069 989 $ US | 320 186 473 747 $ US |
| 1989 | 54 623 086 861 $ US | 308 916 648 063 $ US |
| 1988 | 46 864 672 365 $ US | 294 106 125 787 $ US |
| 1987 | 34 308 211 629 $ US | 251 700 285 196 $ US |
| 1986 | 27 644 243 443 $ US | 226 865 329 771 $ US |
| 1985 | 29 160 517 557 $ US | 194 351 120 461 $ US |
| 1984 | 30 900 662 565 $ US | 189 758 022 924 $ US |
| 1983 | 29 675 560 748 $ US | 165 329 539 555 $ US |
| 1982 | 29 812 562 124 $ US | 157 933 279 187 $ US |
| 1981 | 28 092 845 134 $ US | 172 134 410 830 $ US |
| 1980 | 24 031 178 148 $ US | 145 104 895 105 $ US |
| 1979 | 17 169 305 189 $ US | 116 997 148 836 $ US |
| 1978 | 12 436 295 810 $ US | 108 052 061 241 $ US |
| 1977 | 10 772 340 942 $ US | 90 568 192 250 $ US |
| 1976 | 9 457 765 782 $ US | 76 182 443 149 $ US |
| 1975 | 7 724 978 456 $ US | 63 986 133 887 $ US |
| 1974 | 7 804 712 298 $ US | 62 536 307 379 $ US |
| 1973 | 4 373 973 333 $ US | 41 576 284 285 $ US |
| 1972 | 2 904 841 512 $ US | 32 270 972 031 $ US |
| 1971 | 2 704 396 969 $ US | 26 966 713 726 $ US |
| 1970 | 2 420 440 217 $ US | 22 026 785 842 $ US |
| 1969 | 2 193 145 217 $ US | - |
| 1968 | 1 791 540 628 $ US | - |
| 1967 | 1 414 991 409 $ US | - |
| 1966 | 1 351 650 649 $ US | - |
| 1965 | 1 201 122 428 $ US | - |
| 1964 | 1 091 623 601 $ US | - |
| 1963 | 1 295 235 233 $ US | - |
| 1962 | 1 141 211 674 $ US | - |
| 1961 | 1 089 010 264 $ US | - |
| 1960 | 1 147 516 350 $ US | - |
En 2025, les exportations de biens et services de Singapour s'élevaient à 1,07 billion de dollars et celles du Japon à 971 milliards de dollars : celles de Singapour étaient supérieures de 11 %. En 1970, les exportations du Japon étaient 9,1 fois plus élevées : 2,42 milliards de dollars pour Singapour et 22 milliards de dollars pour le Japon.
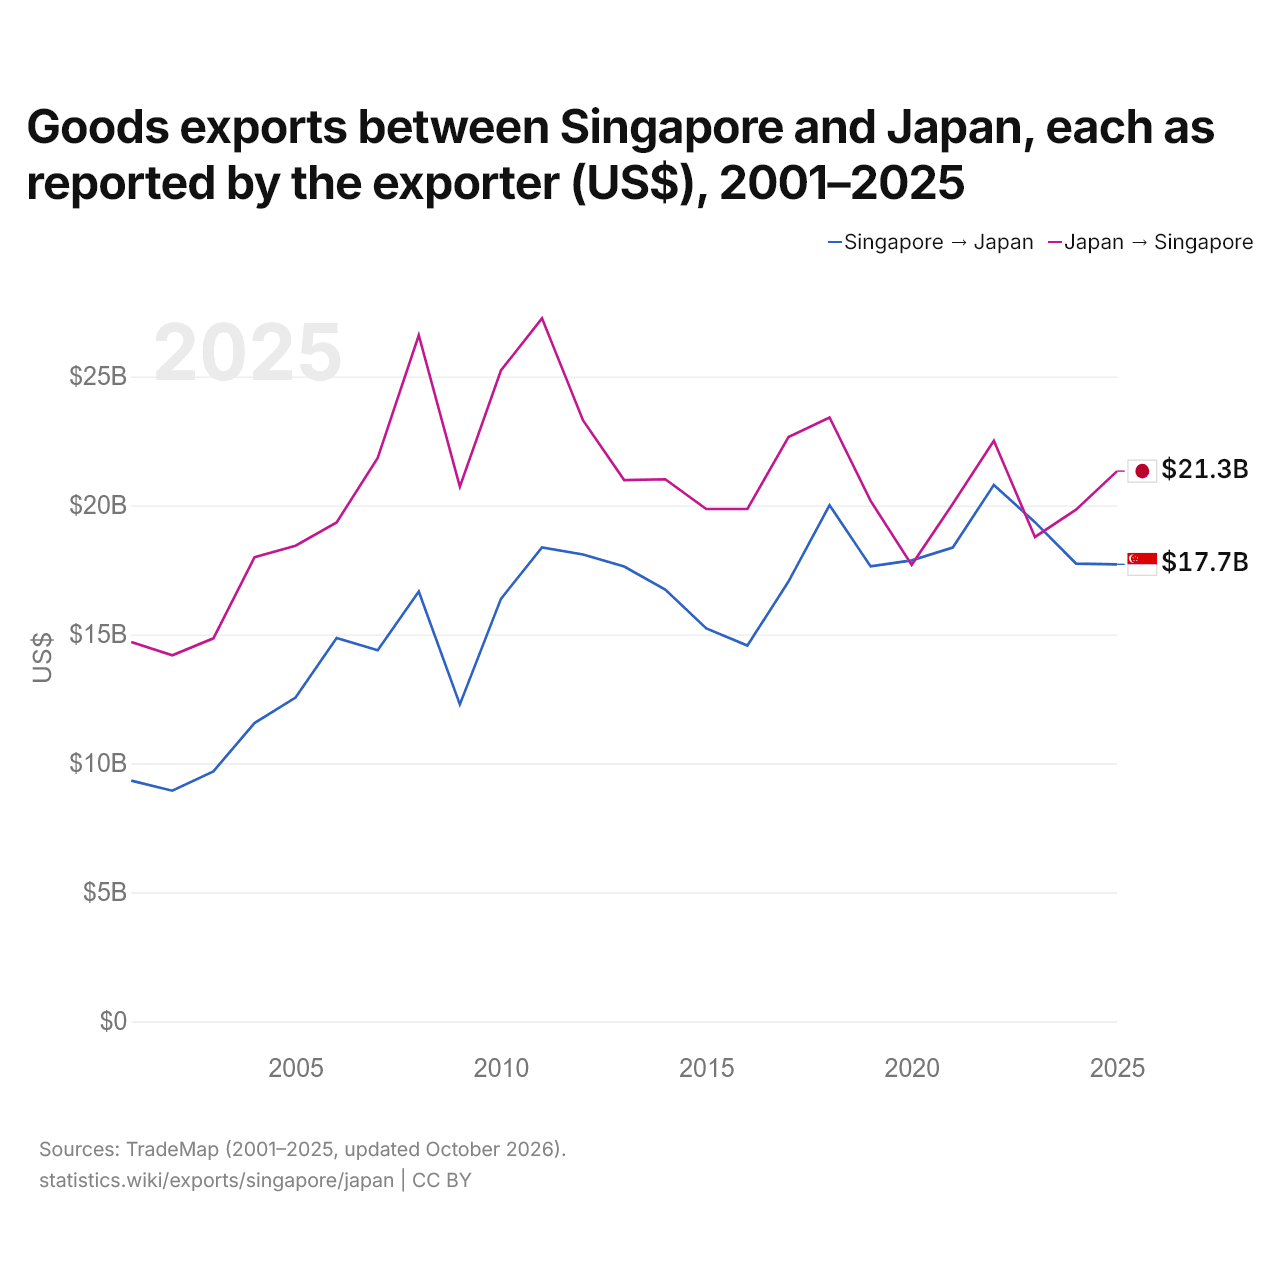
Exportations de biens entre Singapour et le Japon, selon chaque exportateur ($ US), 2001–2025
| Année | $ US | |
|---|---|---|
| Singapour → Japon | Japon → Singapour | |
| 2025 | 17 714 948 000 $ US | 21 328 935 000 $ US |
| 2024 | 17 744 892 000 $ US | 19 834 807 000 $ US |
| 2023 | 19 350 667 000 $ US | 18 776 678 000 $ US |
| 2022 | 20 795 886 000 $ US | 22 503 833 000 $ US |
| 2021 | 18 366 164 000 $ US | 20 061 019 000 $ US |
| 2020 | 17 871 037 000 $ US | 17 694 529 000 $ US |
| 2019 | 17 635 243 000 $ US | 20 173 990 000 $ US |
| 2018 | 20 009 056 000 $ US | 23 409 813 000 $ US |
| 2017 | 17 047 595 000 $ US | 22 652 218 000 $ US |
| 2016 | 14 567 641 000 $ US | 19 862 199 000 $ US |
| 2015 | 15 230 858 000 $ US | 19 859 504 000 $ US |
| 2014 | 16 739 800 000 $ US | 21 012 895 000 $ US |
| 2013 | 17 628 163 000 $ US | 20 980 350 000 $ US |
| 2012 | 18 098 945 000 $ US | 23 293 917 000 $ US |
| 2011 | 18 371 021 000 $ US | 27 253 425 000 $ US |
| 2010 | 16 378 430 000 $ US | 25 230 215 000 $ US |
| 2009 | 12 283 093 000 $ US | 20 723 825 000 $ US |
| 2008 | 16 659 803 000 $ US | 26 596 577 000 $ US |
| 2007 | 14 387 841 000 $ US | 21 839 356 000 $ US |
| 2006 | 14 857 375 000 $ US | 19 339 944 000 $ US |
| 2005 | 12 551 337 000 $ US | 18 435 543 000 $ US |
| 2004 | 11 560 622 000 $ US | 17 988 066 000 $ US |
| 2003 | 9 690 096 000 $ US | 14 846 929 000 $ US |
| 2002 | 8 939 660 000 $ US | 14 191 440 000 $ US |
| 2001 | 9 332 728 000 $ US | 14 708 196 000 $ US |
En 2025, les exportations de biens de Singapour vers le Japon, selon Singapour, s'élevaient à 17,7 milliards de dollars, et celles du Japon vers Singapour, selon le Japon, à 21,3 milliards de dollars : 20 % de plus pour celles du Japon. En 2001, elles s'élevaient à 9,33 milliards de dollars pour Singapour et à 14,7 milliards de dollars pour le Japon.
Singapour vs Japon : chiffres des exportations
|
Singapour
|
Japon
|
|
|---|---|---|
| Exportations | 1,07 Bn $US (2025) | 971 Md $US (2025) |
| Rang mondial | 7/176 | 9/176 |
| Part mondiale | 3,08 % | 2,78 % |
| % du PIB | 177,9 % | 21,9 % |
| Première catégorie de biens | Machines, électronique et véhicules (65,2 %, 2025) | Machines, électronique et véhicules (59,1 %, 2025) |
| Première destination des biens | Chine (10,9 %, 2025) | États-Unis (18,6 %, 2025) |
Comparer les exportations de 2 pays au choix
Sources :
- Banque mondiale | Économie et croissance (1960–2025, mis à jour en octobre 2026)
- TradeMap (2001–2025, mis à jour en octobre 2026)
Creative Commons Attribution (CC BY) : vous pouvez copier, partager, adapter et réutiliser ce contenu, y compris à des fins commerciales, à condition de citer statistics.wiki et d’indiquer les modifications apportées. Les sources citées ci-dessus peuvent avoir leurs propres conditions de licence.