
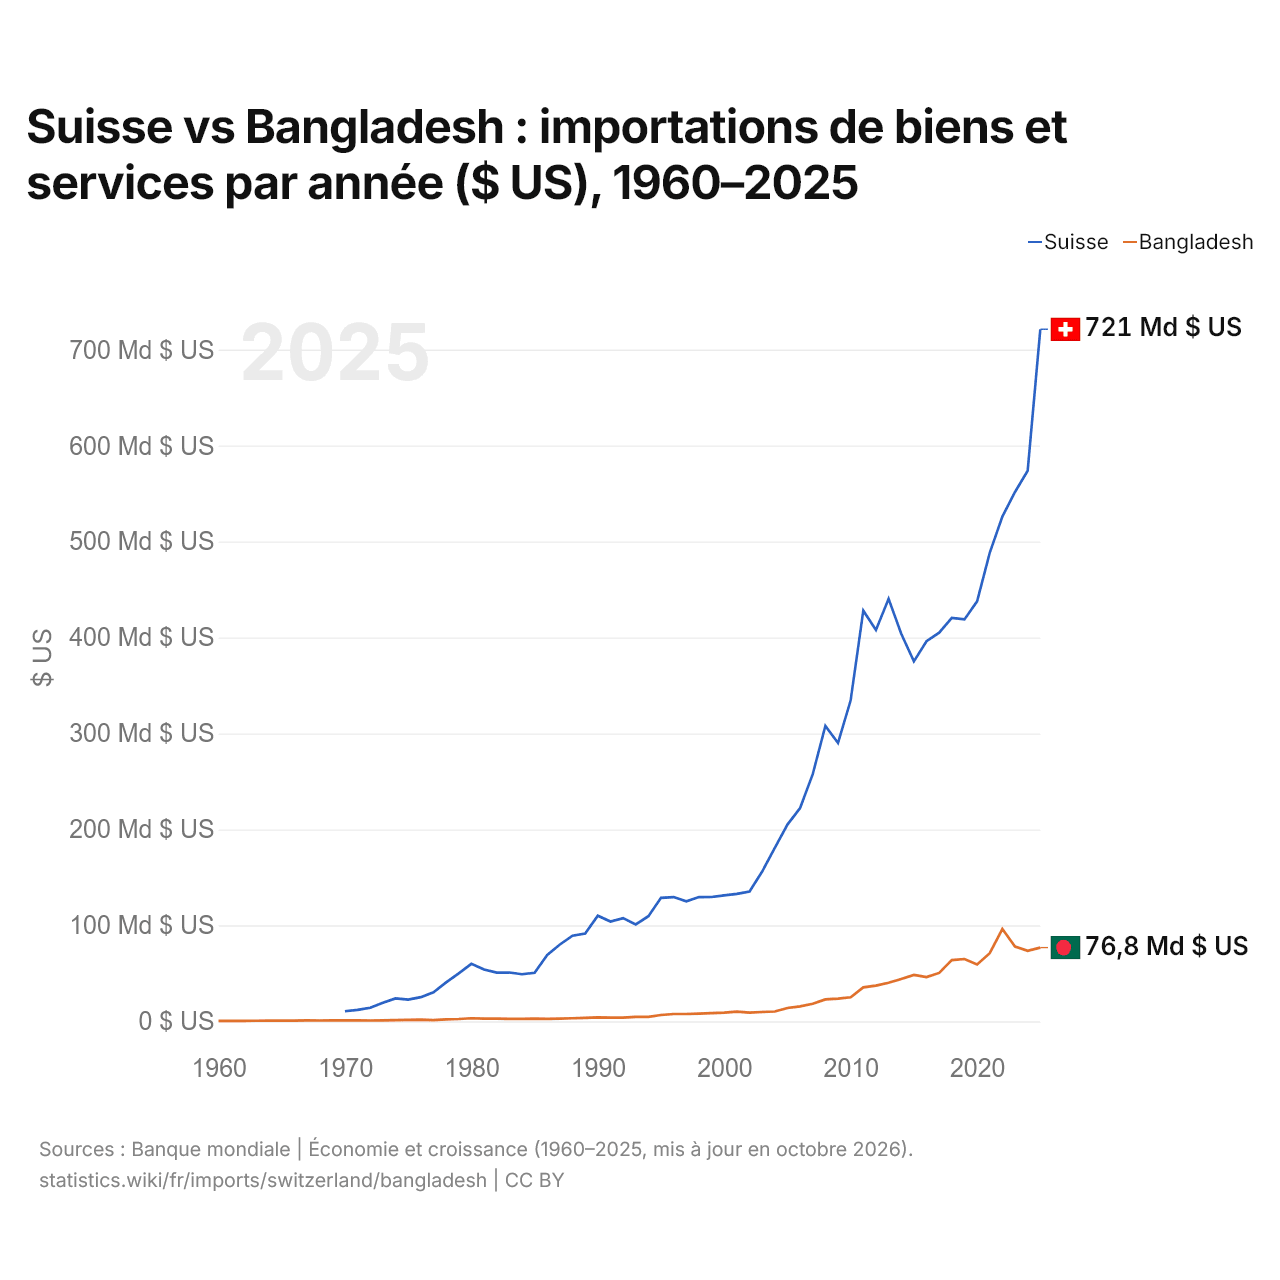
Suisse vs Bangladesh : importations de biens et services par année ($ US), 1960–2025
| Année | $ US | |
|---|---|---|
 Suisse |
 Bangladesh |
|
| 2025 | 721 176 290 537 $ US | 76 818 948 730 $ US |
| 2024 | 573 729 148 940 $ US | 73 445 483 484 $ US |
| 2023 | 551 661 909 426 $ US | 77 972 815 573 $ US |
| 2022 | 525 998 490 835 $ US | 96 157 127 887 $ US |
| 2021 | 488 132 942 920 $ US | 71 021 045 805 $ US |
| 2020 | 437 650 198 738 $ US | 59 195 931 838 $ US |
| 2019 | 418 811 907 122 $ US | 64 919 190 426 $ US |
| 2018 | 420 425 133 537 $ US | 63 757 868 051 $ US |
| 2017 | 404 959 093 794 $ US | 50 463 186 692 $ US |
| 2016 | 396 141 657 878 $ US | 46 183 400 773 $ US |
| 2015 | 375 100 653 447 $ US | 48 297 463 644 $ US |
| 2014 | 403 927 913 522 $ US | 44 128 305 231 $ US |
| 2013 | 440 317 765 518 $ US | 40 137 513 944 $ US |
| 2012 | 407 820 712 475 $ US | 37 259 465 952 $ US |
| 2011 | 427 943 351 691 $ US | 35 365 482 040 $ US |
| 2010 | 334 500 366 766 $ US | 25 105 548 607 $ US |
| 2009 | 290 018 359 526 $ US | 23 725 728 360 $ US |
| 2008 | 307 852 346 967 $ US | 22 874 478 189 $ US |
| 2007 | 257 607 392 536 $ US | 18 268 522 232 $ US |
| 2006 | 222 300 672 356 $ US | 15 621 647 159 $ US |
| 2005 | 205 029 812 078 $ US | 13 898 043 877 $ US |
| 2004 | 180 727 030 961 $ US | 10 229 675 556 $ US |
| 2003 | 156 102 130 393 $ US | 9 761 830 743 $ US |
| 2002 | 135 300 341 332 $ US | 9 060 891 520 $ US |
| 2001 | 132 832 664 138 $ US | 10 102 557 450 $ US |
| 2000 | 131 281 286 120 $ US | 9 060 862 652 $ US |
| 1999 | 129 599 304 354 $ US | 8 525 935 940 $ US |
| 1998 | 129 511 621 603 $ US | 8 058 876 652 $ US |
| 1997 | 125 124 828 085 $ US | 7 625 081 967 $ US |
| 1996 | 129 506 317 961 $ US | 7 601 784 841 $ US |
| 1995 | 128 714 580 973 $ US | 6 580 597 015 $ US |
| 1994 | 109 511 724 793 $ US | 4 681 795 511 $ US |
| 1993 | 101 024 191 256 $ US | 4 677 910 053 $ US |
| 1992 | 107 520 864 031 $ US | 3 915 198 939 $ US |
| 1991 | 103 983 464 435 $ US | 3 785 238 095 $ US |
| 1990 | 110 110 583 069 $ US | 4 126 169 962 $ US |
| 1989 | 91 379 329 421 $ US | 3 679 751 008 $ US |
| 1988 | 89 230 436 684 $ US | 3 255 865 280 $ US |
| 1987 | 80 053 582 350 $ US | 2 842 322 581 $ US |
| 1986 | 69 088 170 549 $ US | 2 577 133 333 $ US |
| 1985 | 50 532 659 232 $ US | 2 860 038 462 $ US |
| 1984 | 49 032 176 022 $ US | 2 538 320 000 $ US |
| 1983 | 50 913 370 492 $ US | 2 590 824 916 $ US |
| 1982 | 50 763 085 258 $ US | 2 877 295 409 $ US |
| 1981 | 53 940 970 879 $ US | 2 858 506 732 $ US |
| 1980 | 59 924 576 595 $ US | 3 243 617 765 $ US |
| 1979 | 50 038 490 407 $ US | 2 459 010 309 $ US |
| 1978 | 40 550 611 857 $ US | 2 056 130 688 $ US |
| 1977 | 30 263 671 313 $ US | 1 194 951 862 $ US |
| 1976 | 25 190 649 704 $ US | 1 784 273 650 $ US |
| 1975 | 22 703 224 732 $ US | 1 575 422 623 $ US |
| 1974 | 23 906 117 544 $ US | 1 294 857 683 $ US |
| 1973 | 19 273 720 614 $ US | 958 701 324 $ US |
| 1972 | 14 111 769 434 $ US | 863 537 083 $ US |
| 1971 | 11 915 190 982 $ US | 938 861 375 $ US |
| 1970 | 10 461 910 130 $ US | 1 124 763 292 $ US |
| 1969 | - | 988 170 750 $ US |
| 1968 | - | 868 581 375 $ US |
| 1967 | - | 913 639 937 $ US |
| 1966 | - | 814 737 854 $ US |
| 1965 | - | 789 516 354 $ US |
| 1964 | - | 760 610 875 $ US |
| 1963 | - | 620 050 875 $ US |
| 1962 | - | 549 204 104 $ US |
| 1961 | - | 563 656 854 $ US |
| 1960 | - | 397 875 437 $ US |
En 2025, les importations de biens et services de la Suisse s'élevaient à 721 milliards de dollars et celles du Bangladesh à 76,8 milliards de dollars : celles de la Suisse étaient 9,4 fois plus élevées. En 1970, les importations de la Suisse étaient 9,3 fois plus élevées : 10,5 milliards de dollars pour la Suisse et 1,12 milliard de dollars pour le Bangladesh.
Les importations de biens et services de la Suisse sont supérieures à celles du Bangladesh chaque année depuis 1970.
Suisse vs Bangladesh : chiffres des importations
|
Suisse
|
Bangladesh
|
|
|---|---|---|
| Importations | 721 Md $US (2025) | 76,8 Md $US (2025) |
| Rang mondial | 14/174 | 54/174 |
| Part mondiale | 2,14 % | 0,23 % |
| % du PIB | 69,1 % | 16,8 % |
| Première catégorie de biens | Métaux précieux, pierres précieuses, bijoux, montres, instruments de musique et art (48 %, 2025) | Textiles, vêtements, chaussures, meubles et jouets (26,4 %, 2018) |
| Première origine des biens | Allemagne (15,1 %, 2025) | Chine (19 %, 2018) |
Comparer les importations de 2 pays au choix
Sources :
- Banque mondiale | Économie et croissance (1960–2025, mis à jour en octobre 2026)
- TradeMap (2001–2025, mis à jour en octobre 2026)
Creative Commons Attribution (CC BY) : vous pouvez copier, partager, adapter et réutiliser ce contenu, y compris à des fins commerciales, à condition de citer statistics.wiki et d’indiquer les modifications apportées. Les sources citées ci-dessus peuvent avoir leurs propres conditions de licence.