
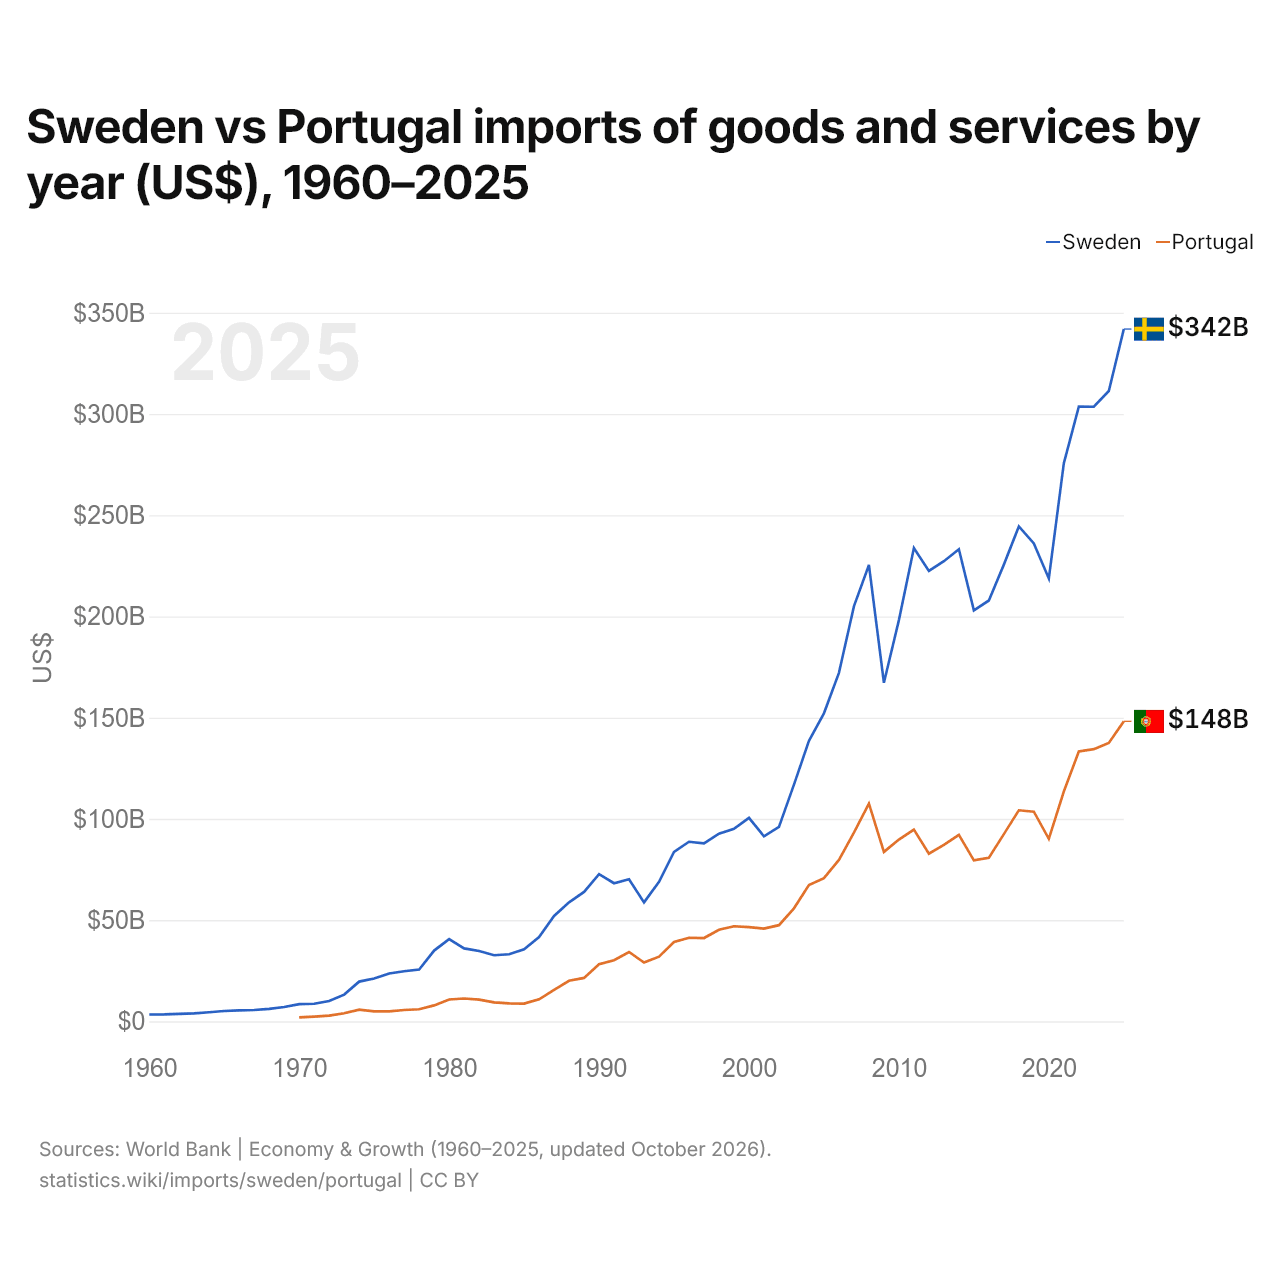
Suécia vs Portugal: importações de bens e serviços por ano (US$), 1960–2025
1x
| Ano | US$ | |
|---|---|---|
 Suécia |
 Portugal |
|
| 2025 | US$ 341.902.516.919 | US$ 148.156.593.238 |
| 2024 | US$ 311.306.792.242 | US$ 137.513.069.104 |
| 2023 | US$ 303.529.221.657 | US$ 134.411.585.081 |
| 2022 | US$ 303.635.821.943 | US$ 133.285.364.419 |
| 2021 | US$ 275.582.535.325 | US$ 113.497.070.631 |
| 2020 | US$ 218.725.234.276 | US$ 90.131.397.408 |
| 2019 | US$ 236.048.697.363 | US$ 103.532.874.929 |
| 2018 | US$ 244.417.315.964 | US$ 104.240.636.748 |
| 2017 | US$ 225.583.506.107 | US$ 92.464.542.115 |
| 2016 | US$ 207.862.500.839 | US$ 80.804.179.611 |
| 2015 | US$ 202.956.408.286 | US$ 79.509.937.177 |
| 2014 | US$ 233.195.472.530 | US$ 92.113.305.018 |
| 2013 | US$ 227.247.994.887 | US$ 87.194.990.738 |
| 2012 | US$ 222.449.369.430 | US$ 82.755.123.140 |
| 2011 | US$ 233.787.459.646 | US$ 94.725.068.832 |
| 2010 | US$ 198.157.087.923 | US$ 89.801.905.968 |
| 2009 | US$ 167.206.485.667 | US$ 83.673.807.857 |
| 2008 | US$ 225.371.485.791 | US$ 107.512.515.975 |
| 2007 | US$ 204.952.210.452 | US$ 93.196.905.901 |
| 2006 | US$ 172.103.900.680 | US$ 79.723.354.569 |
| 2005 | US$ 152.117.327.481 | US$ 70.735.904.961 |
| 2004 | US$ 138.501.544.449 | US$ 67.301.751.547 |
| 2003 | US$ 116.899.076.215 | US$ 55.799.780.174 |
| 2002 | US$ 96.049.747.872 | US$ 47.495.078.930 |
| 2001 | US$ 91.348.132.945 | US$ 45.789.575.479 |
| 2000 | US$ 100.499.443.365 | US$ 46.550.613.708 |
| 1999 | US$ 95.109.169.249 | US$ 46.950.345.046 |
| 1998 | US$ 92.655.630.888 | US$ 45.239.506.901 |
| 1997 | US$ 87.887.333.167 | US$ 41.132.256.146 |
| 1996 | US$ 88.694.154.489 | US$ 41.278.931.635 |
| 1995 | US$ 83.696.886.434 | US$ 39.151.232.586 |
| 1994 | US$ 68.924.572.317 | US$ 31.944.022.947 |
| 1993 | US$ 58.755.042.783 | US$ 29.049.311.807 |
| 1992 | US$ 70.211.547.443 | US$ 34.266.584.497 |
| 1991 | US$ 68.211.777.594 | US$ 30.177.947.829 |
| 1990 | US$ 72.704.404.947 | US$ 28.247.582.618 |
| 1989 | US$ 63.887.689.897 | US$ 21.452.554.113 |
| 1988 | US$ 58.782.877.823 | US$ 20.038.610.028 |
| 1987 | US$ 52.071.738.849 | US$ 15.532.868.934 |
| 1986 | US$ 41.574.831.686 | US$ 10.858.608.766 |
| 1985 | US$ 35.584.567.928 | US$ 8.751.378.986 |
| 1984 | US$ 33.130.075.921 | US$ 8.884.931.526 |
| 1983 | US$ 32.645.095.929 | US$ 9.363.968.512 |
| 1982 | US$ 34.770.640.977 | US$ 10.708.695.762 |
| 1981 | US$ 36.020.657.858 | US$ 11.270.547.231 |
| 1980 | US$ 40.613.126.300 | US$ 10.783.476.171 |
| 1979 | US$ 34.937.462.154 | US$ 7.863.475.410 |
| 1978 | US$ 25.608.957.619 | US$ 5.958.549.270 |
| 1977 | US$ 24.746.102.062 | US$ 5.594.295.443 |
| 1976 | US$ 23.627.331.206 | US$ 4.891.100.796 |
| 1975 | US$ 21.182.621.020 | US$ 4.943.349.020 |
| 1974 | US$ 19.623.805.920 | US$ 5.759.928.966 |
| 1973 | US$ 13.198.116.685 | US$ 3.968.323.794 |
| 1972 | US$ 10.009.365.236 | US$ 2.797.946.627 |
| 1971 | US$ 8.687.795.704 | US$ 2.302.600.707 |
| 1970 | US$ 8.470.278.358 | US$ 1.954.344.491 |
| 1969 | US$ 7.096.025.481 | - |
| 1968 | US$ 6.121.510.458 | - |
| 1967 | US$ 5.610.432.438 | - |
| 1966 | US$ 5.401.663.227 | - |
| 1965 | US$ 5.103.033.951 | - |
| 1964 | US$ 4.503.064.316 | - |
| 1963 | US$ 3.969.327.638 | - |
| 1962 | US$ 3.645.522.311 | - |
| 1961 | US$ 3.408.478.200 | - |
| 1960 | US$ 3.384.851.091 | - |
Em 2025, as importações de bens e serviços da Suécia foram de US$ 342 bilhões e as de Portugal, de US$ 148 bilhões: as da Suécia foram 2,3 vezes maiores. Em 1970, as importações da Suécia foram 4,3 vezes maiores: US$ 8,47 bilhões da Suécia e US$ 1,95 bilhão de Portugal.
As importações de bens e serviços da Suécia têm sido maiores que as de Portugal todos os anos desde 1970.
Suécia vs Portugal: dados de importações
|
Suécia
|
Portugal
|
|
|---|---|---|
| Importações | US$ 342 bi (2025) | US$ 148 bi (2025) |
| Posição mundial | 28/174 | 40/174 |
| Participação mundial | 1,01% | 0,44% |
| % do PIB | 51,1% | 42,7% |
| Maior categoria de bens | Máquinas, eletrônicos e veículos (40,3%, 2025) | Máquinas, eletrônicos e veículos (34%, 2025) |
| Principal origem dos bens | Alemanha (15,9%, 2025) | Espanha (32,8%, 2025) |
Comparar as importações de 2 países quaisquer
Fontes:
- Banco Mundial | Economy & Growth (1960–2025, atualizado em outubro de 2026)
- TradeMap (2001–2025, atualizado em outubro de 2026)
Creative Commons Atribuição (CC BY): você pode copiar, compartilhar, adaptar e reutilizar este conteúdo, inclusive para fins comerciais, desde que cite o statistics.wiki e indique as alterações que fizer. As fontes listadas acima podem ter suas próprias condições de licença.