
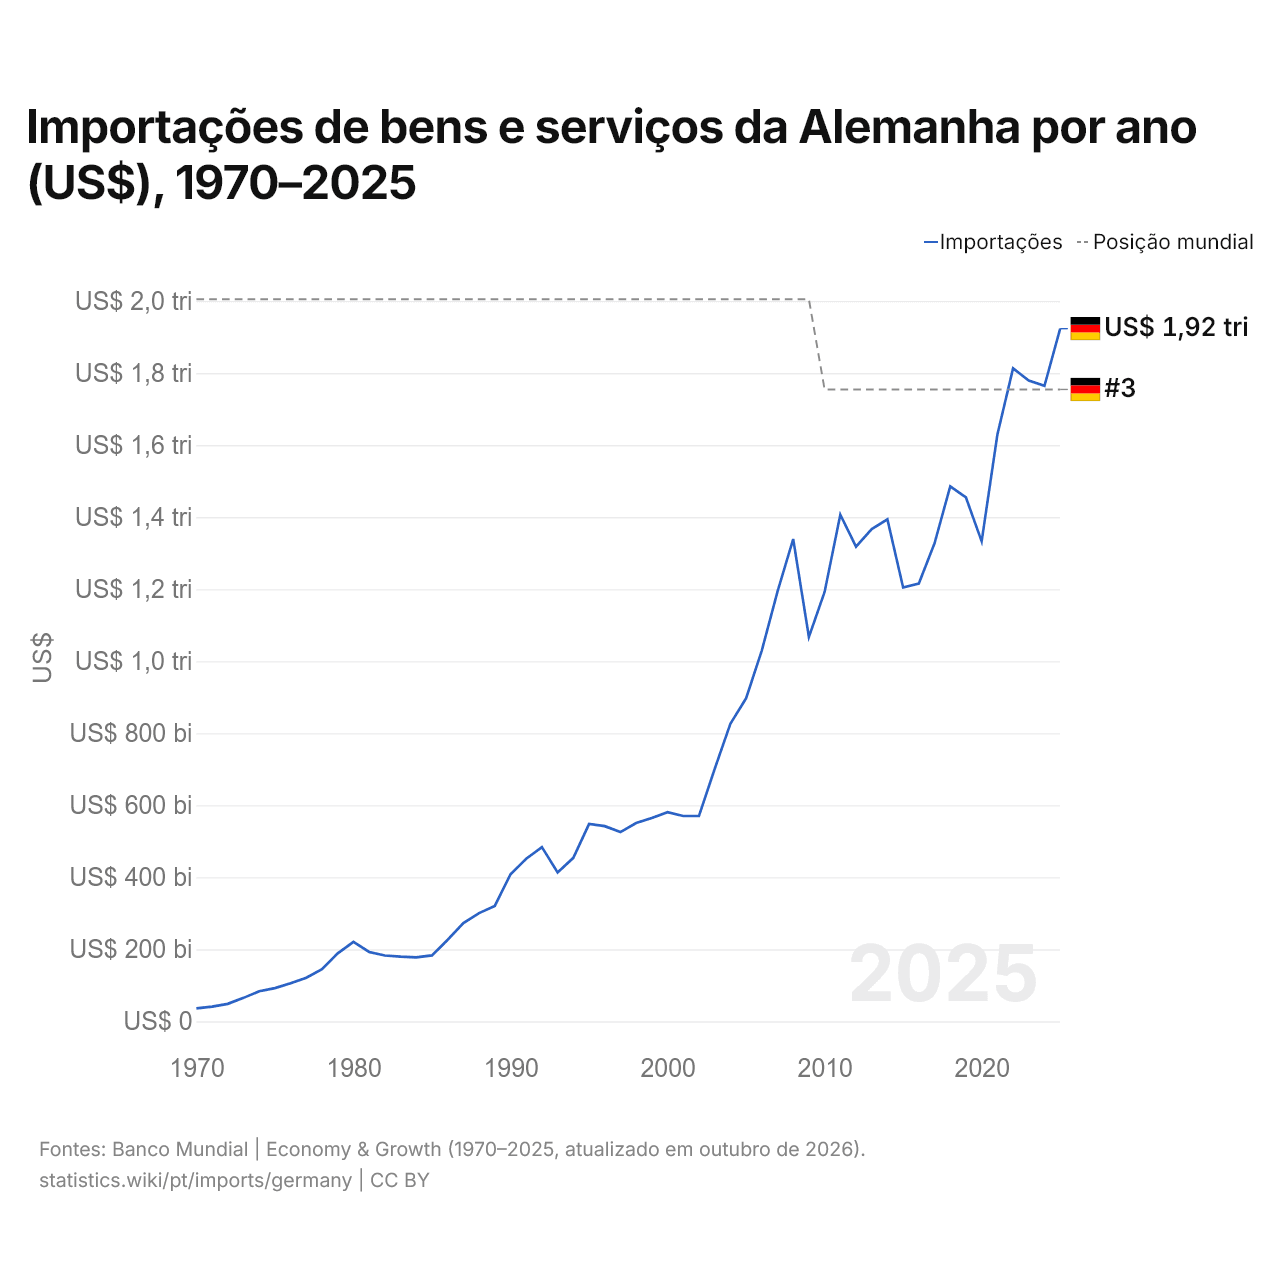
Importações de bens e serviços da Alemanha por ano (US$), 1970–2025
| Ano | US$ | Posição mundial |
|---|---|---|
| Importações | Posição mundial | |
| 2025 | US$ 1.923.292.318.697 | #3 |
| 2024 | US$ 1.764.438.191.611 | #3 |
| 2023 | US$ 1.779.045.873.341 | #3 |
| 2022 | US$ 1.813.049.636.002 | #3 |
| 2021 | US$ 1.628.851.031.194 | #3 |
| 2020 | US$ 1.332.733.837.256 | #3 |
| 2019 | US$ 1.454.588.084.839 | #3 |
| 2018 | US$ 1.485.437.649.158 | #3 |
| 2017 | US$ 1.327.357.307.454 | #3 |
| 2016 | US$ 1.215.609.853.746 | #3 |
| 2015 | US$ 1.204.648.073.432 | #3 |
| 2014 | US$ 1.393.837.781.387 | #3 |
| 2013 | US$ 1.366.940.257.620 | #3 |
| 2012 | US$ 1.317.969.624.115 | #3 |
| 2011 | US$ 1.406.669.611.897 | #3 |
| 2010 | US$ 1.192.329.684.250 | #3 |
| 2009 | US$ 1.067.378.170.076 | #2 |
| 2008 | US$ 1.339.125.795.808 | #2 |
| 2007 | US$ 1.193.186.147.673 | #2 |
| 2006 | US$ 1.029.339.915.529 | #2 |
| 2005 | US$ 896.950.519.583 | #2 |
| 2004 | US$ 826.352.918.672 | #2 |
| 2003 | US$ 700.765.174.545 | #2 |
| 2002 | US$ 570.622.539.400 | #2 |
| 2001 | US$ 570.228.511.977 | #2 |
| 2000 | US$ 580.553.292.712 | #2 |
| 1999 | US$ 564.301.984.739 | #2 |
| 1998 | US$ 550.595.754.140 | #2 |
| 1997 | US$ 525.385.743.289 | #2 |
| 1996 | US$ 541.957.369.379 | #2 |
| 1995 | US$ 547.772.621.810 | #2 |
| 1994 | US$ 453.912.257.442 | #2 |
| 1993 | US$ 413.095.942.269 | #2 |
| 1992 | US$ 483.833.437.696 | #2 |
| 1991 | US$ 451.492.044.785 | #2 |
| 1990 | US$ 408.062.314.490 | #2 |
| 1989 | US$ 320.659.348.799 | #2 |
| 1988 | US$ 300.437.976.389 | #2 |
| 1987 | US$ 272.758.220.892 | #2 |
| 1986 | US$ 226.641.451.860 | #2 |
| 1985 | US$ 182.999.144.300 | #2 |
| 1984 | US$ 177.813.724.143 | #2 |
| 1983 | US$ 179.485.369.590 | #2 |
| 1982 | US$ 182.672.746.836 | #2 |
| 1981 | US$ 192.540.531.372 | #2 |
| 1980 | US$ 220.826.310.523 | #2 |
| 1979 | US$ 188.647.315.121 | #2 |
| 1978 | US$ 144.746.943.525 | #2 |
| 1977 | US$ 120.869.841.658 | #2 |
| 1976 | US$ 105.524.313.345 | #2 |
| 1975 | US$ 92.240.550.918 | #2 |
| 1974 | US$ 83.360.334.820 | #2 |
| 1973 | US$ 65.139.754.848 | #2 |
| 1972 | US$ 48.517.046.556 | #2 |
| 1971 | US$ 40.715.115.151 | #2 |
| 1970 | US$ 35.798.334.313 | #2 |
Em 2025, as importações de bens e serviços da Alemanha foram de US$ 1,92 trilhão, ante US$ 35,8 bilhões em 1970. Foram as 3ª maiores do mundo, posição que mantêm desde 2010. Sua melhor posição foi o 2º lugar, ocupado pela última vez em 2009.
Em 2025, as importações de bens e serviços da Alemanha foram as maiores de 41 países da Europa. Em 2025, as exportações da Alemanha superaram as importações em US$ 119 bilhões, um superávit comercial. O comércio da Alemanha, exportações e importações somadas, equivaleu a 78,5% do seu PIB em 2025, o 94º lugar do mundo.
Importações de bens da Alemanha por categoria, 2025
Importações de bens, 2025: US$ 1,54 tri
Em 2025, a maior categoria das importações de bens da Alemanha foi máquinas, eletrônicos e veículos, com 42,1%, seguida de produtos químicos, farmacêuticos e plásticos, com 14,6%.
Origens das importações de bens da Alemanha: as 10 principais, 2025
| Posição | País | Importações de bens | Participação | |
|---|---|---|---|---|
| 1 |
 China |
US$ 194 bi | 12,6% | vs China |
| 2 |
 Estados Unidos |
US$ 103 bi | 6,68% | vs EUA |
| 3 |
 Países Baixos |
US$ 99,4 bi | 6,46% | vs Países Baixos |
| 4 |
 Polônia |
US$ 90,9 bi | 5,91% | vs Polônia |
| 5 |
 Itália |
US$ 81,9 bi | 5,32% | vs Itália |
| 6 |
 França |
US$ 78,0 bi | 5,07% | vs França |
| 7 |
 Tchéquia |
US$ 69,8 bi | 4,54% | vs Tchéquia |
| 8 |
 Suíça |
US$ 63,6 bi | 4,13% | vs Suíça |
| 9 |
 Áustria |
US$ 58,8 bi | 3,82% | vs Áustria |
| 10 |
 Bélgica |
US$ 49,6 bi | 3,22% | vs Bélgica |
| Outros parceiros e não especificados | US$ 650 bi | 42,3% |
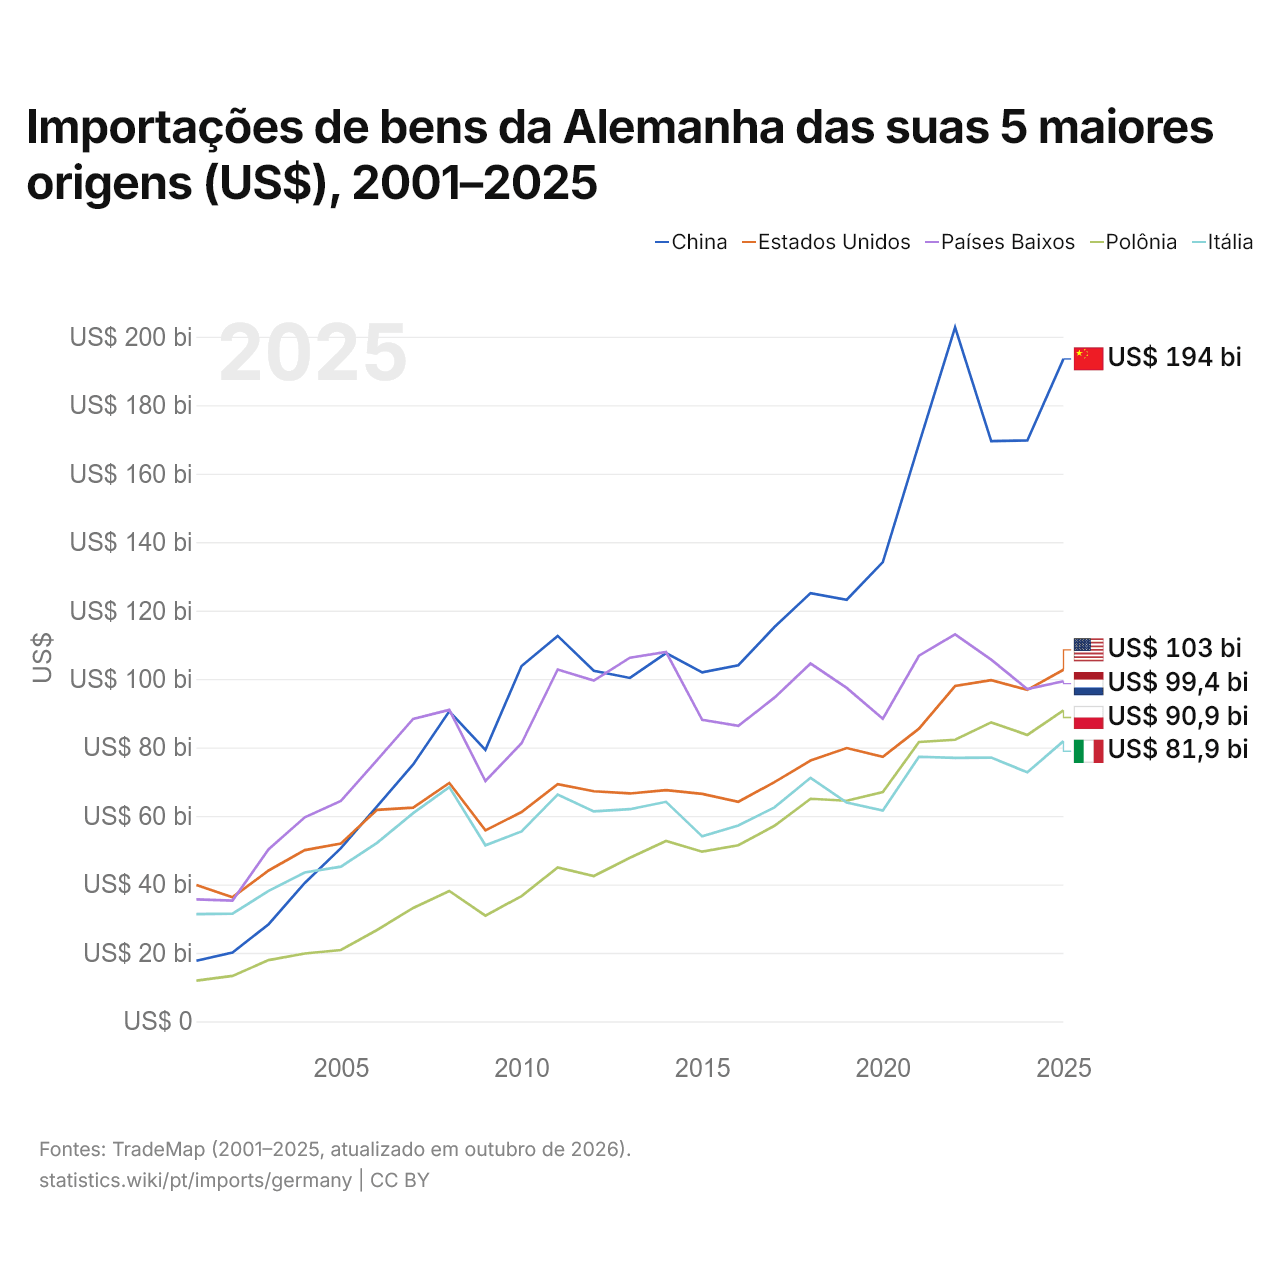
Importações de bens da Alemanha das suas 5 maiores origens (US$), 2001–2025
| Ano | US$ | ||||
|---|---|---|---|---|---|
| China | Estados Unidos | Países Baixos | Polônia | Itália | |
| 2025 | US$ 193.512.425.000 | US$ 102.716.345.000 | US$ 99.351.968.000 | US$ 90.871.922.000 | US$ 81.860.265.000 |
| 2024 | US$ 169.688.774.000 | US$ 96.824.170.000 | US$ 97.046.177.000 | US$ 83.662.341.000 | US$ 72.739.498.000 |
| 2023 | US$ 169.485.464.000 | US$ 99.650.221.000 | US$ 105.674.651.000 | US$ 87.335.325.000 | US$ 77.037.685.000 |
| 2022 | US$ 202.741.772.000 | US$ 97.955.619.000 | US$ 113.051.580.000 | US$ 82.245.781.000 | US$ 76.978.106.000 |
| 2021 | US$ 168.692.766.000 | US$ 85.497.357.000 | US$ 106.812.348.000 | US$ 81.596.754.000 | US$ 77.285.599.000 |
| 2020 | US$ 134.141.333.000 | US$ 77.285.597.000 | US$ 88.392.884.000 | US$ 66.954.000.000 | US$ 61.596.997.000 |
| 2019 | US$ 123.165.529.000 | US$ 79.839.832.000 | US$ 97.396.130.000 | US$ 64.435.078.000 | US$ 63.901.631.000 |
| 2018 | US$ 125.101.066.000 | US$ 76.179.360.000 | US$ 104.529.826.000 | US$ 65.020.284.000 | US$ 71.146.737.000 |
| 2017 | US$ 115.183.864.000 | US$ 69.868.049.000 | US$ 94.549.488.000 | US$ 57.121.975.000 | US$ 62.503.877.000 |
| 2016 | US$ 104.014.508.000 | US$ 64.142.420.000 | US$ 86.331.047.000 | US$ 51.435.745.000 | US$ 57.215.601.000 |
| 2015 | US$ 101.946.561.000 | US$ 66.428.354.000 | US$ 88.068.305.000 | US$ 49.567.310.000 | US$ 54.036.205.000 |
| 2014 | US$ 107.580.164.000 | US$ 67.526.624.000 | US$ 107.890.328.000 | US$ 52.677.854.000 | US$ 64.128.499.000 |
| 2013 | US$ 100.312.728.000 | US$ 66.571.065.000 | US$ 106.236.197.000 | US$ 47.804.573.000 | US$ 61.971.043.000 |
| 2012 | US$ 102.393.093.000 | US$ 67.205.165.000 | US$ 99.542.585.000 | US$ 42.449.937.000 | US$ 61.328.020.000 |
| 2011 | US$ 112.601.120.000 | US$ 69.261.437.000 | US$ 102.777.849.000 | US$ 44.940.677.000 | US$ 66.246.065.000 |
| 2010 | US$ 103.800.346.000 | US$ 61.153.544.000 | US$ 81.234.573.000 | US$ 36.590.217.000 | US$ 55.469.075.000 |
| 2009 | US$ 79.318.156.000 | US$ 55.787.029.000 | US$ 70.206.793.000 | US$ 30.865.755.000 | US$ 51.437.324.000 |
| 2008 | US$ 90.582.734.000 | US$ 69.639.043.000 | US$ 90.988.223.000 | US$ 38.082.581.000 | US$ 68.417.391.000 |
| 2007 | US$ 75.047.643.000 | US$ 62.436.453.000 | US$ 88.335.346.000 | US$ 33.121.522.000 | US$ 60.806.508.000 |
| 2006 | US$ 62.805.681.000 | US$ 61.792.385.000 | US$ 76.303.973.000 | US$ 26.679.809.000 | US$ 52.122.536.000 |
| 2005 | US$ 50.594.705.000 | US$ 51.928.023.000 | US$ 64.375.190.000 | US$ 20.841.689.000 | US$ 45.183.458.000 |
| 2004 | US$ 40.442.316.000 | US$ 50.013.340.000 | US$ 59.599.817.000 | US$ 19.826.755.000 | US$ 43.487.077.000 |
| 2003 | US$ 28.372.814.000 | US$ 44.063.978.000 | US$ 50.266.046.000 | US$ 17.887.035.000 | US$ 38.102.920.000 |
| 2002 | US$ 20.076.230.000 | US$ 36.277.168.000 | US$ 35.269.000.000 | US$ 13.270.872.000 | US$ 31.455.606.000 |
| 2001 | US$ 17.689.098.000 | US$ 39.831.645.000 | US$ 35.622.414.000 | US$ 11.908.058.000 | US$ 31.300.599.000 |
Em 2025, as importações de bens foram de US$ 194 bilhões da China, US$ 103 bilhões dos Estados Unidos, US$ 99,4 bilhões dos Países Baixos, US$ 90,9 bilhões da Polônia e US$ 81,9 bilhões da Itália. O primeiro lugar dos cinco fornecedores da Alemanha fica com a China desde 2015. A mudança mais recente nessa ordem foi em 2025, quando as importações da Alemanha vindas dos Estados Unidos superaram as vindas dos Países Baixos.
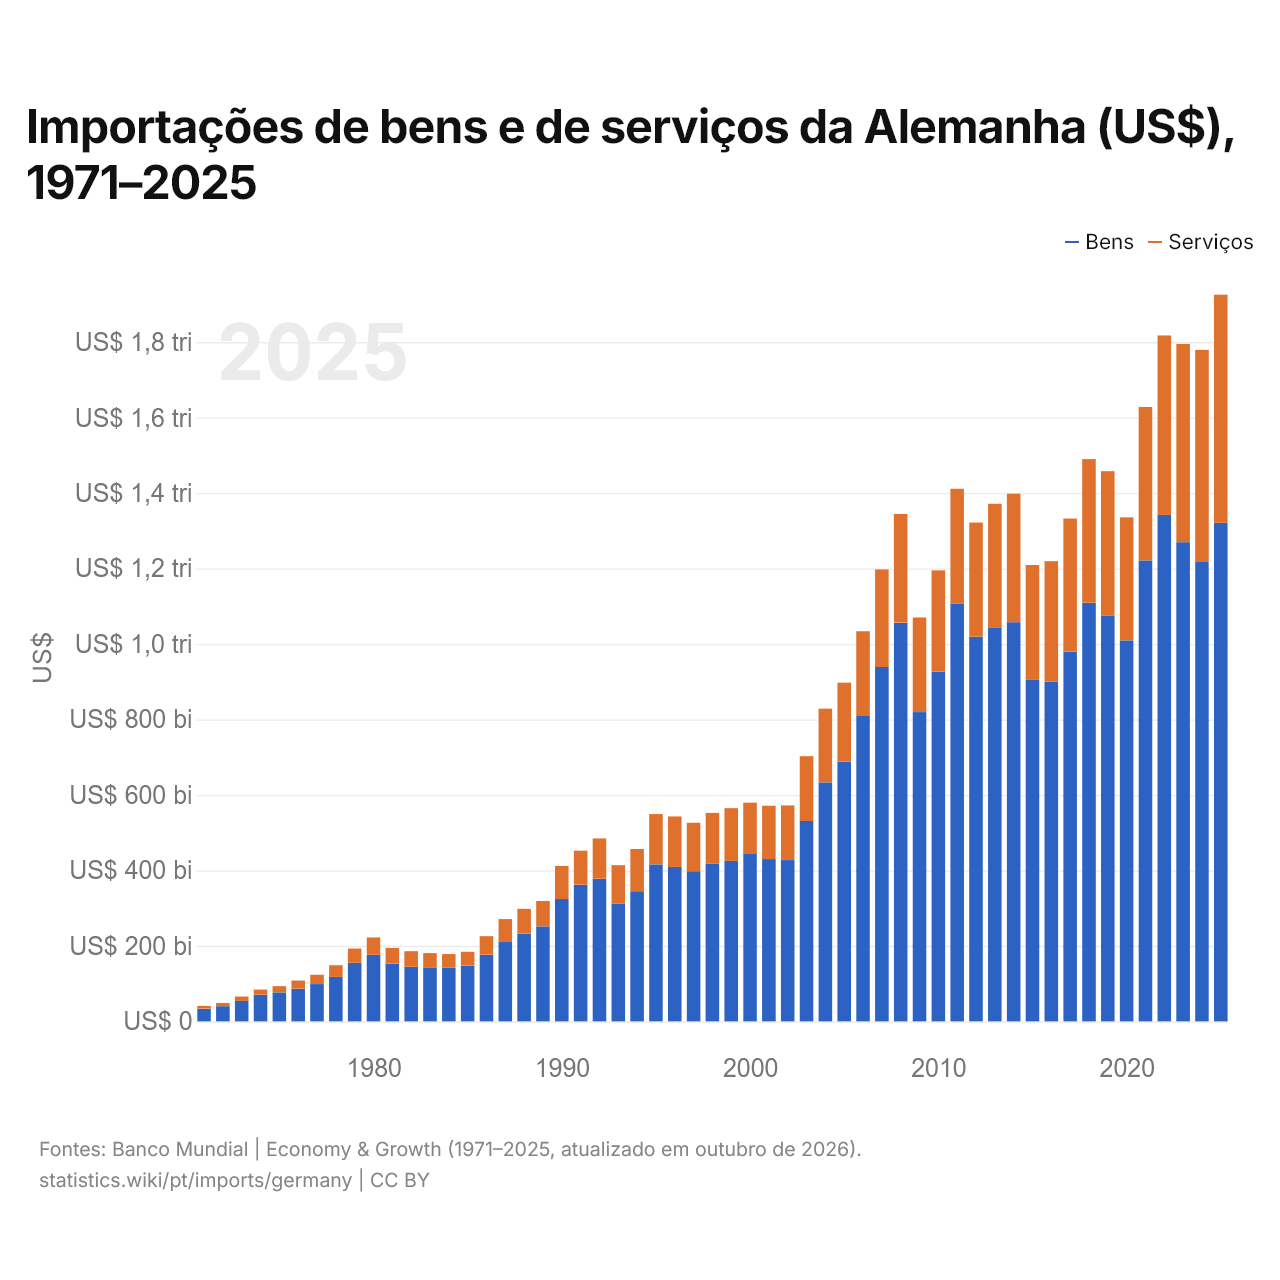
Importações de bens e de serviços da Alemanha (US$), 1971–2025
| Ano | US$ | |
|---|---|---|
| Bens | Serviços | |
| 2025 | US$ 1.320.914.761.786 | US$ 604.669.398.847 |
| 2024 | US$ 1.217.278.046.392 | US$ 561.928.299.276 |
| 2023 | US$ 1.269.768.976.501 | US$ 525.150.995.913 |
| 2022 | US$ 1.341.889.746.929 | US$ 475.624.779.836 |
| 2021 | US$ 1.221.286.829.748 | US$ 406.736.332.274 |
| 2020 | US$ 1.009.462.854.525 | US$ 326.107.175.727 |
| 2019 | US$ 1.075.675.077.491 | US$ 382.277.665.363 |
| 2018 | US$ 1.109.636.300.370 | US$ 380.316.679.543 |
| 2017 | US$ 979.680.850.208 | US$ 352.651.882.436 |
| 2016 | US$ 899.827.457.943 | US$ 319.620.242.918 |
| 2015 | US$ 904.611.684.679 | US$ 304.673.626.075 |
| 2014 | US$ 1.057.642.315.574 | US$ 340.735.932.017 |
| 2013 | US$ 1.042.425.236.209 | US$ 328.962.626.299 |
| 2012 | US$ 1.019.424.039.461 | US$ 302.395.482.854 |
| 2011 | US$ 1.107.458.251.083 | US$ 303.746.447.013 |
| 2010 | US$ 926.733.952.705 | US$ 268.387.217.986 |
| 2009 | US$ 819.500.912.900 | US$ 250.641.503.297 |
| 2008 | US$ 1.056.774.019.225 | US$ 287.653.371.127 |
| 2007 | US$ 939.040.174.630 | US$ 258.551.475.182 |
| 2006 | US$ 809.141.918.227 | US$ 224.501.381.304 |
| 2005 | US$ 688.153.163.414 | US$ 209.317.371.739 |
| 2004 | US$ 633.210.896.333 | US$ 195.388.959.352 |
| 2003 | US$ 530.930.432.507 | US$ 171.704.152.370 |
| 2002 | US$ 427.290.914.626 | US$ 144.904.912.004 |
| 2001 | US$ 430.014.719.046 | US$ 141.184.748.697 |
| 2000 | US$ 443.332.114.445 | US$ 136.200.123.296 |
| 1999 | US$ 425.158.289.658 | US$ 139.590.827.497 |
| 1998 | US$ 418.562.704.076 | US$ 133.948.863.168 |
| 1997 | US$ 397.560.043.675 | US$ 128.714.656.854 |
| 1996 | US$ 409.297.640.246 | US$ 133.725.697.181 |
| 1995 | US$ 415.917.960.314 | US$ 133.256.367.404 |
| 1994 | US$ 344.791.440.541 | US$ 111.778.294.850 |
| 1993 | US$ 311.437.741.136 | US$ 102.459.589.465 |
| 1992 | US$ 378.251.074.338 | US$ 106.374.086.091 |
| 1991 | US$ 361.924.356.990 | US$ 90.424.916.886 |
| 1990 | US$ 324.090.630.345 | US$ 87.423.723.511 |
| 1989 | US$ 251.415.586.684 | US$ 67.544.519.181 |
| 1988 | US$ 232.241.273.898 | US$ 65.885.395.934 |
| 1987 | US$ 210.101.102.410 | US$ 60.811.022.255 |
| 1986 | US$ 176.564.594.846 | US$ 49.202.620.545 |
| 1985 | US$ 147.344.603.172 | US$ 37.031.940.770 |
| 1984 | US$ 141.972.567.593 | US$ 36.132.110.191 |
| 1983 | US$ 141.489.121.690 | US$ 39.337.808.555 |
| 1982 | US$ 144.464.131.208 | US$ 41.418.410.702 |
| 1981 | US$ 152.973.608.901 | US$ 41.549.965.540 |
| 1980 | US$ 176.206.367.466 | US$ 46.065.822.968 |
| 1979 | US$ 155.122.775.542 | US$ 37.613.841.247 |
| 1978 | US$ 117.852.250.311 | US$ 30.654.092.057 |
| 1977 | US$ 98.779.950.214 | US$ 24.658.057.021 |
| 1976 | US$ 86.401.138.733 | US$ 21.528.683.073 |
| 1975 | US$ 76.373.287.057 | US$ 16.896.565.707 |
| 1974 | US$ 70.515.243.833 | US$ 13.572.276.540 |
| 1973 | US$ 54.178.797.389 | US$ 11.562.407.243 |
| 1972 | US$ 40.192.661.414 | US$ 8.535.585.759 |
| 1971 | US$ 33.863.466.609 | US$ 7.187.804.761 |
Em 2025, as importações de bens da Alemanha foram de US$ 1,32 trilhão e as de serviços, de US$ 605 bilhões; os serviços representaram 31,4% do total, ante 17,5% em 1971.
A Alemanha na classificação mundial de importações, 2025




Importações de bens e serviços da Alemanha, % do PIB, 1970–2025
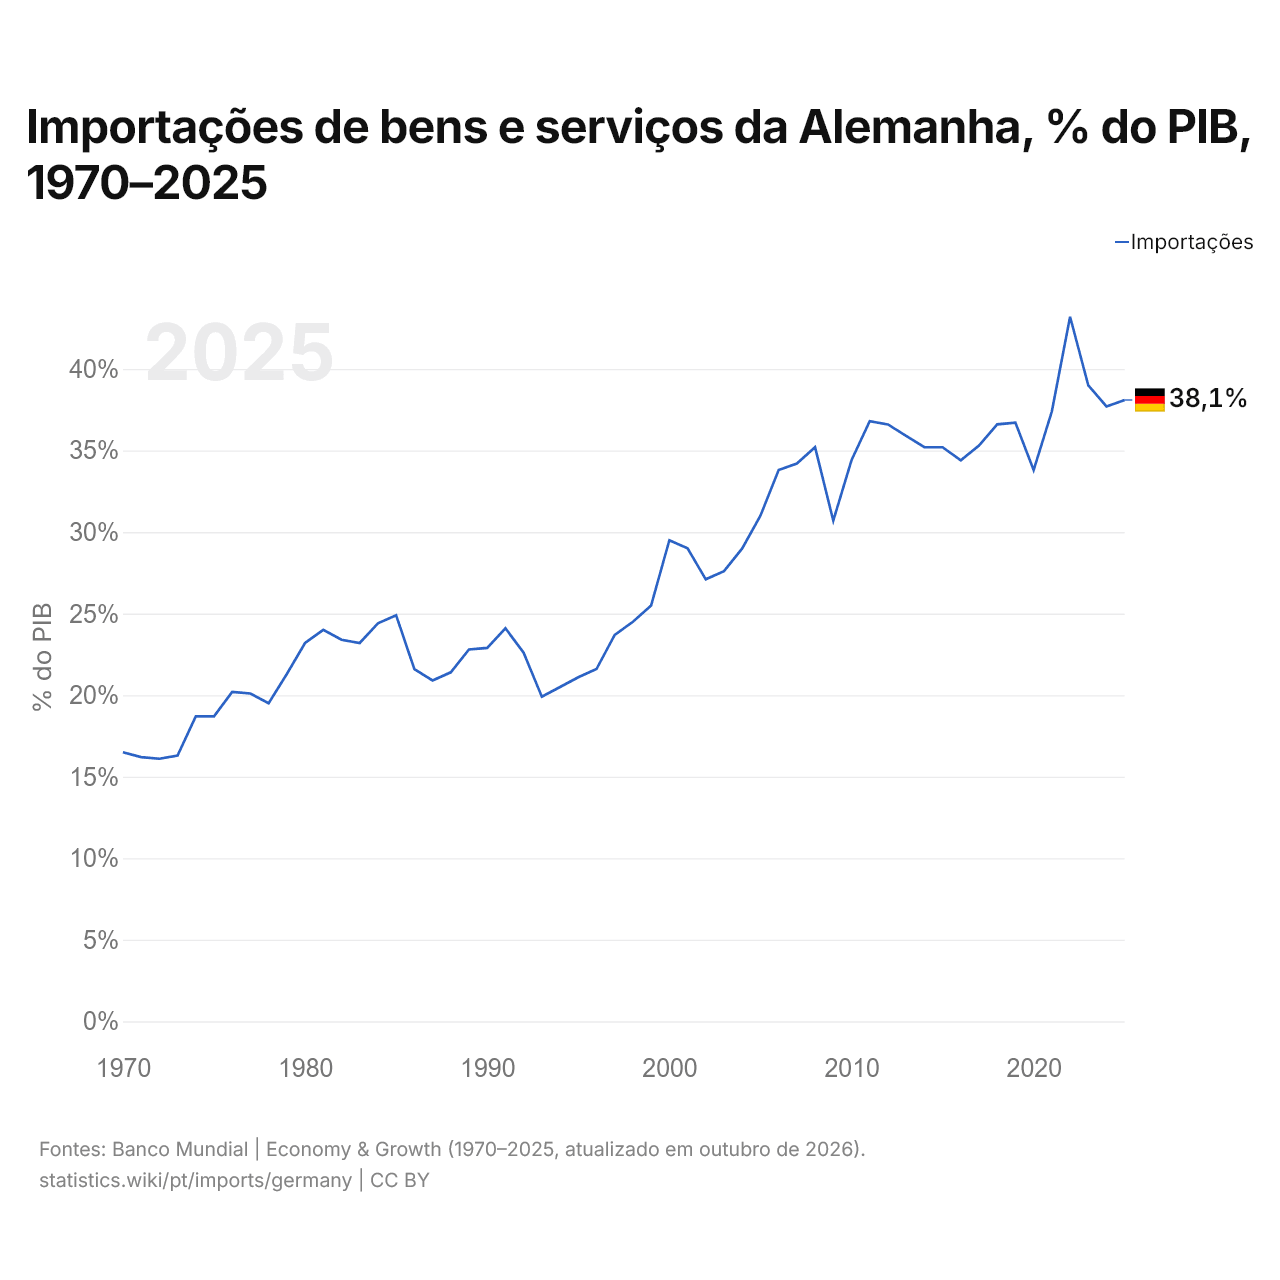
Em 2025, as importações de bens e serviços da Alemanha equivaleram a 38,1% do seu PIB, ante 16,5% em 1970. A maior participação foi de 43,2%, em 2022.
Comparar as importações da Alemanha com as de outros países
Fontes:
- TradeMap (2001–2025, atualizado em outubro de 2026)
- Banco Mundial | Economy & Growth (1970–2025, atualizado em outubro de 2026)
Creative Commons Atribuição (CC BY): você pode copiar, compartilhar, adaptar e reutilizar este conteúdo, inclusive para fins comerciais, desde que cite o statistics.wiki e indique as alterações que fizer. As fontes listadas acima podem ter suas próprias condições de licença.