
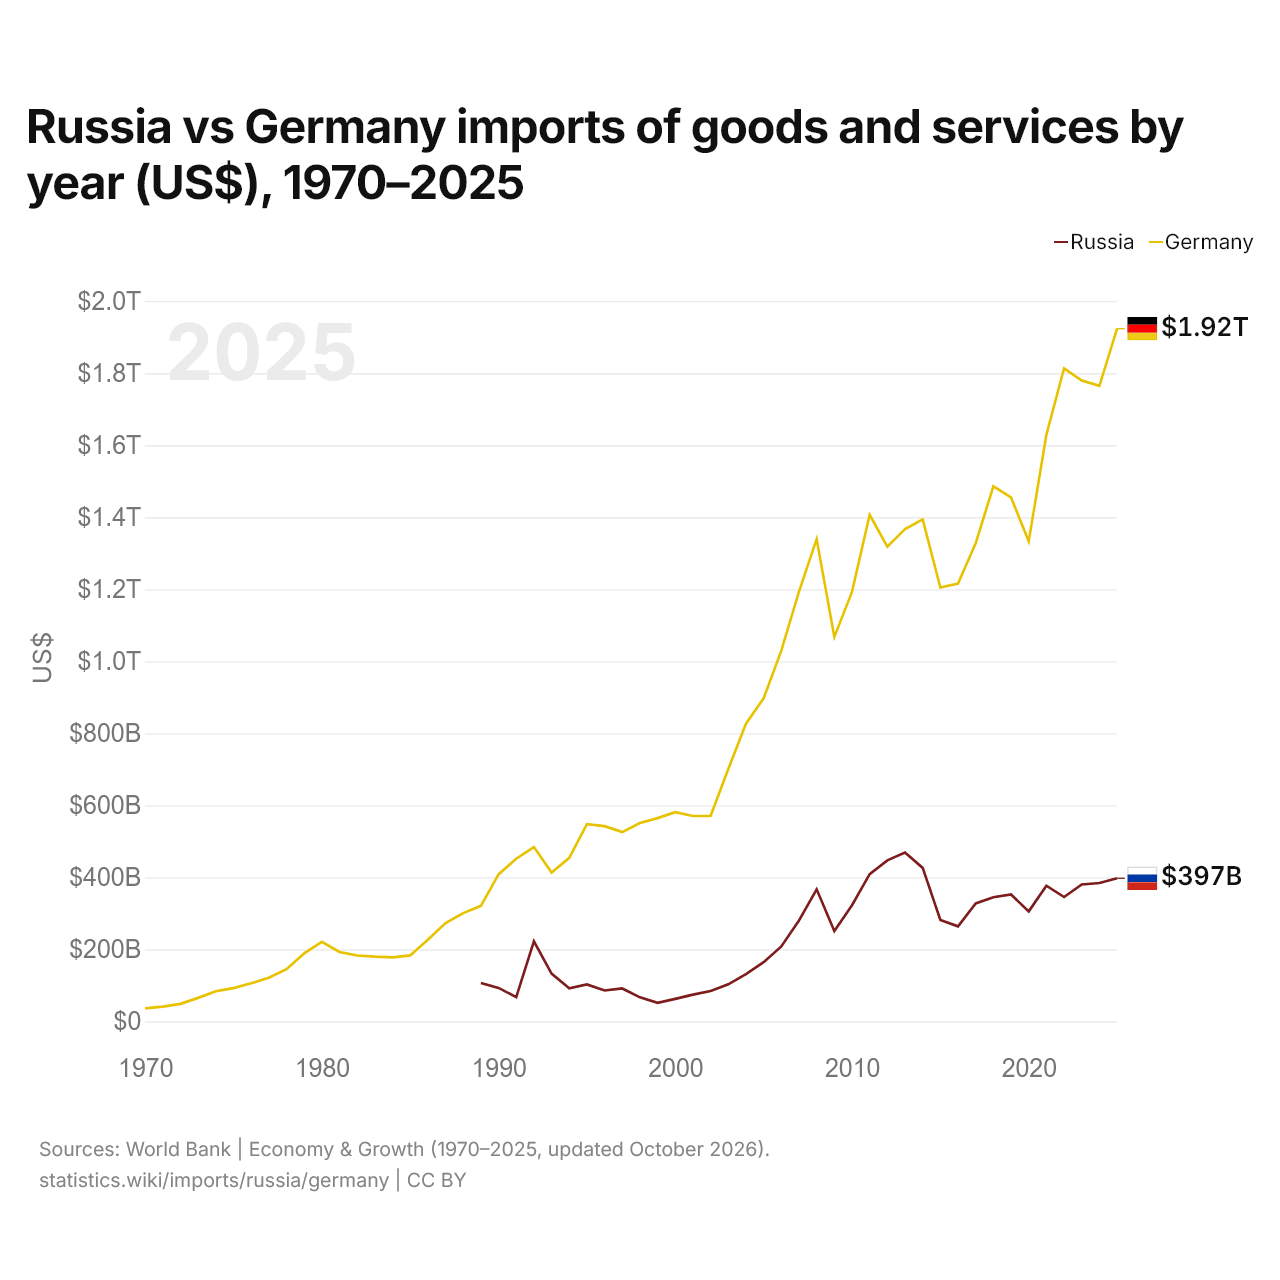
Rússia vs Alemanha: importações de bens e serviços por ano (US$), 1970–2025
1x
| Ano | US$ | |
|---|---|---|
 Rússia |
 Alemanha |
|
| 2025 | US$ 397.181.687.664 | US$ 1.923.292.318.697 |
| 2024 | US$ 383.987.377.510 | US$ 1.764.438.191.611 |
| 2023 | US$ 379.986.343.206 | US$ 1.779.045.873.341 |
| 2022 | US$ 345.173.687.962 | US$ 1.813.049.636.002 |
| 2021 | US$ 376.515.695.621 | US$ 1.628.851.031.194 |
| 2020 | US$ 305.255.226.177 | US$ 1.332.733.837.256 |
| 2019 | US$ 352.088.733.269 | US$ 1.454.588.084.839 |
| 2018 | US$ 344.519.598.182 | US$ 1.485.437.649.158 |
| 2017 | US$ 327.207.464.722 | US$ 1.327.357.307.454 |
| 2016 | US$ 263.830.495.059 | US$ 1.215.609.853.746 |
| 2015 | US$ 281.640.332.373 | US$ 1.204.648.073.432 |
| 2014 | US$ 426.062.113.845 | US$ 1.393.837.781.387 |
| 2013 | US$ 468.622.436.736 | US$ 1.366.940.257.620 |
| 2012 | US$ 447.048.493.878 | US$ 1.317.969.624.115 |
| 2011 | US$ 408.776.142.105 | US$ 1.406.669.611.897 |
| 2010 | US$ 322.366.550.354 | US$ 1.192.329.684.250 |
| 2009 | US$ 250.605.238.920 | US$ 1.067.378.170.076 |
| 2008 | US$ 366.597.425.851 | US$ 1.339.125.795.808 |
| 2007 | US$ 279.982.932.542 | US$ 1.193.186.147.673 |
| 2006 | US$ 207.914.704.587 | US$ 1.029.339.915.529 |
| 2005 | US$ 164.341.230.419 | US$ 896.950.519.583 |
| 2004 | US$ 130.992.710.864 | US$ 826.352.918.672 |
| 2003 | US$ 102.759.593.086 | US$ 700.765.174.545 |
| 2002 | US$ 84.408.293.461 | US$ 570.622.539.400 |
| 2001 | US$ 74.250.942.749 | US$ 570.228.511.977 |
| 2000 | US$ 62.417.348.027 | US$ 580.553.292.712 |
| 1999 | US$ 51.275.385.865 | US$ 564.301.984.739 |
| 1998 | US$ 66.522.411.128 | US$ 550.595.754.140 |
| 1997 | US$ 91.218.668.971 | US$ 525.385.743.289 |
| 1996 | US$ 85.589.979.710 | US$ 541.957.369.379 |
| 1995 | US$ 102.419.980.064 | US$ 547.772.621.810 |
| 1994 | US$ 91.639.498.027 | US$ 453.912.257.442 |
| 1993 | US$ 132.673.769.660 | US$ 413.095.942.269 |
| 1992 | US$ 222.111.380.145 | US$ 483.833.437.696 |
| 1991 | US$ 67.259.259.259 | US$ 451.492.044.785 |
| 1990 | US$ 92.776.886.035 | US$ 408.062.314.490 |
| 1989 | US$ 106.454.465.075 | US$ 320.659.348.799 |
| 1988 | - | US$ 300.437.976.389 |
| 1987 | - | US$ 272.758.220.892 |
| 1986 | - | US$ 226.641.451.860 |
| 1985 | - | US$ 182.999.144.300 |
| 1984 | - | US$ 177.813.724.143 |
| 1983 | - | US$ 179.485.369.590 |
| 1982 | - | US$ 182.672.746.836 |
| 1981 | - | US$ 192.540.531.372 |
| 1980 | - | US$ 220.826.310.523 |
| 1979 | - | US$ 188.647.315.121 |
| 1978 | - | US$ 144.746.943.525 |
| 1977 | - | US$ 120.869.841.658 |
| 1976 | - | US$ 105.524.313.345 |
| 1975 | - | US$ 92.240.550.918 |
| 1974 | - | US$ 83.360.334.820 |
| 1973 | - | US$ 65.139.754.848 |
| 1972 | - | US$ 48.517.046.556 |
| 1971 | - | US$ 40.715.115.151 |
| 1970 | - | US$ 35.798.334.313 |
Em 2025, as importações de bens e serviços da Rússia foram de US$ 397 bilhões e as da Alemanha, de US$ 1,92 trilhão: as da Alemanha foram 4,8 vezes maiores. Em 1989, as importações da Alemanha foram 3,0 vezes maiores: US$ 106 bilhões da Rússia e US$ 321 bilhões da Alemanha.
As importações de bens e serviços da Alemanha têm sido maiores que as da Rússia todos os anos desde 1989.
Rússia vs Alemanha: dados de importações
|
Rússia
|
Alemanha
|
|
|---|---|---|
| Importações | US$ 397 bi (2025) | US$ 1,92 tri (2025) |
| Posição mundial | 25/174 | 3/174 |
| Participação mundial | 1,18% | 5,7% |
| % do PIB | 15,5% | 38,1% |
| Maior categoria de bens | Máquinas, eletrônicos e veículos (45,2%, 2021) | Máquinas, eletrônicos e veículos (42,1%, 2025) |
| Principal origem dos bens | China (24,8%, 2021) | China (12,6%, 2025) |
Comparar as importações de 2 países quaisquer
Fontes:
- Banco Mundial | Economy & Growth (1970–2025, atualizado em outubro de 2026)
- TradeMap (2001–2025, atualizado em outubro de 2026)
Creative Commons Atribuição (CC BY): você pode copiar, compartilhar, adaptar e reutilizar este conteúdo, inclusive para fins comerciais, desde que cite o statistics.wiki e indique as alterações que fizer. As fontes listadas acima podem ter suas próprias condições de licença.