
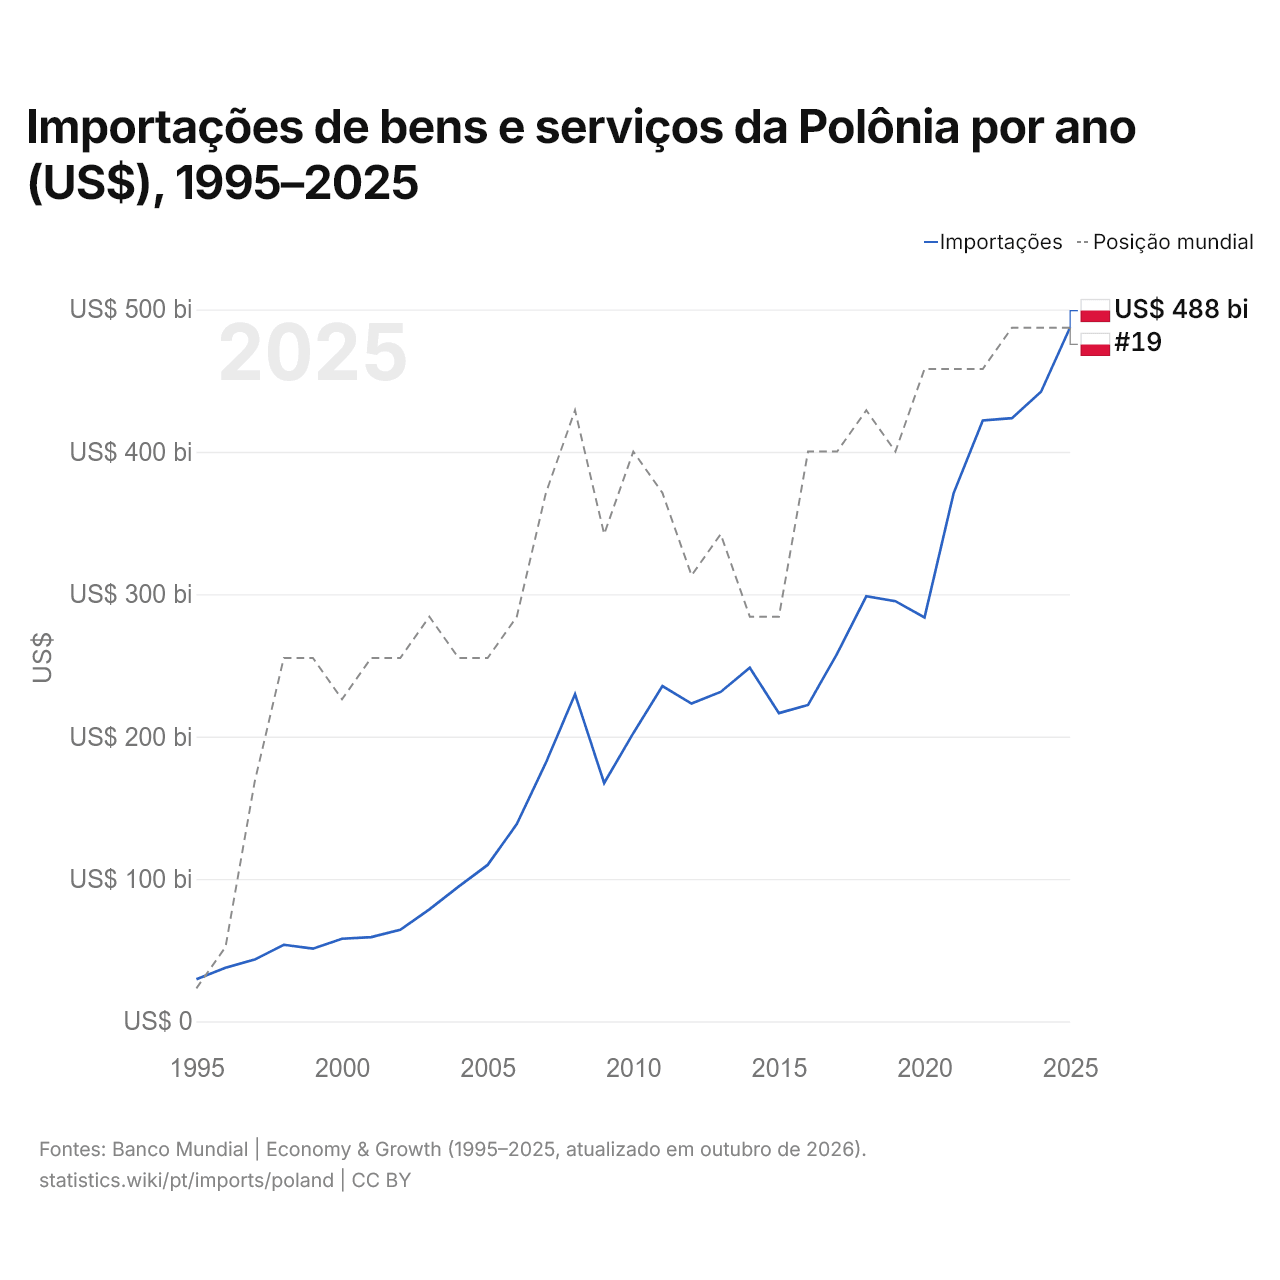
Importações de bens e serviços da Polônia por ano (US$), 1995–2025
| Ano | US$ | Posição mundial |
|---|---|---|
| Importações | Posição mundial | |
| 2025 | US$ 487.505.567.678 | #19 |
| 2024 | US$ 442.176.791.004 | #19 |
| 2023 | US$ 423.641.820.629 | #19 |
| 2022 | US$ 422.016.820.864 | #20 |
| 2021 | US$ 371.023.800.787 | #20 |
| 2020 | US$ 283.720.588.327 | #20 |
| 2019 | US$ 295.123.034.348 | #22 |
| 2018 | US$ 298.556.337.609 | #21 |
| 2017 | US$ 258.225.723.957 | #22 |
| 2016 | US$ 222.240.229.807 | #22 |
| 2015 | US$ 216.474.598.753 | #26 |
| 2014 | US$ 248.369.810.895 | #26 |
| 2013 | US$ 231.368.432.176 | #24 |
| 2012 | US$ 223.205.473.782 | #25 |
| 2011 | US$ 235.449.472.940 | #23 |
| 2010 | US$ 202.402.082.712 | #22 |
| 2009 | US$ 167.382.446.055 | #24 |
| 2008 | US$ 229.809.209.702 | #21 |
| 2007 | US$ 181.658.989.505 | #23 |
| 2006 | US$ 138.506.966.129 | #26 |
| 2005 | US$ 109.863.040.541 | #27 |
| 2004 | US$ 94.612.868.072 | #27 |
| 2003 | US$ 78.626.922.854 | #26 |
| 2002 | US$ 64.248.499.951 | #27 |
| 2001 | US$ 59.122.352.769 | #27 |
| 2000 | US$ 58.004.291.228 | #28 |
| 1999 | US$ 51.042.724.322 | #27 |
| 1998 | US$ 53.786.614.490 | #27 |
| 1997 | US$ 43.365.153.210 | #30 |
| 1996 | US$ 37.618.411.780 | #34 |
| 1995 | US$ 29.569.691.829 | #35 |
Em 2025, as importações de bens e serviços da Polônia foram de US$ 488 bilhões, ante US$ 29,6 bilhões em 1995. Foram as 19ª maiores do mundo, posição que mantêm desde 2023.
Em 2025, as importações de bens e serviços da Polônia foram as 10ª maiores de 41 países da Europa. Em 2025, as exportações da Polônia superaram as importações em US$ 29,7 bilhões, um superávit comercial. O comércio da Polônia, exportações e importações somadas, equivaleu a 97,0% do seu PIB em 2025, o 63º lugar do mundo.
Importações de bens da Polônia por categoria, 2025
Importações de bens, 2025: US$ 423 bi
Em 2025, a maior categoria das importações de bens da Polônia foi máquinas, eletrônicos e veículos, com 39,2%, seguida de produtos químicos, farmacêuticos e plásticos, com 13,5%.
Origens das importações de bens da Polônia: as 10 principais, 2025
| Posição | País | Importações de bens | Participação | |
|---|---|---|---|---|
| 1 |
 Alemanha |
US$ 80,7 bi | 19,1% | vs Alemanha |
| 2 |
 China |
US$ 65,4 bi | 15,5% | vs China |
| 3 |
 Itália |
US$ 20,0 bi | 4,74% | vs Itália |
| 4 |
 Estados Unidos |
US$ 19,9 bi | 4,7% | |
| 5 |
 Países Baixos |
US$ 16,3 bi | 3,86% | vs Países Baixos |
| 6 |
 França |
US$ 14,3 bi | 3,38% | vs França |
| 7 |
 Tchéquia |
US$ 14,0 bi | 3,31% | vs Tchéquia |
| 8 |
 Coreia do Sul |
US$ 11,4 bi | 2,71% | vs Coreia do Sul |
| 9 |
 Espanha |
US$ 9,13 bi | 2,16% | vs Espanha |
| 10 |
 Turquia |
US$ 8,89 bi | 2,1% | vs Turquia |
| Outros parceiros e não especificados | US$ 163 bi | 38,5% |
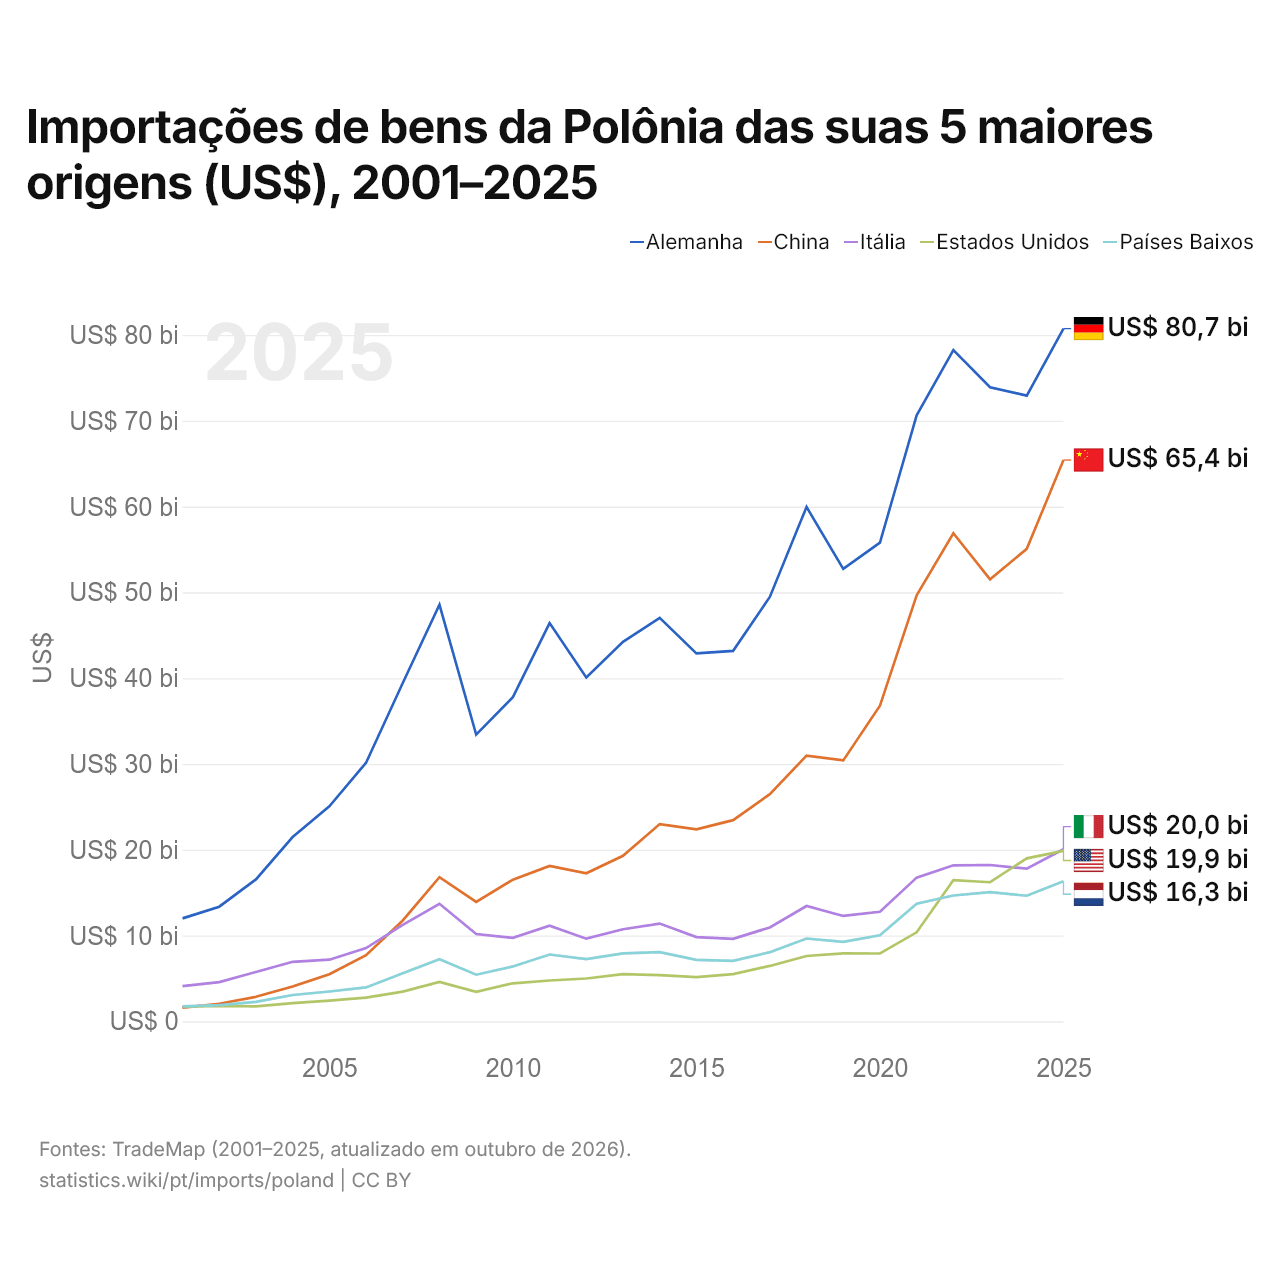
Importações de bens da Polônia das suas 5 maiores origens (US$), 2001–2025
| Ano | US$ | ||||
|---|---|---|---|---|---|
| Alemanha | China | Itália | Estados Unidos | Países Baixos | |
| 2025 | US$ 80.740.339.000 | US$ 65.424.322.000 | US$ 20.049.889.000 | US$ 19.865.994.000 | US$ 16.335.424.000 |
| 2024 | US$ 72.930.080.000 | US$ 55.071.605.000 | US$ 17.793.148.000 | US$ 18.998.506.000 | US$ 14.635.518.000 |
| 2023 | US$ 73.912.545.000 | US$ 51.523.648.000 | US$ 18.219.734.000 | US$ 16.215.490.000 | US$ 15.052.940.000 |
| 2022 | US$ 78.239.071.000 | US$ 56.887.664.000 | US$ 18.180.629.000 | US$ 16.460.941.000 | US$ 14.663.140.000 |
| 2021 | US$ 70.635.849.000 | US$ 49.662.974.000 | US$ 16.750.365.000 | US$ 10.371.595.000 | US$ 13.714.264.000 |
| 2020 | US$ 55.799.655.000 | US$ 36.790.015.000 | US$ 12.768.537.000 | US$ 7.903.930.000 | US$ 10.028.121.000 |
| 2019 | US$ 52.736.101.000 | US$ 30.414.556.000 | US$ 12.283.565.000 | US$ 7.922.380.000 | US$ 9.260.758.000 |
| 2018 | US$ 59.956.977.000 | US$ 30.972.444.000 | US$ 13.442.510.000 | US$ 7.615.877.000 | US$ 9.653.523.000 |
| 2017 | US$ 49.468.647.000 | US$ 26.474.287.000 | US$ 10.941.926.000 | US$ 6.458.293.000 | US$ 8.065.242.000 |
| 2016 | US$ 43.177.701.000 | US$ 23.447.667.000 | US$ 9.615.709.000 | US$ 5.504.638.000 | US$ 7.047.477.000 |
| 2015 | US$ 42.886.470.000 | US$ 22.380.369.000 | US$ 9.822.620.000 | US$ 5.153.019.000 | US$ 7.168.026.000 |
| 2014 | US$ 47.026.899.000 | US$ 22.992.572.000 | US$ 11.393.121.000 | US$ 5.386.900.000 | US$ 8.060.601.000 |
| 2013 | US$ 44.229.674.000 | US$ 19.300.516.000 | US$ 10.735.741.000 | US$ 5.496.958.000 | US$ 7.913.385.000 |
| 2012 | US$ 40.068.798.000 | US$ 17.258.096.000 | US$ 9.634.941.000 | US$ 4.995.730.000 | US$ 7.247.781.000 |
| 2011 | US$ 46.426.276.000 | US$ 18.116.250.000 | US$ 11.141.224.000 | US$ 4.762.338.000 | US$ 7.789.943.000 |
| 2010 | US$ 37.784.400.000 | US$ 16.514.374.000 | US$ 9.730.999.000 | US$ 4.430.443.000 | US$ 6.399.966.000 |
| 2009 | US$ 33.418.473.000 | US$ 13.914.394.000 | US$ 10.171.668.000 | US$ 3.441.322.000 | US$ 5.434.940.000 |
| 2008 | US$ 48.555.435.000 | US$ 16.797.908.000 | US$ 13.698.095.000 | US$ 4.596.434.000 | US$ 7.233.424.000 |
| 2007 | US$ 39.434.621.000 | US$ 11.753.417.000 | US$ 11.245.759.000 | US$ 3.463.535.000 | US$ 5.602.436.000 |
| 2006 | US$ 30.144.302.000 | US$ 7.711.651.000 | US$ 8.535.769.000 | US$ 2.771.956.000 | US$ 3.953.849.000 |
| 2005 | US$ 25.053.382.000 | US$ 5.496.574.000 | US$ 7.187.473.000 | US$ 2.415.745.000 | US$ 3.473.976.000 |
| 2004 | US$ 21.479.217.000 | US$ 4.064.565.000 | US$ 6.938.503.000 | US$ 2.119.400.000 | US$ 3.072.305.000 |
| 2003 | US$ 16.543.812.000 | US$ 2.861.560.000 | US$ 5.751.973.000 | US$ 1.751.652.000 | US$ 2.267.111.000 |
| 2002 | US$ 13.362.474.000 | US$ 2.050.109.000 | US$ 4.574.247.000 | US$ 1.783.124.000 | US$ 1.898.053.000 |
| 2001 | US$ 12.003.267.000 | US$ 1.594.911.000 | US$ 4.111.449.000 | US$ 1.682.738.000 | US$ 1.748.805.000 |
Em 2025, as importações de bens foram de US$ 80,7 bilhões da Alemanha, US$ 65,4 bilhões da China, US$ 20 bilhões da Itália, US$ 19,9 bilhões dos Estados Unidos e US$ 16,3 bilhões dos Países Baixos. O primeiro lugar dos cinco fornecedores da Polônia ficou com a Alemanha em todos os anos desde 2001.
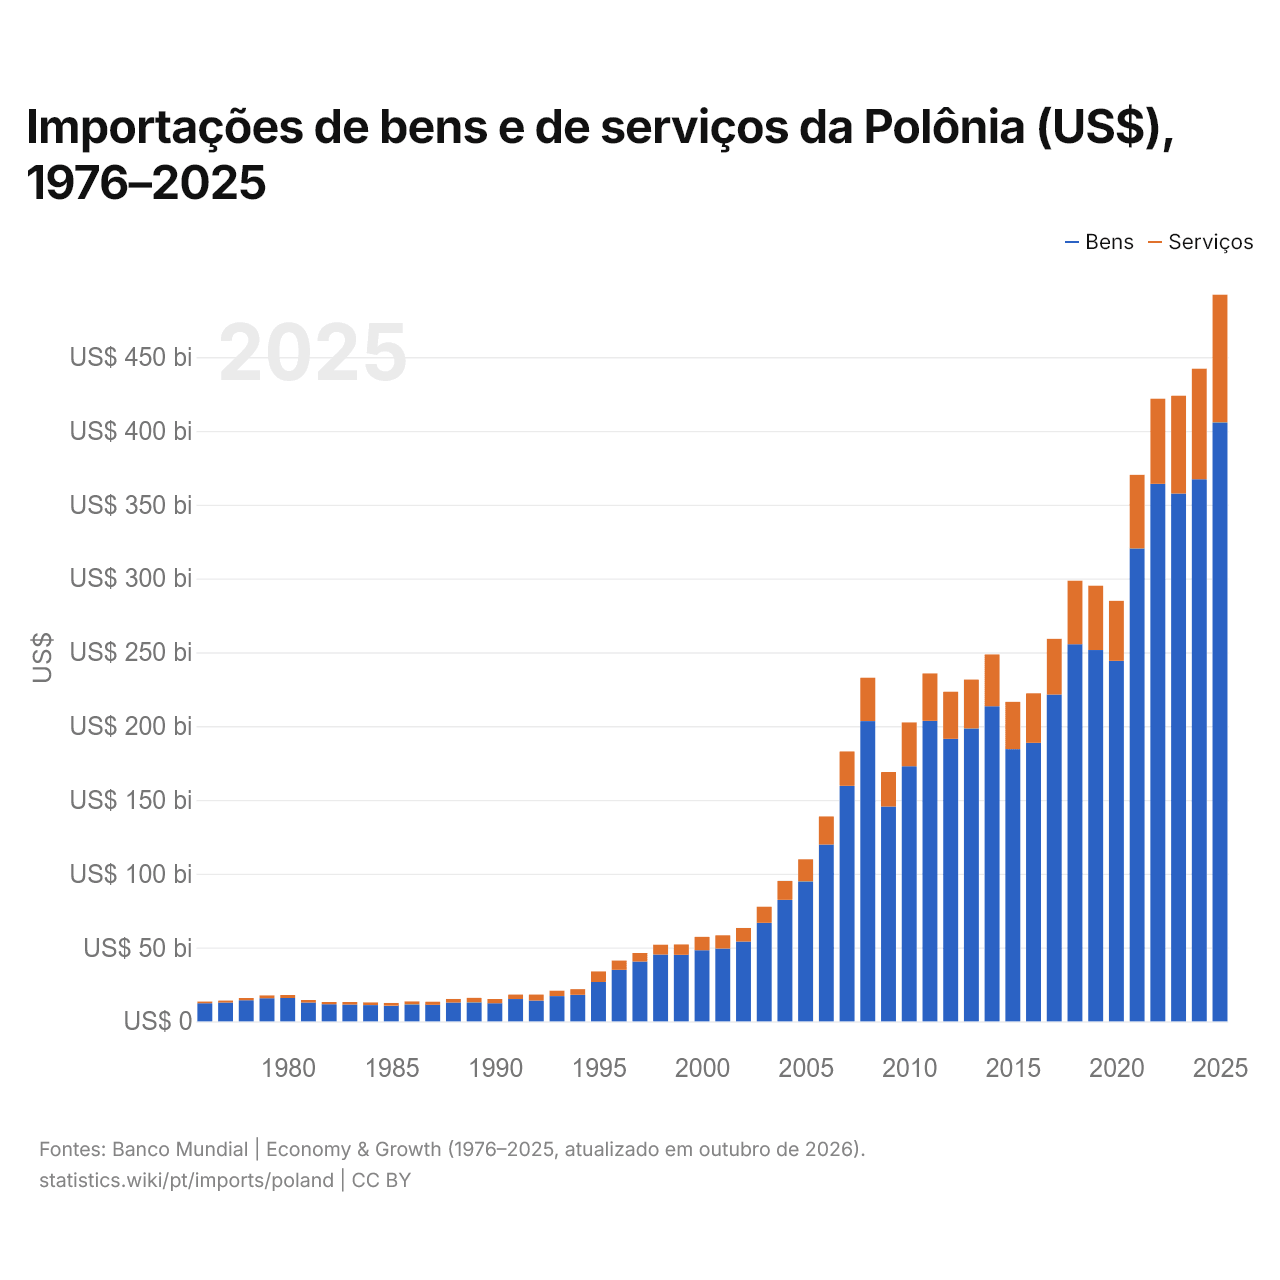
Importações de bens e de serviços da Polônia (US$), 1976–2025
| Ano | US$ | |
|---|---|---|
| Bens | Serviços | |
| 2025 | US$ 405.771.000.000 | US$ 86.516.000.000 |
| 2024 | US$ 367.231.000.000 | US$ 74.905.000.000 |
| 2023 | US$ 357.618.000.000 | US$ 66.179.000.000 |
| 2022 | US$ 364.207.000.000 | US$ 57.558.000.000 |
| 2021 | US$ 320.371.000.000 | US$ 49.881.000.000 |
| 2020 | US$ 244.244.000.000 | US$ 40.641.000.000 |
| 2019 | US$ 251.525.000.000 | US$ 43.607.000.000 |
| 2018 | US$ 255.468.000.000 | US$ 43.009.000.000 |
| 2017 | US$ 221.449.000.000 | US$ 37.673.000.000 |
| 2016 | US$ 188.710.000.000 | US$ 33.500.000.000 |
| 2015 | US$ 184.402.000.000 | US$ 32.016.000.000 |
| 2014 | US$ 213.468.000.000 | US$ 35.058.000.000 |
| 2013 | US$ 198.434.000.000 | US$ 33.057.000.000 |
| 2012 | US$ 191.362.000.000 | US$ 31.928.000.000 |
| 2011 | US$ 203.528.000.000 | US$ 32.194.000.000 |
| 2010 | US$ 172.783.000.000 | US$ 29.713.000.000 |
| 2009 | US$ 145.466.000.000 | US$ 23.414.000.000 |
| 2008 | US$ 203.386.000.000 | US$ 29.390.000.000 |
| 2007 | US$ 159.611.000.000 | US$ 23.195.000.000 |
| 2006 | US$ 119.751.000.000 | US$ 19.087.000.000 |
| 2005 | US$ 94.812.000.000 | US$ 14.951.000.000 |
| 2004 | US$ 82.361.000.000 | US$ 12.772.000.000 |
| 2003 | US$ 66.732.000.000 | US$ 10.931.000.000 |
| 2002 | US$ 53.991.000.000 | US$ 9.262.000.000 |
| 2001 | US$ 49.324.000.000 | US$ 8.968.000.000 |
| 2000 | US$ 48.209.000.000 | US$ 8.996.000.000 |
| 1999 | US$ 45.132.000.000 | US$ 6.982.000.000 |
| 1998 | US$ 45.303.000.000 | US$ 6.624.000.000 |
| 1997 | US$ 40.553.000.000 | US$ 5.743.000.000 |
| 1996 | US$ 34.844.000.000 | US$ 6.343.000.000 |
| 1995 | US$ 26.687.000.000 | US$ 7.138.000.000 |
| 1994 | US$ 17.919.000.000 | US$ 3.859.000.000 |
| 1993 | US$ 17.087.000.000 | US$ 3.631.000.000 |
| 1992 | US$ 14.060.000.000 | US$ 4.045.000.000 |
| 1991 | US$ 15.104.000.000 | US$ 2.994.000.000 |
| 1990 | US$ 12.248.000.000 | US$ 2.847.000.000 |
| 1989 | US$ 12.822.000.000 | US$ 3.053.000.000 |
| 1988 | US$ 12.757.000.000 | US$ 2.404.000.000 |
| 1987 | US$ 11.236.000.000 | US$ 2.028.000.000 |
| 1986 | US$ 11.459.000.000 | US$ 2.012.000.000 |
| 1985 | US$ 10.598.000.000 | US$ 1.846.000.000 |
| 1984 | US$ 10.995.000.000 | US$ 1.853.000.000 |
| 1983 | US$ 11.312.000.000 | US$ 1.783.000.000 |
| 1982 | US$ 11.631.000.000 | US$ 1.467.000.000 |
| 1981 | US$ 12.723.000.000 | US$ 1.727.000.000 |
| 1980 | US$ 15.819.000.000 | US$ 2.023.000.000 |
| 1979 | US$ 15.660.000.000 | US$ 1.863.000.000 |
| 1978 | US$ 14.259.000.000 | US$ 1.521.000.000 |
| 1977 | US$ 12.724.000.000 | US$ 1.309.000.000 |
| 1976 | US$ 12.263.000.000 | US$ 1.144.000.000 |
Em 2025, as importações de bens da Polônia foram de US$ 406 bilhões e as de serviços, de US$ 86,5 bilhões; os serviços representaram 17,6% do total, ante 8,5% em 1976.
A Polônia na classificação mundial de importações, 2025
| Posição | País | Importações | Participação mundial | |
|---|---|---|---|---|
| 16 |
Espanha
|
US$ 626 bi | 1,85% | vs Espanha |
| 17 |
 Bélgica |
US$ 562 bi | 1,67% | vs Bélgica |
| 18 |
 Taiwan |
US$ 503 bi | 1,49% | |
| 19 |
 Polônia |
US$ 488 bi | 1,45% | |
| 20 |
 EAU |
US$ 482 bi (2023) | 1,59% | |
| 21 |
 Vietnã |
US$ 474 bi | 1,41% | |
| 22 |
 Austrália |
US$ 407 bi | 1,21% |
Importações de bens e serviços da Polônia, % do PIB, 1995–2025
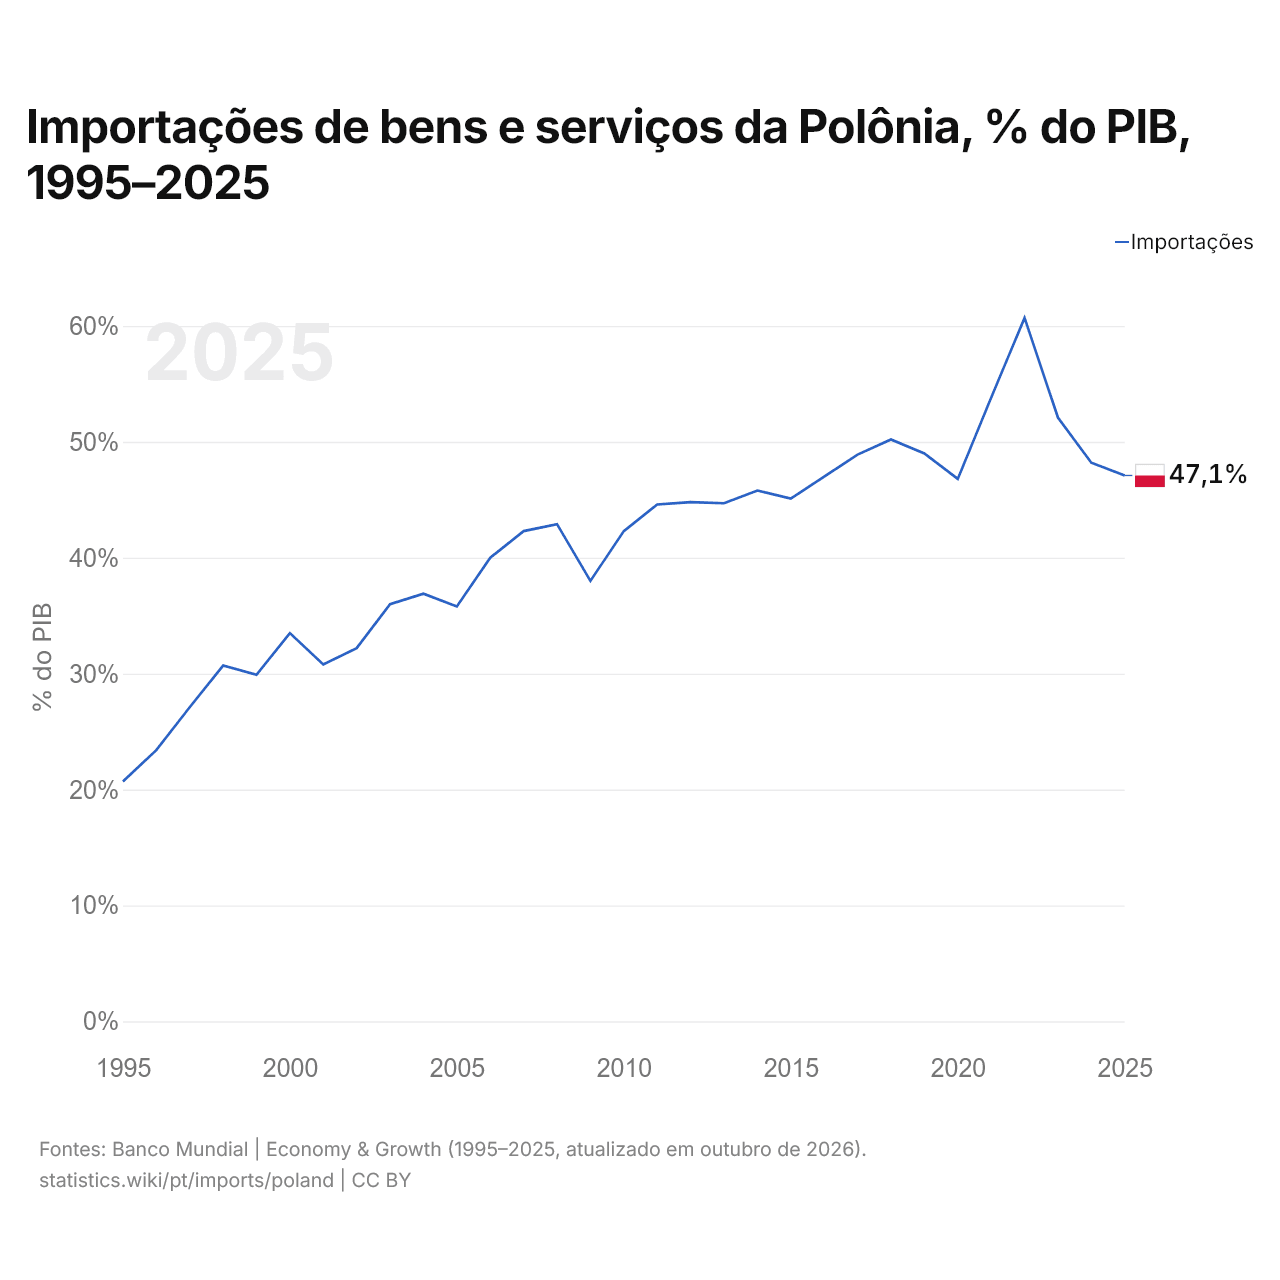
Em 2025, as importações de bens e serviços da Polônia equivaleram a 47,1% do seu PIB, ante 20,7% em 1995. A maior participação foi de 60,7%, em 2022.
Comparar as importações da Polônia com as de outros países
Fontes:
- TradeMap (2001–2025, atualizado em outubro de 2026)
- Banco Mundial | Economy & Growth (1976–2025, atualizado em outubro de 2026)
Creative Commons Atribuição (CC BY): você pode copiar, compartilhar, adaptar e reutilizar este conteúdo, inclusive para fins comerciais, desde que cite o statistics.wiki e indique as alterações que fizer. As fontes listadas acima podem ter suas próprias condições de licença.