
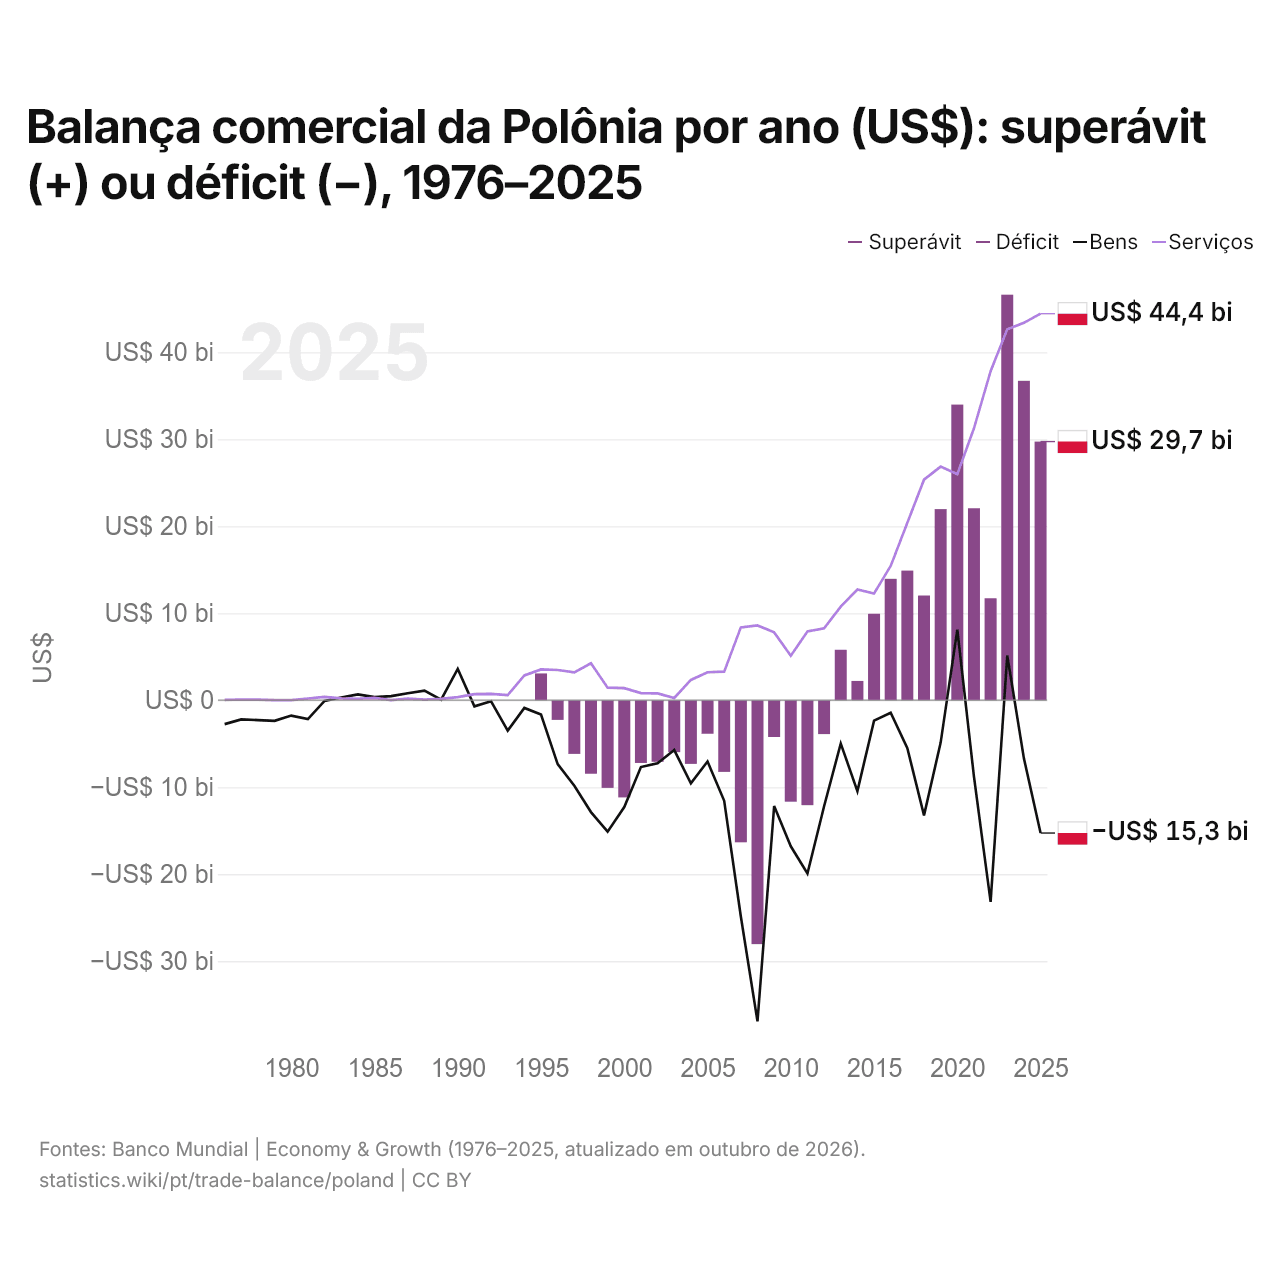
Balança comercial da Polônia por ano (US$): superávit (+) ou déficit (−), 1976–2025
| Ano | US$ | ||
|---|---|---|---|
| Bens e serviços | Bens | Serviços | |
| 2025 | US$ 29.728.430.080 | US$ −15.274.000.000 | US$ 44.432.000.000 |
| 2024 | US$ 36.712.372.356 | US$ −6.694.000.000 | US$ 43.378.000.000 |
| 2023 | US$ 46.615.256.522 | US$ 5.130.000.000 | US$ 42.644.000.000 |
| 2022 | US$ 11.711.940.419 | US$ −23.193.000.000 | US$ 37.816.000.000 |
| 2021 | US$ 22.064.950.478 | US$ −8.800.000.000 | US$ 31.250.000.000 |
| 2020 | US$ 33.983.789.524 | US$ 8.111.000.000 | US$ 25.977.000.000 |
| 2019 | US$ 21.966.335.667 | US$ −4.878.000.000 | US$ 26.845.000.000 |
| 2018 | US$ 12.027.243.552 | US$ −13.240.000.000 | US$ 25.343.000.000 |
| 2017 | US$ 14.895.220.929 | US$ −5.530.000.000 | US$ 20.399.000.000 |
| 2016 | US$ 13.946.747.767 | US$ −1.447.000.000 | US$ 15.426.000.000 |
| 2015 | US$ 9.926.780.740 | US$ −2.352.000.000 | US$ 12.265.000.000 |
| 2014 | US$ 2.208.244.493 | US$ −10.456.000.000 | US$ 12.724.000.000 |
| 2013 | US$ 5.788.426.753 | US$ −4.989.000.000 | US$ 10.753.000.000 |
| 2012 | US$ −3.905.983.709 | US$ −12.197.000.000 | US$ 8.264.000.000 |
| 2011 | US$ −12.073.518.453 | US$ −19.930.000.000 | US$ 7.899.000.000 |
| 2010 | US$ −11.672.802.043 | US$ −16.796.000.000 | US$ 5.100.000.000 |
| 2009 | US$ −4.234.743.162 | US$ −12.170.000.000 | US$ 7.794.000.000 |
| 2008 | US$ −28.050.731.309 | US$ −36.924.000.000 | US$ 8.594.000.000 |
| 2007 | US$ −16.342.780.758 | US$ −24.879.000.000 | US$ 8.365.000.000 |
| 2006 | US$ −8.248.693.750 | US$ −11.566.000.000 | US$ 3.273.000.000 |
| 2005 | US$ −3.869.901.341 | US$ −7.057.000.000 | US$ 3.206.000.000 |
| 2004 | US$ −7.322.203.759 | US$ −9.562.000.000 | US$ 2.327.000.000 |
| 2003 | US$ −5.980.085.239 | US$ −5.733.000.000 | US$ 251.000.000 |
| 2002 | US$ −7.089.158.347 | US$ −7.248.000.000 | US$ 774.000.000 |
| 2001 | US$ −7.220.254.525 | US$ −7.689.000.000 | US$ 813.000.000 |
| 2000 | US$ −11.180.202.827 | US$ −12.285.000.000 | US$ 1.381.000.000 |
| 1999 | US$ −10.079.130.692 | US$ −15.125.000.000 | US$ 1.434.000.000 |
| 1998 | US$ −8.458.019.221 | US$ −12.867.000.000 | US$ 4.247.000.000 |
| 1997 | US$ −6.181.517.230 | US$ −9.840.000.000 | US$ 3.190.000.000 |
| 1996 | US$ −2.265.123.697 | US$ −7.353.000.000 | US$ 3.470.000.000 |
| 1995 | US$ 3.074.248.356 | US$ −1.646.000.000 | US$ 3.537.000.000 |
| 1994 | - | US$ −895.000.000 | US$ 2.840.000.000 |
| 1993 | - | US$ −3.505.000.000 | US$ 570.000.000 |
| 1992 | - | US$ −131.000.000 | US$ 728.000.000 |
| 1991 | - | US$ −711.000.000 | US$ 693.000.000 |
| 1990 | - | US$ 3.589.000.000 | US$ 353.000.000 |
| 1989 | - | US$ 47.000.000 | US$ 148.000.000 |
| 1988 | - | US$ 1.089.000.000 | US$ 68.000.000 |
| 1987 | - | US$ 790.000.000 | US$ 188.000.000 |
| 1986 | - | US$ 467.000.000 | US$ 3.000.000 |
| 1985 | - | US$ 347.000.000 | US$ 258.000.000 |
| 1984 | - | US$ 659.000.000 | US$ 164.000.000 |
| 1983 | - | US$ 303.000.000 | US$ 207.000.000 |
| 1982 | - | US$ −84.000.000 | US$ 375.000.000 |
| 1981 | - | US$ −2.181.000.000 | US$ 186.000.000 |
| 1980 | - | US$ −1.776.000.000 | US$ −5.000.000 |
| 1979 | - | US$ −2.384.000.000 | US$ 11.000.000 |
| 1978 | - | US$ −2.292.000.000 | US$ 65.000.000 |
| 1977 | - | US$ −2.218.000.000 | US$ 76.000.000 |
| 1976 | - | US$ −2.757.000.000 | US$ 36.000.000 |
Em 2025, a balança comercial da Polônia teve um superávit de US$ 29,7 bilhões, ante um superávit de US$ 3,07 bilhões em 1995. O maior déficit foi de US$ 28,1 bilhões, em 2008, e o maior superávit, de US$ 46,6 bilhões, em 2023. A balança comercial da Polônia teve superávit em todos os anos desde 2013. O comércio de bens teve um déficit de US$ 15,3 bilhões e o de serviços, um superávit de US$ 44,4 bilhões.
Em 2025, o saldo comercial da Polônia foi o 11º mais alto de 41 países da Europa, onde os saldos iam de um déficit de US$ 56,8 bilhões na Ucrânia a um superávit de US$ 290 bilhões na Irlanda. De 2016 a 2025, os saldos comerciais da Polônia somaram um superávit de US$ 244 bilhões, ante um déficit de US$ 66,6 bilhões de 2006 a 2015. Em 2025, a conta corrente da Polônia teve um déficit de 1,0% do PIB.
Comércio de bens da Polônia com os seus 10 maiores parceiros comerciais, segundo a Polônia, 2025
| País | Exportações para | Importações de | Saldo | |
|---|---|---|---|---|
 Alemanha |
US$ 112 bi | US$ 80,7 bi | +US$ 31,0 bi | vs Alemanha |
 China |
US$ 3,50 bi | US$ 65,4 bi | -US$ 61,9 bi | vs China |
 Tchéquia |
US$ 26,0 bi | US$ 14,0 bi | +US$ 12,0 bi | vs Tchéquia |
 França |
US$ 25,2 bi | US$ 14,3 bi | +US$ 10,9 bi | vs França |
 Itália |
US$ 18,7 bi | US$ 20,0 bi | -US$ 1,30 bi | vs Itália |
 Países Baixos |
US$ 19,3 bi | US$ 16,3 bi | +US$ 2,96 bi | vs Países Baixos |
 Estados Unidos |
US$ 13,0 bi | US$ 19,9 bi | -US$ 6,89 bi | |
 Reino Unido |
US$ 21,0 bi | US$ 6,89 bi | +US$ 14,1 bi | vs RU |
 Espanha |
US$ 12,4 bi | US$ 9,13 bi | +US$ 3,27 bi | vs Espanha |
 Ucrânia |
US$ 15,1 bi | US$ 5,23 bi | +US$ 9,88 bi | vs Ucrânia |
Balança comercial da Polônia: superávit (+) ou déficit (−)
Comparar a balança comercial da Polônia com a de outros países
Fontes:
- TradeMap (2025, atualizado em outubro de 2026)
- Banco Mundial | Economy & Growth (1976–2025, atualizado em outubro de 2026)
Creative Commons Atribuição (CC BY): você pode copiar, compartilhar, adaptar e reutilizar este conteúdo, inclusive para fins comerciais, desde que cite o statistics.wiki e indique as alterações que fizer. As fontes listadas acima podem ter suas próprias condições de licença.