
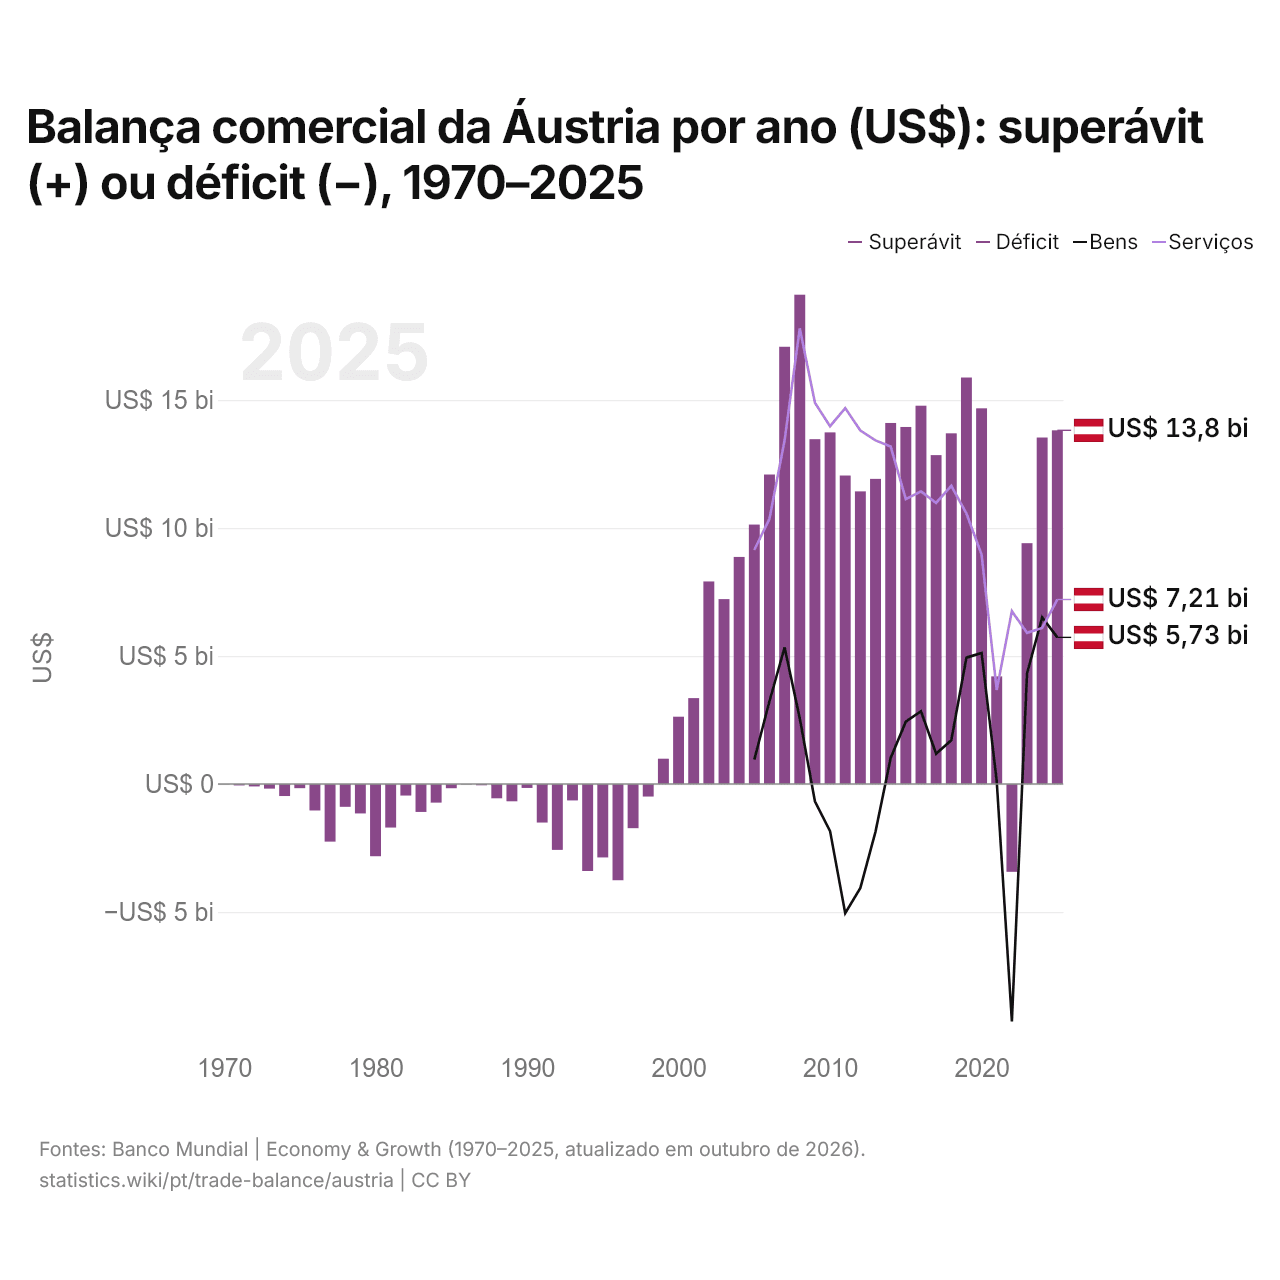
Balança comercial da Áustria por ano (US$): superávit (+) ou déficit (−), 1970–2025
| Ano | US$ | ||
|---|---|---|---|
| Bens e serviços | Bens | Serviços | |
| 2025 | US$ 13.814.886.820 | US$ 5.726.288.099 | US$ 7.206.007.749 |
| 2024 | US$ 13.534.442.567 | US$ 6.511.947.097 | US$ 6.093.477.145 |
| 2023 | US$ 9.406.525.619 | US$ 4.319.404.033 | US$ 5.902.157.676 |
| 2022 | US$ −3.430.638.702 | US$ −9.272.150.625 | US$ 6.752.676.523 |
| 2021 | US$ 4.203.878.935 | US$ 113.749.355 | US$ 3.674.501.948 |
| 2020 | US$ 14.673.802.549 | US$ 5.119.777.327 | US$ 8.958.597.328 |
| 2019 | US$ 15.877.995.063 | US$ 4.934.471.810 | US$ 10.567.866.264 |
| 2018 | US$ 13.697.443.777 | US$ 1.710.976.378 | US$ 11.650.222.430 |
| 2017 | US$ 12.846.082.513 | US$ 1.180.325.366 | US$ 10.976.402.680 |
| 2016 | US$ 14.776.305.348 | US$ 2.841.738.311 | US$ 11.428.365.249 |
| 2015 | US$ 13.946.204.239 | US$ 2.431.885.190 | US$ 11.126.117.994 |
| 2014 | US$ 14.102.094.280 | US$ 1.014.281.604 | US$ 13.179.570.662 |
| 2013 | US$ 11.919.802.293 | US$ −1.859.201.757 | US$ 13.420.431.613 |
| 2012 | US$ 11.430.475.736 | US$ −4.062.702.894 | US$ 13.805.193.908 |
| 2011 | US$ 12.049.576.179 | US$ −5.046.785.928 | US$ 14.683.197.398 |
| 2010 | US$ 13.733.951.386 | US$ −1.840.824.214 | US$ 13.974.936.960 |
| 2009 | US$ 13.469.366.425 | US$ −676.875.227 | US$ 14.896.350.840 |
| 2008 | US$ 19.114.143.978 | US$ 2.562.692.205 | US$ 17.798.873.535 |
| 2007 | US$ 17.079.360.546 | US$ 5.333.458.549 | US$ 13.425.171.079 |
| 2006 | US$ 12.089.354.977 | US$ 3.232.016.531 | US$ 10.362.742.899 |
| 2005 | US$ 10.132.963.489 | US$ 954.203.732 | US$ 9.139.823.650 |
| 2004 | US$ 8.869.129.249 | - | - |
| 2003 | US$ 7.221.564.356 | - | - |
| 2002 | US$ 7.912.464.486 | - | - |
| 2001 | US$ 3.354.580.395 | - | - |
| 2000 | US$ 2.628.000.043 | - | - |
| 1999 | US$ 986.217.302 | - | - |
| 1998 | US$ −491.312.806 | - | - |
| 1997 | US$ −1.726.846.319 | - | - |
| 1996 | US$ −3.760.718.742 | - | - |
| 1995 | US$ −2.869.134.707 | - | - |
| 1994 | US$ −3.399.096.494 | - | - |
| 1993 | US$ −642.069.088 | - | - |
| 1992 | US$ −2.574.318.808 | - | - |
| 1991 | US$ −1.507.547.437 | - | - |
| 1990 | US$ −155.715.842 | - | - |
| 1989 | US$ −676.119.605 | - | - |
| 1988 | US$ −560.959.545 | - | - |
| 1987 | US$ −51.301.698 | - | - |
| 1986 | US$ −18.986.030 | - | - |
| 1985 | US$ −166.890.130 | - | - |
| 1984 | US$ −729.464.961 | - | - |
| 1983 | US$ −1.093.202.850 | - | - |
| 1982 | US$ −451.973.865 | - | - |
| 1981 | US$ −1.701.433.385 | - | - |
| 1980 | US$ −2.821.896.405 | - | - |
| 1979 | US$ −1.150.221.307 | - | - |
| 1978 | US$ −892.189.899 | - | - |
| 1977 | US$ −2.252.386.979 | - | - |
| 1976 | US$ −1.035.864.846 | - | - |
| 1975 | US$ −164.188.986 | - | - |
| 1974 | US$ −471.183.009 | - | - |
| 1973 | US$ −182.431.654 | - | - |
| 1972 | US$ −95.890.232 | - | - |
| 1971 | US$ −55.318.868 | - | - |
| 1970 | US$ −11.819.000 | - | - |
Em 2025, a balança comercial da Áustria teve um superávit de US$ 13,8 bilhões, ante um déficit de US$ 11,8 milhões em 1970. O maior déficit foi de US$ 3,76 bilhões, em 1996, e o maior superávit, de US$ 19,1 bilhões, em 2008. A balança comercial da Áustria teve superávit em todos os anos desde 2023.
Em 2025, o saldo comercial da Áustria foi o 14º mais alto de 41 países da Europa, onde os saldos iam de um déficit de US$ 56,8 bilhões na Ucrânia a um superávit de US$ 290 bilhões na Irlanda. De 2016 a 2025, os saldos comerciais da Áustria somaram um superávit de US$ 109 bilhões, ante um superávit de US$ 139 bilhões de 2006 a 2015. Em 2025, a conta corrente da Áustria teve um superávit de 1,8% do PIB.
Comércio de bens da Áustria com os seus 10 maiores parceiros comerciais, segundo a Áustria, 2025
| País | Exportações para | Importações de | Saldo | |
|---|---|---|---|---|
 Alemanha |
US$ 64,4 bi | US$ 90,0 bi | -US$ 25,6 bi | vs Alemanha |
 Itália |
US$ 14,4 bi | US$ 13,9 bi | +US$ 421 mi | |
 Suíça |
US$ 11,7 bi | US$ 11,0 bi | +US$ 699 mi | vs Suíça |
 Tchéquia |
US$ 8,15 bi | US$ 12,0 bi | -US$ 3,84 bi | vs Tchéquia |
 Estados Unidos |
US$ 14,6 bi | US$ 5,35 bi | +US$ 9,24 bi | |
 Eslováquia |
US$ 9,29 bi | US$ 7,01 bi | +US$ 2,28 bi | vs Eslováquia |
 Países Baixos |
US$ 4,30 bi | US$ 11,9 bi | -US$ 7,60 bi | vs Países Baixos |
 Polônia |
US$ 8,58 bi | US$ 7,51 bi | +US$ 1,08 bi | vs Polônia |
 Hungria |
US$ 7,95 bi | US$ 5,87 bi | +US$ 2,08 bi | vs Hungria |
 China |
US$ 5,73 bi | US$ 7,59 bi | -US$ 1,86 bi |
Balança comercial da Áustria: superávit (+) ou déficit (−)
| Bens e serviços, US$, 2025 | +US$ 13,8 bi |
|---|---|
| % do PIB, 2025 | +2,4% |
| Anos com superávit, 2000–2025 | 25 |
| Bens, US$, 2025 | +US$ 5,73 bi |
| Serviços, US$, 2025 | +US$ 7,21 bi |
| Maior superávit em bens, 2025 | Estados Unidos +US$ 9,24 bi |
| Maior déficit em bens, 2025 | Alemanha -US$ 25,6 bi |
Comparar a balança comercial da Áustria com a de outros países
Fontes:
- TradeMap (2025, atualizado em outubro de 2026)
- Banco Mundial | Economy & Growth (1970–2025, atualizado em outubro de 2026)
Creative Commons Atribuição (CC BY): você pode copiar, compartilhar, adaptar e reutilizar este conteúdo, inclusive para fins comerciais, desde que cite o statistics.wiki e indique as alterações que fizer. As fontes listadas acima podem ter suas próprias condições de licença.