
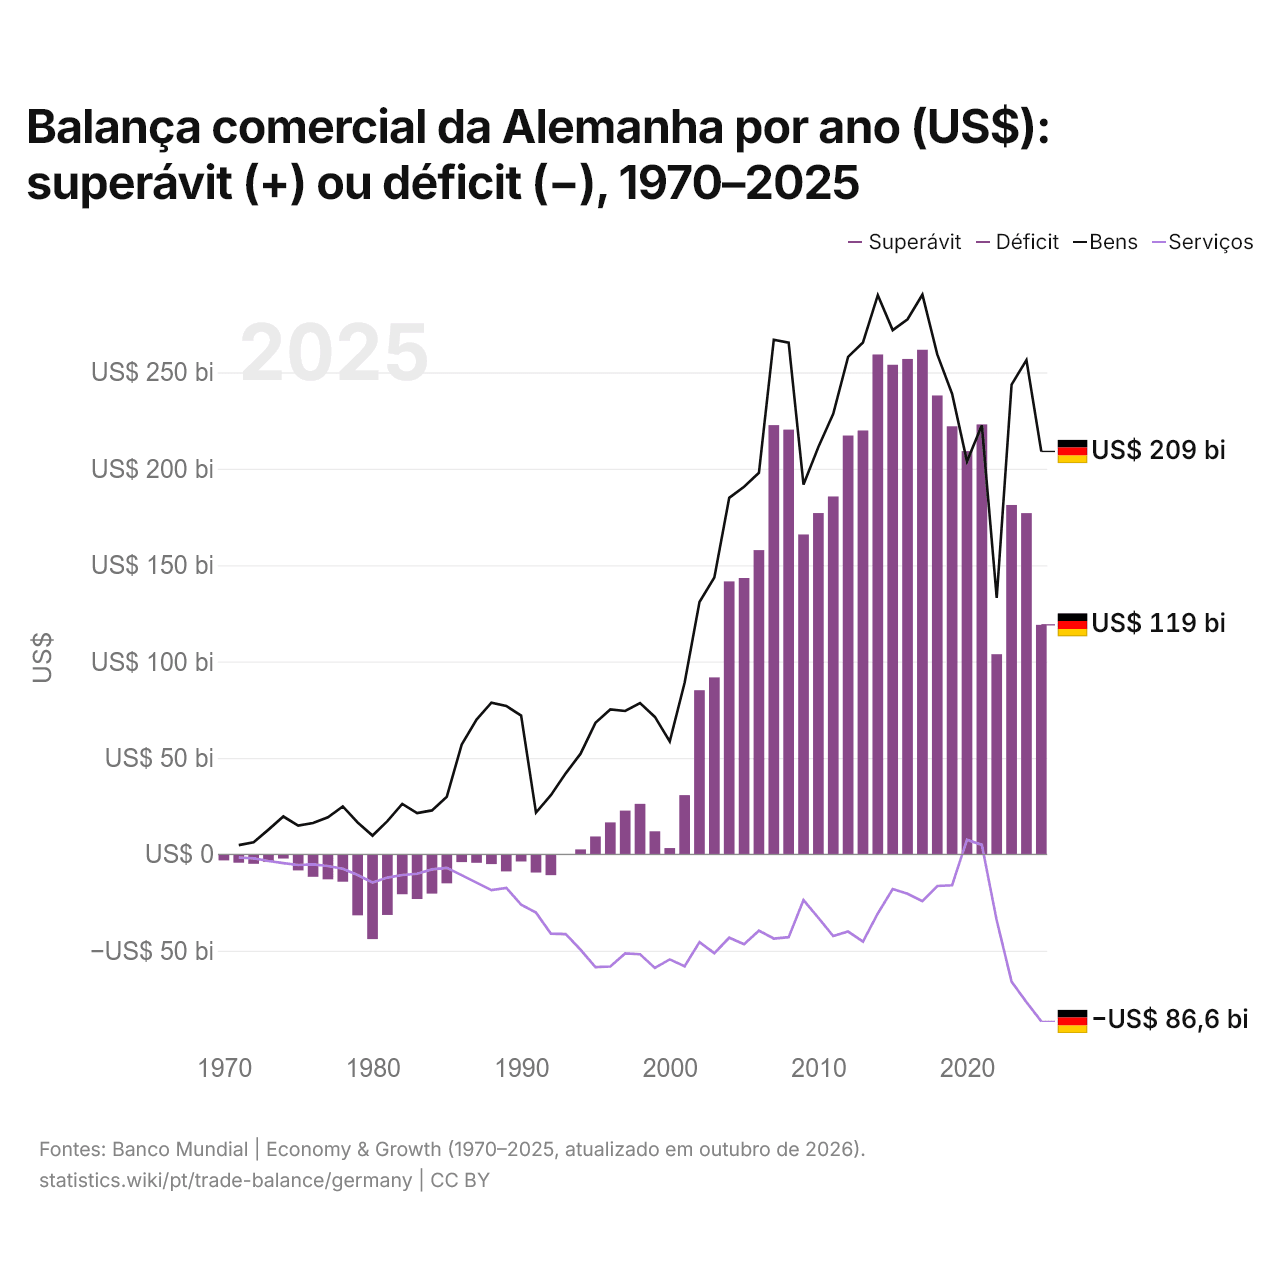
Balança comercial da Alemanha por ano (US$): superávit (+) ou déficit (−), 1970–2025
| Ano | US$ | ||
|---|---|---|---|
| Bens e serviços | Bens | Serviços | |
| 2025 | US$ 119.036.943.611 | US$ 208.964.502.916 | US$ −86.622.358.810 |
| 2024 | US$ 176.993.019.011 | US$ 256.345.482.950 | US$ −76.670.864.506 |
| 2023 | US$ 181.209.809.275 | US$ 243.654.398.196 | US$ −66.042.223.079 |
| 2022 | US$ 103.809.534.747 | US$ 132.963.061.426 | US$ −34.289.012.510 |
| 2021 | US$ 222.995.040.802 | US$ 222.509.758.115 | US$ 4.906.088.338 |
| 2020 | US$ 209.133.823.156 | US$ 203.819.589.593 | US$ 7.616.450.853 |
| 2019 | US$ 222.041.052.173 | US$ 238.776.333.289 | US$ −16.063.700.194 |
| 2018 | US$ 237.995.400.452 | US$ 259.317.254.267 | US$ −16.439.689.424 |
| 2017 | US$ 261.732.442.733 | US$ 290.289.940.340 | US$ −24.300.593.583 |
| 2016 | US$ 256.950.954.099 | US$ 277.498.011.178 | US$ −20.445.828.960 |
| 2015 | US$ 253.944.200.893 | US$ 271.889.863.761 | US$ −18.025.280.453 |
| 2014 | US$ 259.262.242.062 | US$ 290.027.974.518 | US$ −30.643.801.700 |
| 2013 | US$ 219.838.066.559 | US$ 265.527.150.748 | US$ −45.326.766.200 |
| 2012 | US$ 217.210.227.233 | US$ 258.019.654.081 | US$ −40.066.071.742 |
| 2011 | US$ 185.606.097.335 | US$ 228.476.027.107 | US$ −42.366.302.055 |
| 2010 | US$ 177.011.015.050 | US$ 211.274.726.488 | US$ −32.934.160.308 |
| 2009 | US$ 165.923.316.906 | US$ 191.811.953.066 | US$ −23.723.332.387 |
| 2008 | US$ 220.288.283.354 | US$ 265.387.833.011 | US$ −42.963.666.416 |
| 2007 | US$ 222.623.193.646 | US$ 266.928.303.237 | US$ −43.678.314.969 |
| 2006 | US$ 157.789.848.554 | US$ 197.895.988.661 | US$ −39.615.811.736 |
| 2005 | US$ 143.315.467.107 | US$ 190.620.125.277 | US$ −46.622.491.194 |
| 2004 | US$ 141.587.181.187 | US$ 184.895.071.599 | US$ −43.235.491.953 |
| 2003 | US$ 91.785.747.701 | US$ 143.585.392.098 | US$ −51.267.197.472 |
| 2002 | US$ 85.110.145.458 | US$ 130.917.612.921 | US$ −45.507.695.656 |
| 2001 | US$ 30.705.762.723 | US$ 88.996.844.494 | US$ −58.058.746.355 |
| 2000 | US$ 3.259.428.685 | US$ 58.597.202.253 | US$ −54.492.356.606 |
| 1999 | US$ 11.966.537.957 | US$ 71.280.370.166 | US$ −58.955.081.577 |
| 1998 | US$ 26.183.172.169 | US$ 78.477.362.003 | US$ −51.838.565.622 |
| 1997 | US$ 22.686.668.171 | US$ 74.346.826.655 | US$ −51.391.061.576 |
| 1996 | US$ 16.562.256.304 | US$ 75.151.924.636 | US$ −58.207.054.945 |
| 1995 | US$ 9.254.810.973 | US$ 68.204.058.845 | US$ −58.455.943.805 |
| 1994 | US$ 2.562.371.942 | US$ 52.197.968.937 | US$ −49.492.571.612 |
| 1993 | US$ 179.817.816 | US$ 42.022.622.078 | US$ −41.415.996.601 |
| 1992 | US$ −10.812.773.951 | US$ 30.685.306.861 | US$ −41.104.975.319 |
| 1991 | US$ −9.442.545.669 | US$ 21.637.818.525 | US$ −30.256.342.823 |
| 1990 | US$ −3.700.909.091 | US$ 71.929.019.946 | US$ −26.093.437.849 |
| 1989 | US$ −8.860.353.688 | US$ 76.952.148.277 | US$ −17.407.271.714 |
| 1988 | US$ −5.073.354.494 | US$ 78.646.645.300 | US$ −18.553.605.444 |
| 1987 | US$ −4.398.411.317 | US$ 69.869.401.193 | US$ −14.679.551.860 |
| 1986 | US$ −4.040.852.923 | US$ 56.952.949.074 | US$ −10.809.034.452 |
| 1985 | US$ −15.052.044.247 | US$ 29.901.372.196 | US$ −6.993.394.764 |
| 1984 | US$ −20.362.746.203 | US$ 22.792.126.647 | US$ −7.804.220.064 |
| 1983 | US$ −23.185.607.813 | US$ 21.425.883.965 | US$ −10.084.487.224 |
| 1982 | US$ −20.687.120.174 | US$ 26.186.535.114 | US$ −10.740.693.012 |
| 1981 | US$ −31.452.268.282 | US$ 17.232.260.580 | US$ −12.052.891.873 |
| 1980 | US$ −43.964.356.574 | US$ 9.719.209.284 | US$ −14.600.678.437 |
| 1979 | US$ −31.634.161.776 | US$ 16.515.089.758 | US$ −10.766.108.630 |
| 1978 | US$ −14.221.404.090 | US$ 24.863.255.933 | US$ −7.510.746.049 |
| 1977 | US$ −12.957.768.887 | US$ 19.227.240.726 | US$ −6.053.009.959 |
| 1976 | US$ −11.645.608.203 | US$ 16.242.129.657 | US$ −5.179.369.061 |
| 1975 | US$ −8.334.008.268 | US$ 14.912.535.989 | US$ −5.553.501.734 |
| 1974 | US$ −2.193.463.835 | US$ 19.626.181.873 | US$ −4.543.948.141 |
| 1973 | US$ −4.000.794.731 | US$ 12.809.670.197 | US$ −3.478.184.866 |
| 1972 | US$ −4.909.821.505 | US$ 6.261.345.944 | US$ −2.088.535.449 |
| 1971 | US$ −4.336.130.597 | US$ 4.790.856.397 | US$ −1.661.556.577 |
| 1970 | US$ −3.162.513.226 | - | - |
Em 2025, a balança comercial da Alemanha teve um superávit de US$ 119 bilhões, ante um déficit de US$ 3,16 bilhões em 1970. O maior déficit foi de US$ 44 bilhões, em 1980, e o maior superávit, de US$ 262 bilhões, em 2017. A balança comercial da Alemanha teve superávit em todos os anos desde 1993. O comércio de bens teve um superávit de US$ 209 bilhões e o de serviços, um déficit de US$ 86,6 bilhões.
Em 2025, o saldo comercial da Alemanha foi o 3º mais alto de 41 países da Europa, onde os saldos iam de um déficit de US$ 56,8 bilhões na Ucrânia a um superávit de US$ 290 bilhões na Irlanda. De 2016 a 2025, os saldos comerciais da Alemanha somaram um superávit de US$ 1,99 trilhão, ante um superávit de US$ 2,08 trilhões de 2006 a 2015. Em 2025, a conta corrente da Alemanha teve um superávit de 4,4% do PIB.
Comércio de bens da Alemanha com os seus 10 maiores parceiros comerciais, segundo a Alemanha, 2025
| País | Exportações para | Importações de | Saldo | |
|---|---|---|---|---|
 China |
US$ 91,8 bi | US$ 194 bi | -US$ 102 bi | vs China |
 Estados Unidos |
US$ 166 bi | US$ 103 bi | +US$ 62,9 bi | vs EUA |
 Países Baixos |
US$ 126 bi | US$ 99,4 bi | +US$ 27,0 bi | vs Países Baixos |
 França |
US$ 132 bi | US$ 78,0 bi | +US$ 54,4 bi | vs França |
 Polônia |
US$ 113 bi | US$ 90,9 bi | +US$ 22,3 bi | vs Polônia |
 Itália |
US$ 94,1 bi | US$ 81,9 bi | +US$ 12,3 bi | vs Itália |
 Suíça |
US$ 84,1 bi | US$ 63,6 bi | +US$ 20,5 bi | vs Suíça |
 Áustria |
US$ 86,7 bi | US$ 58,8 bi | +US$ 27,9 bi | vs Áustria |
 Reino Unido |
US$ 90,2 bi | US$ 43,4 bi | +US$ 46,8 bi | vs RU |
 Tchéquia |
US$ 60,0 bi | US$ 69,8 bi | -US$ 9,76 bi | vs Tchéquia |
Balança comercial da Alemanha: superávit (+) ou déficit (−)
| Bens e serviços, US$, 2025 | +US$ 119 bi |
|---|---|
| % do PIB, 2025 | +2,4% |
| Anos com superávit, 2000–2025 | 26 |
| Bens, US$, 2025 | +US$ 209 bi |
| Serviços, US$, 2025 | -US$ 86,6 bi |
| Maior superávit em bens, 2025 | Estados Unidos +US$ 62,9 bi |
| Maior déficit em bens, 2025 | China -US$ 102 bi |
Comparar a balança comercial da Alemanha com a de outros países
Fontes:
- TradeMap (2025, atualizado em outubro de 2026)
- Banco Mundial | Economy & Growth (1970–2025, atualizado em outubro de 2026)
Creative Commons Atribuição (CC BY): você pode copiar, compartilhar, adaptar e reutilizar este conteúdo, inclusive para fins comerciais, desde que cite o statistics.wiki e indique as alterações que fizer. As fontes listadas acima podem ter suas próprias condições de licença.