
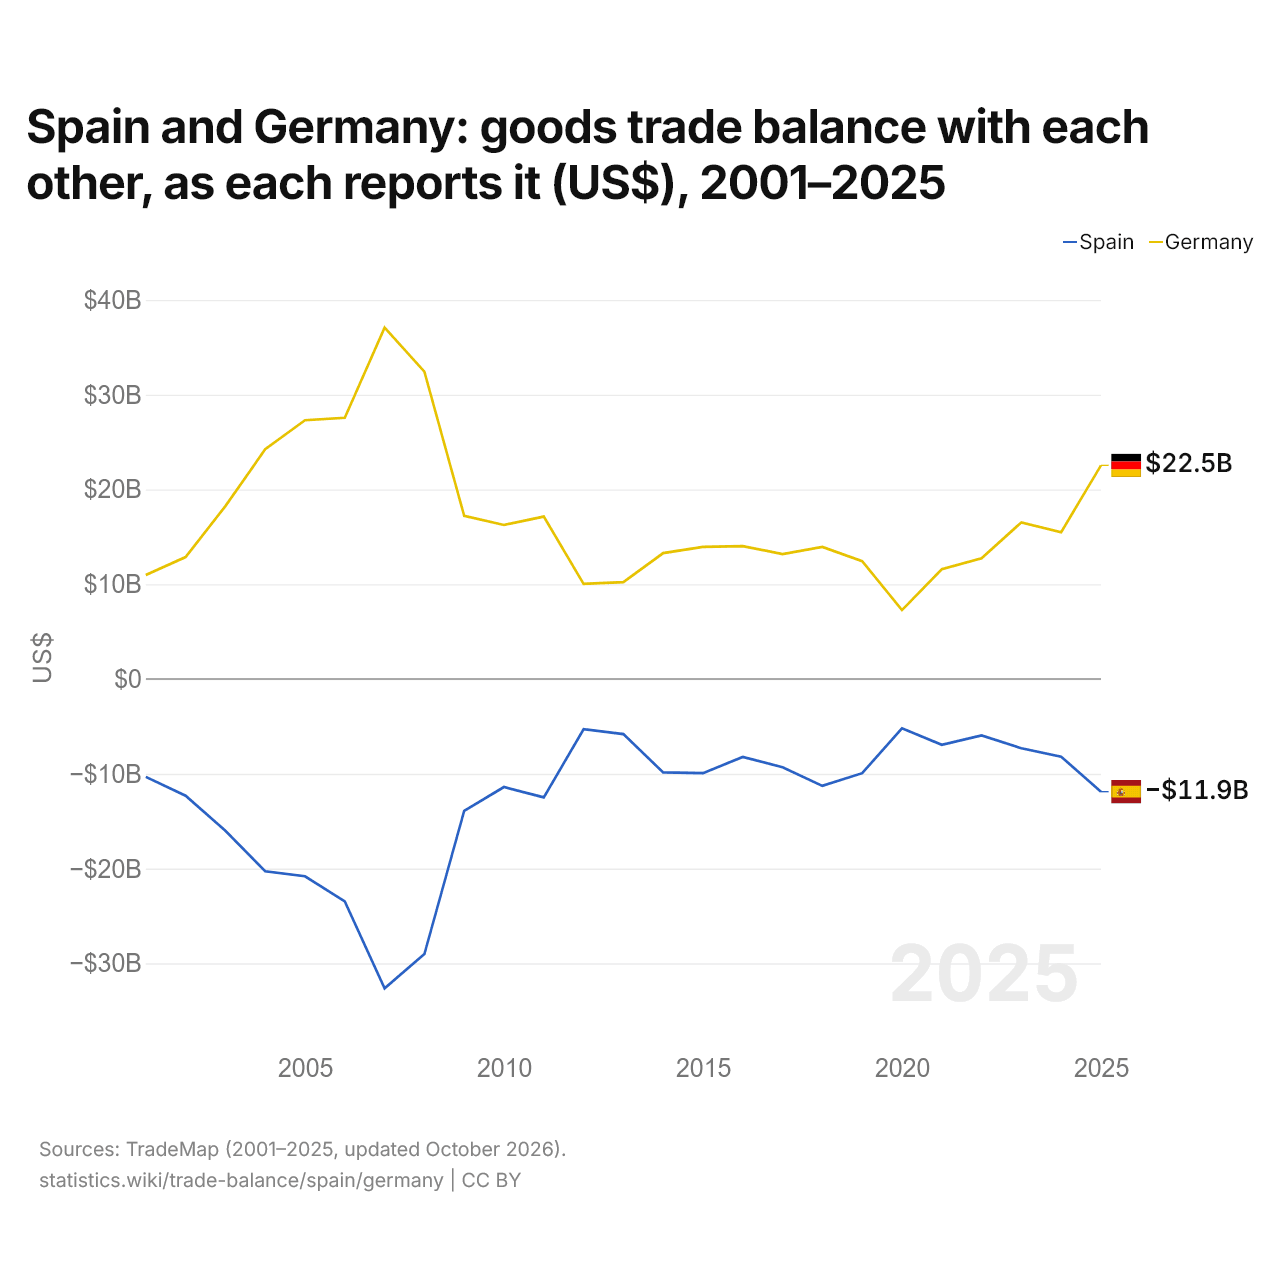
A Espanha e a Alemanha: saldo do comércio de bens entre os dois, segundo cada um (US$), 2001–2025
| Ano | US$ | |
|---|---|---|
| Espanha | Alemanha | |
| 2025 | US$ −11.887.728.000 | US$ 22.543.506.000 |
| 2024 | US$ −8.197.119.000 | US$ 15.489.820.000 |
| 2023 | US$ −7.305.388.000 | US$ 16.530.943.000 |
| 2022 | US$ −5.959.625.000 | US$ 12.734.498.000 |
| 2021 | US$ −6.947.311.000 | US$ 11.587.789.000 |
| 2020 | US$ −5.204.898.000 | US$ 7.273.129.000 |
| 2019 | US$ −9.933.900.000 | US$ 12.430.551.000 |
| 2018 | US$ −11.272.721.000 | US$ 13.940.868.000 |
| 2017 | US$ −9.306.470.000 | US$ 13.180.051.000 |
| 2016 | US$ −8.221.005.000 | US$ 14.021.198.000 |
| 2015 | US$ −9.930.321.000 | US$ 13.938.530.000 |
| 2014 | US$ −9.858.406.000 | US$ 13.285.817.000 |
| 2013 | US$ −5.811.374.000 | US$ 10.218.342.000 |
| 2012 | US$ −5.302.257.000 | US$ 10.041.737.000 |
| 2011 | US$ −12.491.932.000 | US$ 17.134.695.000 |
| 2010 | US$ −11.393.923.000 | US$ 16.253.257.000 |
| 2009 | US$ −13.907.975.000 | US$ 17.215.746.000 |
| 2008 | US$ −29.016.941.000 | US$ 32.425.383.000 |
| 2007 | US$ −32.632.086.000 | US$ 37.066.564.000 |
| 2006 | US$ −23.466.888.000 | US$ 27.569.631.000 |
| 2005 | US$ −20.810.675.000 | US$ 27.300.822.000 |
| 2004 | US$ −20.287.230.000 | US$ 24.242.825.000 |
| 2003 | US$ −16.004.236.000 | US$ 18.241.826.000 |
| 2002 | US$ −12.313.135.000 | US$ 12.864.488.000 |
| 2001 | US$ −10.321.414.000 | US$ 10.967.852.000 |
Em 2025, segundo a Espanha, o seu comércio de bens com a Alemanha teve um déficit de US$ 11,9 bilhões; segundo a Alemanha, o seu comércio de bens com a Espanha teve um superávit de US$ 22,5 bilhões. Em 2001, os valores foram um déficit de US$ 10,3 bilhões da Espanha e um superávit de US$ 11 bilhões da Alemanha.
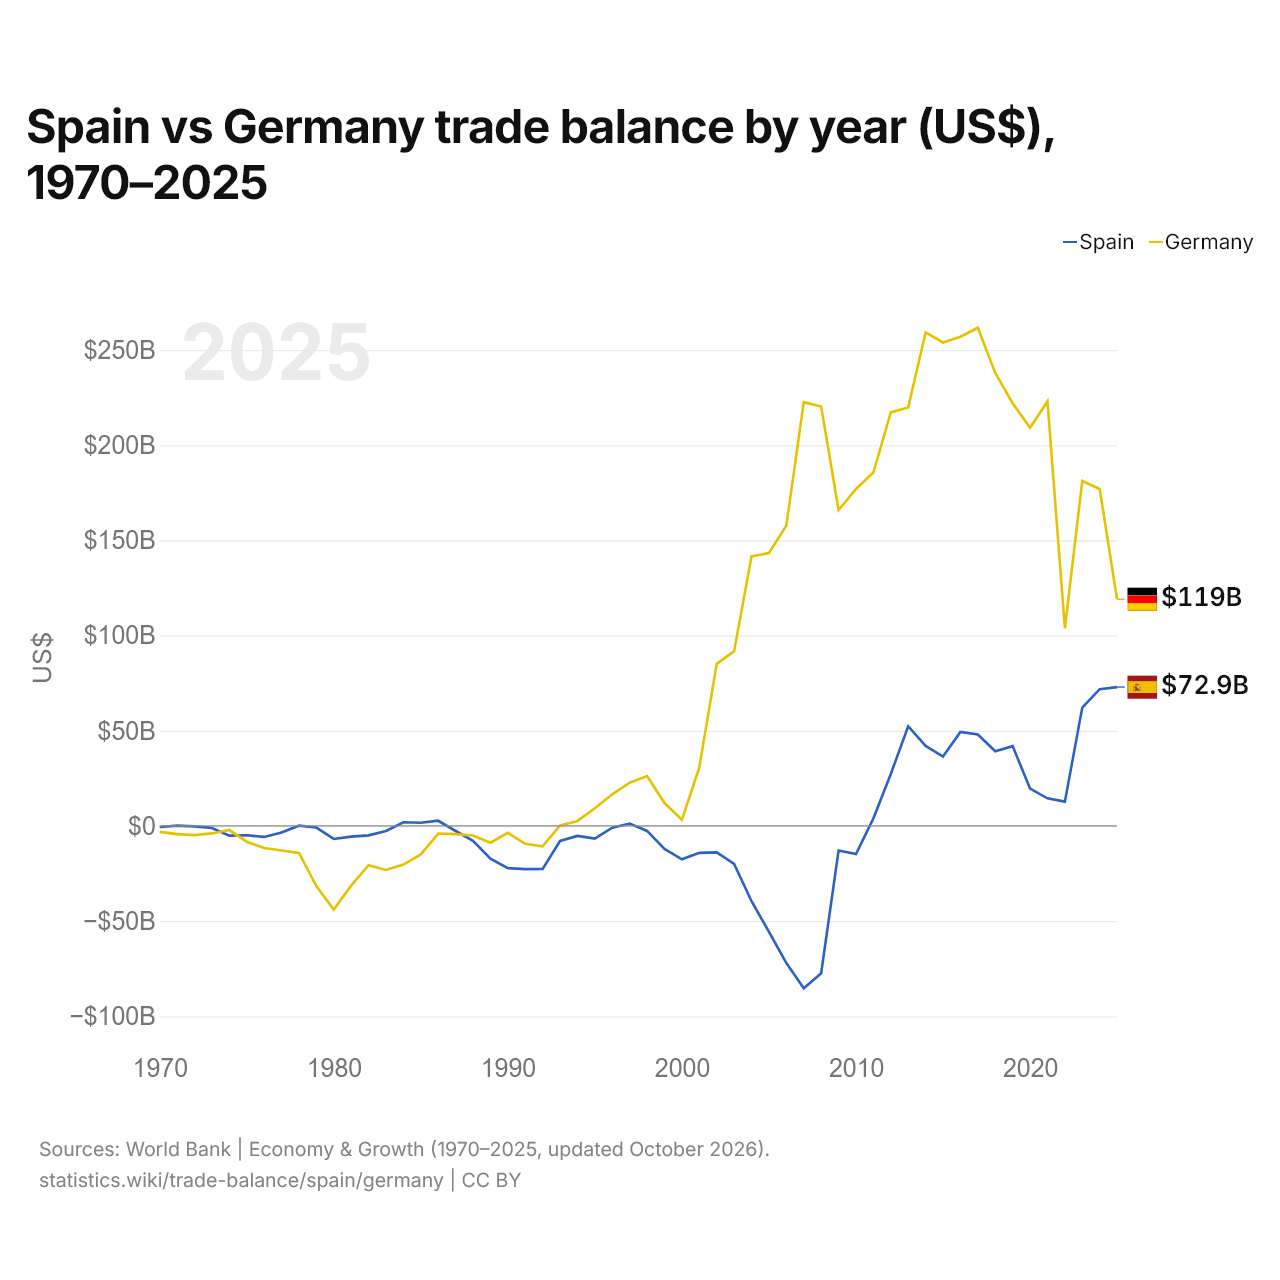
Espanha vs Alemanha: balança comercial por ano (US$), 1970–2025
| Ano | US$ | |
|---|---|---|
 Espanha |
 Alemanha |
|
| 2025 | US$ 72.905.382.033 | US$ 119.036.943.611 |
| 2024 | US$ 71.813.779.341 | US$ 176.993.019.011 |
| 2023 | US$ 62.117.801.378 | US$ 181.209.809.275 |
| 2022 | US$ 12.715.562.305 | US$ 103.809.534.747 |
| 2021 | US$ 14.460.183.031 | US$ 222.995.040.802 |
| 2020 | US$ 19.552.112.993 | US$ 209.133.823.156 |
| 2019 | US$ 41.892.975.106 | US$ 222.041.052.173 |
| 2018 | US$ 39.230.127.861 | US$ 237.995.400.452 |
| 2017 | US$ 48.023.876.493 | US$ 261.732.442.733 |
| 2016 | US$ 49.290.395.615 | US$ 256.950.954.099 |
| 2015 | US$ 36.369.832.555 | US$ 253.944.200.893 |
| 2014 | US$ 41.951.397.767 | US$ 259.262.242.062 |
| 2013 | US$ 52.337.147.571 | US$ 219.838.066.559 |
| 2012 | US$ 27.224.671.957 | US$ 217.210.227.233 |
| 2011 | US$ 3.942.017.276 | US$ 185.606.097.335 |
| 2010 | US$ −14.818.860.900 | US$ 177.011.015.050 |
| 2009 | US$ −12.958.923.482 | US$ 165.923.316.906 |
| 2008 | US$ −77.429.392.408 | US$ 220.288.283.354 |
| 2007 | US$ −85.367.077.063 | US$ 222.623.193.646 |
| 2006 | US$ −72.139.174.807 | US$ 157.789.848.554 |
| 2005 | US$ −55.631.984.710 | US$ 143.315.467.107 |
| 2004 | US$ −39.615.800.979 | US$ 141.587.181.187 |
| 2003 | US$ −20.017.014.300 | US$ 91.785.747.701 |
| 2002 | US$ −13.991.654.416 | US$ 85.110.145.458 |
| 2001 | US$ −14.189.458.605 | US$ 30.705.762.723 |
| 2000 | US$ −17.606.826.022 | US$ 3.259.428.685 |
| 1999 | US$ −12.163.706.600 | US$ 11.966.537.957 |
| 1998 | US$ −2.663.993.763 | US$ 26.183.172.169 |
| 1997 | US$ 1.209.090.909 | US$ 22.686.668.171 |
| 1996 | US$ −973.335.085 | US$ 16.562.256.304 |
| 1995 | US$ −6.745.396.317 | US$ 9.254.810.973 |
| 1994 | US$ −5.306.615.327 | US$ 2.562.371.942 |
| 1993 | US$ −7.943.935.155 | US$ 179.817.816 |
| 1992 | US$ −22.619.393.792 | US$ −10.812.773.951 |
| 1991 | US$ −22.740.254.604 | US$ −9.442.545.669 |
| 1990 | US$ −22.235.288.932 | US$ −3.700.909.091 |
| 1989 | US$ −17.259.685.172 | US$ −8.860.353.688 |
| 1988 | US$ −7.858.501.643 | US$ −5.073.354.494 |
| 1987 | US$ −2.712.726.048 | US$ −4.398.411.317 |
| 1986 | US$ 2.681.646.667 | US$ −4.040.852.923 |
| 1985 | US$ 1.600.854.207 | US$ −15.052.044.247 |
| 1984 | US$ 1.872.076.175 | US$ −20.362.746.203 |
| 1983 | US$ −2.730.429.234 | US$ −23.185.607.813 |
| 1982 | US$ −5.009.245.797 | US$ −20.687.120.174 |
| 1981 | US$ −5.669.717.066 | US$ −31.452.268.282 |
| 1980 | US$ −6.898.052.913 | US$ −43.964.356.574 |
| 1979 | US$ −885.949.430 | US$ −31.634.161.776 |
| 1978 | US$ 78.546.007 | US$ −14.221.404.090 |
| 1977 | US$ −3.503.969.332 | US$ −12.957.768.887 |
| 1976 | US$ −5.842.516.787 | US$ −11.645.608.203 |
| 1975 | US$ −4.959.394.203 | US$ −8.334.008.268 |
| 1974 | US$ −5.167.078.166 | US$ −2.193.463.835 |
| 1973 | US$ −1.140.005.711 | US$ −4.000.794.731 |
| 1972 | US$ −288.646.130 | US$ −4.909.821.505 |
| 1971 | US$ 68.340.120 | US$ −4.336.130.597 |
| 1970 | US$ −634.228.667 | US$ −3.162.513.226 |
Em 2025, a balança comercial da Espanha teve um superávit de US$ 72,9 bilhões e a da Alemanha, um superávit de US$ 119 bilhões; o superávit da Alemanha foi 1,6 vezes maior. Em 1970, a balança comercial da Espanha teve um déficit de US$ 634 milhões e a da Alemanha, um déficit de US$ 3,16 bilhões.
De 1970 a 2025, a balança comercial da Espanha teve superávit em 21 dos 56 anos, e a da Alemanha, em 33. As balanças comerciais da Espanha e da Alemanha tiveram déficit ao mesmo tempo em 18 desses anos, o mais recente em 1992.
Espanha vs Alemanha: dados da balança comercial
|
Espanha
|
Alemanha
|
|
|---|---|---|
| Bens e serviços, US$ | +US$ 72,9 bi (2025) | +US$ 119 bi (2025) |
| % do PIB | +3,8% (2025) | +2,4% (2025) |
| Anos com superávit desde 2000 | 15 de 26 | 26 de 26 |
| Saldo de bens entre os dois, dados próprios | -US$ 11,9 bi (2025) | +US$ 22,5 bi (2025) |
| Maior superávit em bens com | Portugal (+US$ 20,1 bi, 2025) | Estados Unidos (+US$ 62,9 bi, 2025) |
| Maior déficit em bens com | China (-US$ 47,1 bi, 2025) | China (-US$ 102 bi, 2025) |
Comparar a balança comercial de 2 países quaisquer
Fontes:
- Banco Mundial | Economy & Growth (1970–2025, atualizado em outubro de 2026)
- TradeMap (2001–2025, atualizado em outubro de 2026)
Creative Commons Atribuição (CC BY): você pode copiar, compartilhar, adaptar e reutilizar este conteúdo, inclusive para fins comerciais, desde que cite o statistics.wiki e indique as alterações que fizer. As fontes listadas acima podem ter suas próprias condições de licença.