
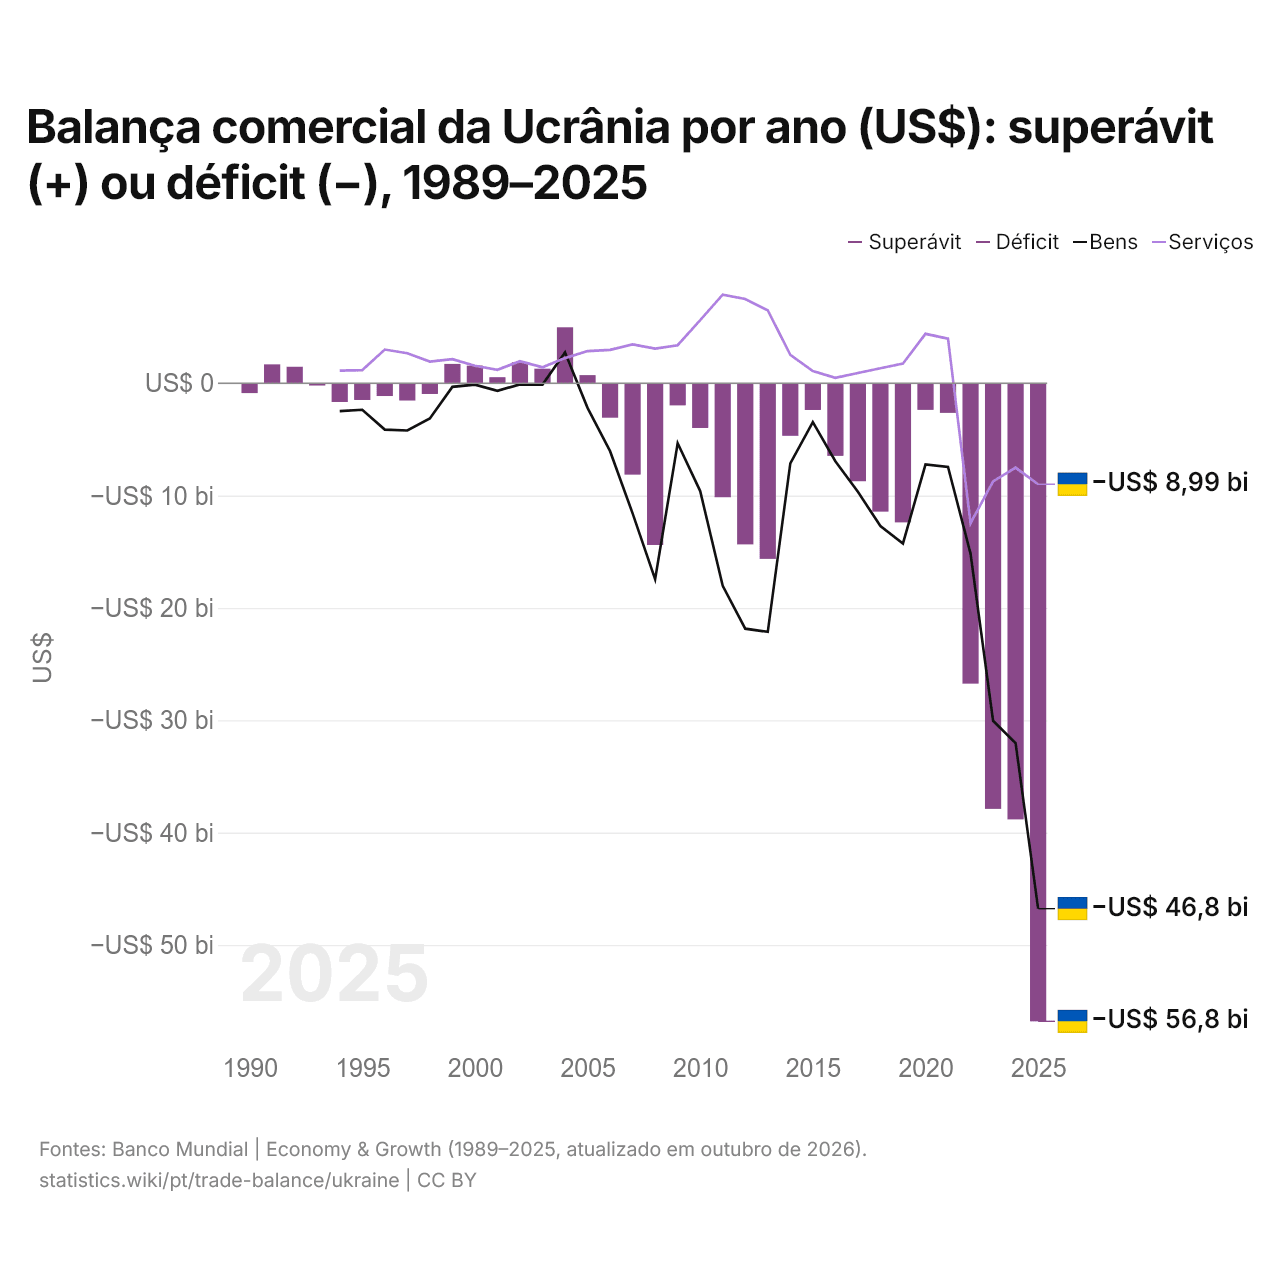
Balança comercial da Ucrânia por ano (US$): superávit (+) ou déficit (−), 1989–2025
| Ano | US$ | ||
|---|---|---|---|
| Bens e serviços | Bens | Serviços | |
| 2025 | US$ −56.800.122.814 | US$ −46.771.000.000 | US$ −8.989.000.000 |
| 2024 | US$ −38.824.137.717 | US$ −32.026.000.000 | US$ −7.517.000.000 |
| 2023 | US$ −37.891.022.997 | US$ −30.042.000.000 | US$ −8.735.000.000 |
| 2022 | US$ −26.738.449.230 | US$ −15.158.000.000 | US$ −12.464.000.000 |
| 2021 | US$ −2.639.467.168 | US$ −7.443.000.000 | US$ 3.971.000.000 |
| 2020 | US$ −2.369.876.403 | US$ −7.235.000.000 | US$ 4.400.000.000 |
| 2019 | US$ −12.384.279.577 | US$ −14.261.000.000 | US$ 1.750.000.000 |
| 2018 | US$ −11.425.933.031 | US$ −12.714.000.000 | US$ 1.336.000.000 |
| 2017 | US$ −8.726.414.190 | US$ −9.663.000.000 | US$ 919.000.000 |
| 2016 | US$ −6.463.928.654 | US$ −6.942.000.000 | US$ 489.000.000 |
| 2015 | US$ −2.377.052.775 | US$ −3.455.000.000 | US$ 1.093.000.000 |
| 2014 | US$ −4.680.457.309 | US$ −7.128.000.000 | US$ 2.522.000.000 |
| 2013 | US$ −15.634.054.798 | US$ −22.128.000.000 | US$ 6.494.000.000 |
| 2012 | US$ −14.346.462.765 | US$ −21.846.000.000 | US$ 7.500.000.000 |
| 2011 | US$ −10.147.770.404 | US$ −18.031.000.000 | US$ 7.886.000.000 |
| 2010 | US$ −3.977.373.467 | US$ −9.597.000.000 | US$ 5.615.000.000 |
| 2009 | US$ −1.967.337.677 | US$ −5.343.000.000 | US$ 3.386.000.000 |
| 2008 | US$ −14.394.497.592 | US$ −17.452.000.000 | US$ 3.084.000.000 |
| 2007 | US$ −8.130.891.089 | US$ −11.585.000.000 | US$ 3.454.000.000 |
| 2006 | US$ −3.069.900.990 | US$ −6.046.000.000 | US$ 2.976.000.000 |
| 2005 | US$ 724.526.116 | US$ −2.193.000.000 | US$ 2.867.000.000 |
| 2004 | US$ 4.982.327.505 | US$ 2.742.000.000 | US$ 2.238.000.000 |
| 2003 | US$ 1.298.219.585 | US$ −118.000.000 | US$ 1.416.000.000 |
| 2002 | US$ 1.864.970.784 | US$ −102.000.000 | US$ 1.966.000.000 |
| 2001 | US$ 539.267.698 | US$ −667.000.000 | US$ 1.202.000.000 |
| 2000 | US$ 1.572.910.572 | US$ −126.000.000 | US$ 1.562.000.000 |
| 1999 | US$ 1.723.000.057 | US$ −321.000.000 | US$ 2.142.000.000 |
| 1998 | US$ −952.422.820 | US$ −3.137.000.000 | US$ 1.930.000.000 |
| 1997 | US$ −1.534.117.222 | US$ −4.203.000.000 | US$ 2.667.000.000 |
| 1996 | US$ −1.137.489.348 | US$ −4.122.000.000 | US$ 3.000.000.000 |
| 1995 | US$ −1.486.528.419 | US$ −2.360.000.000 | US$ 1.170.000.000 |
| 1994 | US$ −1.663.880.073 | US$ −2.484.000.000 | US$ 1.118.000.000 |
| 1993 | US$ −205.438.157 | - | - |
| 1992 | US$ 1.472.159.750 | - | - |
| 1991 | US$ 1.681.537.695 | - | - |
| 1990 | US$ −877.295.839 | - | - |
| 1989 | US$ −53.920.830 | - | - |
Em 2025, a balança comercial da Ucrânia teve um déficit de US$ 56,8 bilhões, ante um déficit de US$ 53,9 milhões em 1989. O maior superávit foi de US$ 4,98 bilhões, em 2004. A balança comercial da Ucrânia teve déficit em todos os anos desde 2006. O comércio de bens teve um déficit de US$ 46,8 bilhões e o de serviços, um déficit de US$ 8,99 bilhões.
Em 2025, o déficit comercial da Ucrânia foi o maior de 41 países da Europa, seguido do Reino Unido (déficit de US$ 50,6 bilhões). De 2016 a 2025, os saldos comerciais da Ucrânia somaram um déficit de US$ 204 bilhões, ante um déficit de US$ 78,7 bilhões de 2006 a 2015. Em 2025, a conta corrente da Ucrânia teve um déficit de 13,5% do PIB.
Comércio de bens da Ucrânia com os seus 10 maiores parceiros comerciais, segundo a Ucrânia
| País | Exportações para | Importações de | Saldo | |
|---|---|---|---|---|
 China |
US$ 2,40 bi | US$ 14,3 bi | -US$ 11,9 bi | |
 Polônia |
US$ 4,40 bi | US$ 6,97 bi | -US$ 2,57 bi | vs Polônia |
 Alemanha |
US$ 2,54 bi | US$ 5,38 bi | -US$ 2,84 bi | vs Alemanha |
 Turquia |
US$ 2,20 bi | US$ 4,23 bi | -US$ 2,02 bi | vs Turquia |
 Itália |
US$ 1,92 bi | US$ 2,58 bi | -US$ 659 mi | |
 Estados Unidos |
US$ 876 mi | US$ 3,47 bi | -US$ 2,60 bi | |
 Espanha |
US$ 2,87 bi | US$ 853 mi | +US$ 2,01 bi | |
 Bulgária |
US$ 1,13 bi | US$ 2,36 bi | -US$ 1,23 bi | vs Bulgária |
 Romênia |
US$ 1,69 bi | US$ 1,69 bi | +US$ 6,68 mi | vs Romênia |
 Tchéquia |
US$ 829 mi | US$ 2,47 bi | -US$ 1,64 bi | vs Tchéquia |
Balança comercial da Ucrânia: superávit (+) ou déficit (−)
Comparar a balança comercial da Ucrânia com a de outros países
Fontes:
- TradeMap (2024, atualizado em outubro de 2026)
- Banco Mundial | Economy & Growth (1989–2025, atualizado em outubro de 2026)
Creative Commons Atribuição (CC BY): você pode copiar, compartilhar, adaptar e reutilizar este conteúdo, inclusive para fins comerciais, desde que cite o statistics.wiki e indique as alterações que fizer. As fontes listadas acima podem ter suas próprias condições de licença.