
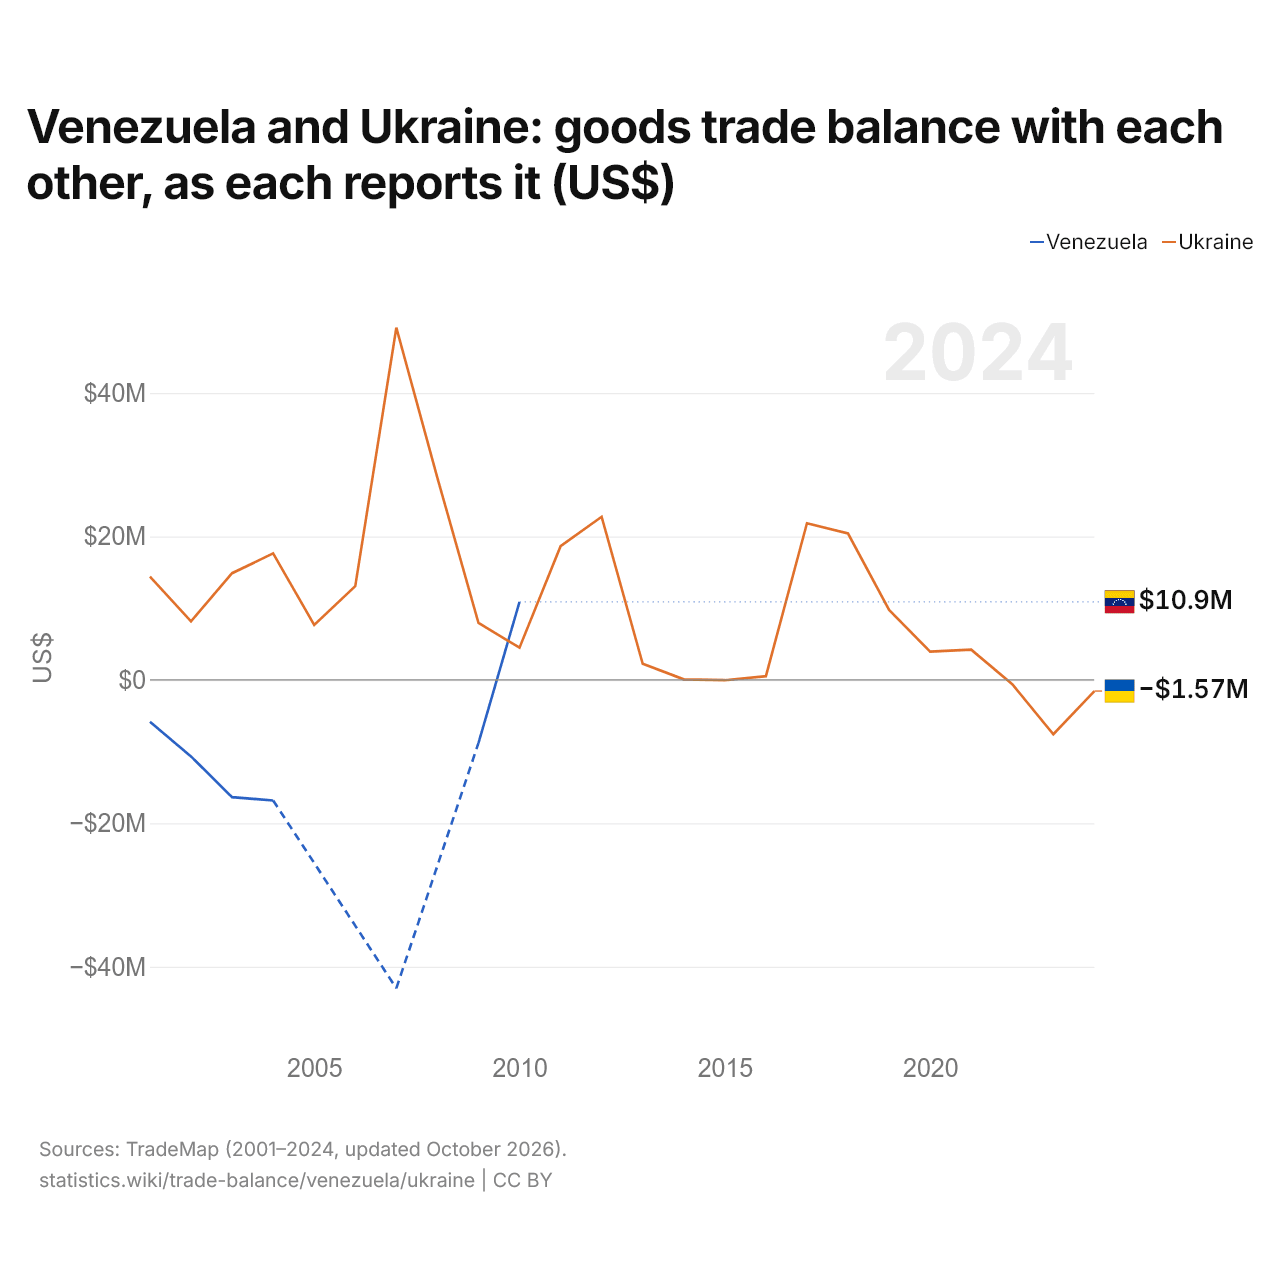
A Venezuela e a Ucrânia: saldo do comércio de bens entre os dois, segundo cada um (US$)
| Ano | US$ | |
|---|---|---|
| Venezuela | Ucrânia | |
| 2024 | - | US$ −1.568.000 |
| 2023 | - | US$ −7.596.000 |
| 2022 | - | US$ −602.000 |
| 2021 | - | US$ 4.209.000 |
| 2020 | - | US$ 3.929.000 |
| 2019 | - | US$ 9.735.000 |
| 2018 | - | US$ 20.403.000 |
| 2017 | - | US$ 21.831.000 |
| 2016 | - | US$ 512.000 |
| 2015 | - | US$ −53.000 |
| 2014 | - | US$ 69.000 |
| 2013 | - | US$ 2.242.000 |
| 2012 | - | US$ 22.736.000 |
| 2011 | - | US$ 18.641.000 |
| 2010 | US$ 10.870.000 | US$ 4.480.000 |
| 2009 | US$ −8.823.000 | US$ 7.950.000 |
| 2008 | - | US$ 28.173.000 |
| 2007 | US$ −43.012.000 | US$ 49.099.000 |
| 2006 | - | US$ 13.059.000 |
| 2005 | - | US$ 7.663.000 |
| 2004 | US$ −16.823.000 | US$ 17.628.000 |
| 2003 | US$ −16.366.000 | US$ 14.870.000 |
| 2002 | US$ −10.676.000 | US$ 8.159.000 |
| 2001 | US$ −5.851.000 | US$ 14.397.000 |
Segundo a Venezuela, o seu comércio de bens com a Ucrânia teve um superávit de US$ 10,9 milhões; segundo a Ucrânia, o seu comércio de bens com a Venezuela teve um superávit de US$ 4,48 milhões. Em 2001, os valores foram um déficit de US$ 5,85 milhões da Venezuela e um superávit de US$ 14,4 milhões da Ucrânia.
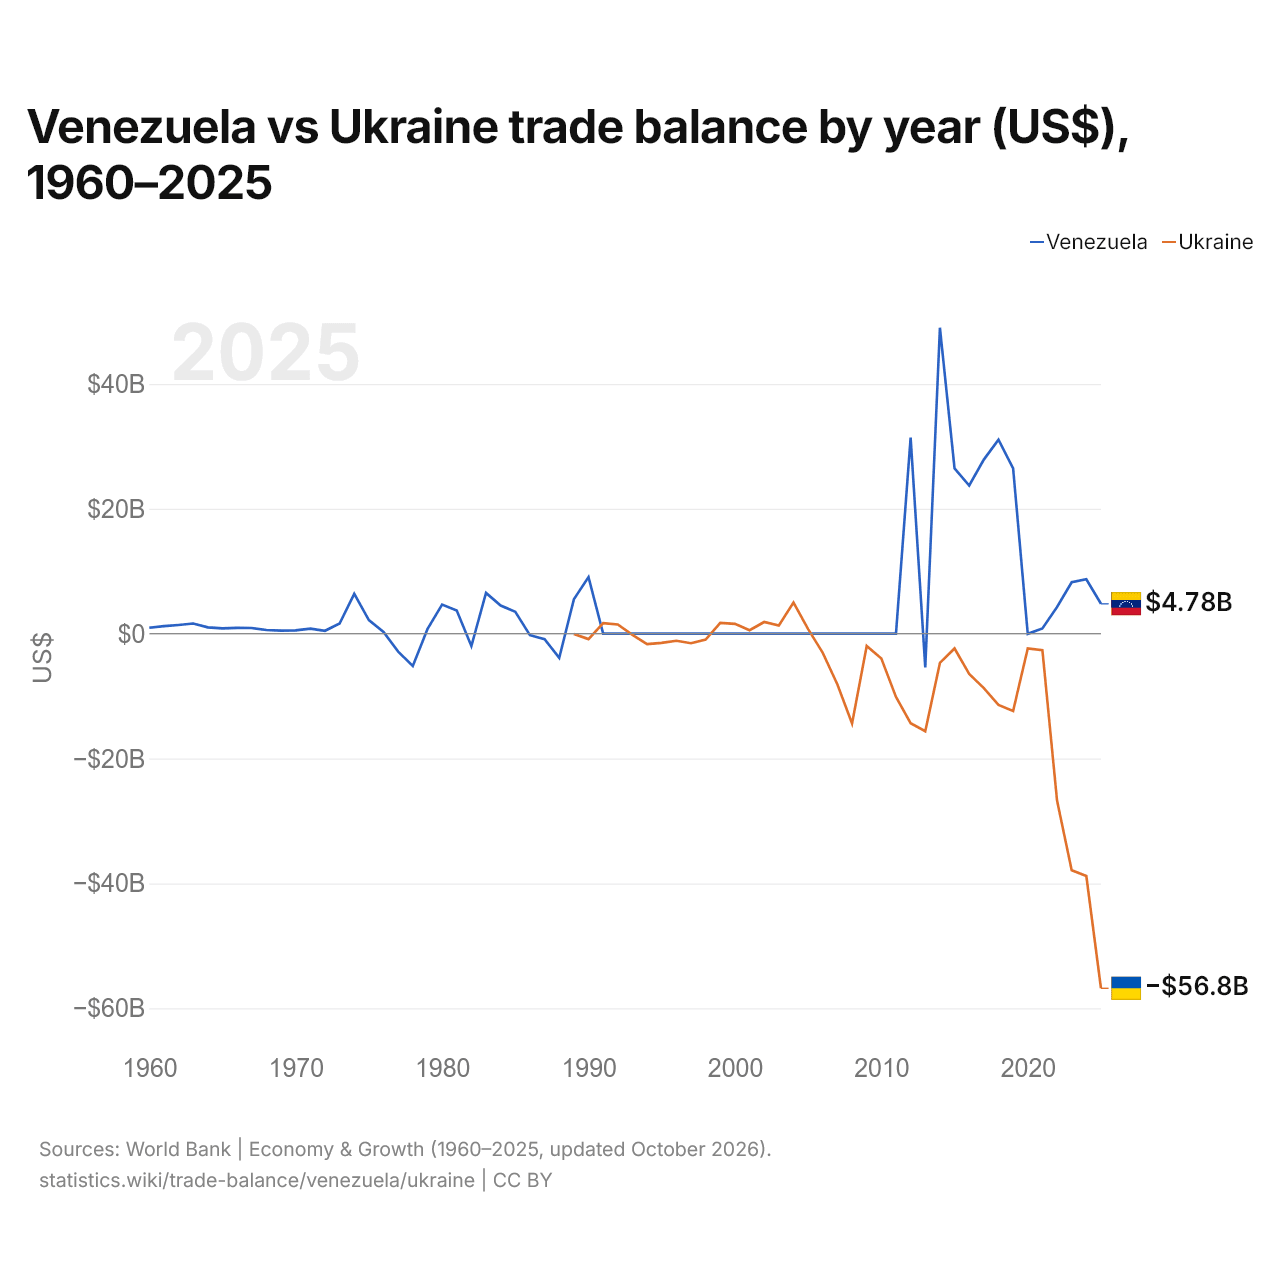
Venezuela vs Ucrânia: balança comercial por ano (US$), 1960–2025
| Ano | US$ | |
|---|---|---|
 Venezuela |
 Ucrânia |
|
| 2025 | US$ 4.778.560.653 | US$ −56.800.122.814 |
| 2024 | US$ 8.720.159.720 | US$ −38.824.137.717 |
| 2023 | US$ 8.229.411.761 | US$ −37.891.022.997 |
| 2022 | US$ 4.272.755.670 | US$ −26.738.449.230 |
| 2021 | US$ 834.346.180 | US$ −2.639.467.168 |
| 2020 | US$ −34.132.875 | US$ −2.369.876.403 |
| 2019 | US$ 26.476.840.424 | US$ −12.384.279.577 |
| 2018 | US$ 31.066.235.864 | US$ −11.425.933.031 |
| 2017 | US$ 27.874.138.562 | US$ −8.726.414.190 |
| 2016 | US$ 23.722.233.639 | US$ −6.463.928.654 |
| 2015 | US$ 26.467.912.241 | US$ −2.377.052.775 |
| 2014 | US$ 48.997.528.952 | US$ −4.680.457.309 |
| 2013 | US$ −5.403.332.873 | US$ −15.634.054.798 |
| 2012 | US$ 31.381.274.617 | US$ −14.346.462.765 |
| 2011 | US$ 0 | US$ −10.147.770.404 |
| 2010 | US$ 0 | US$ −3.977.373.467 |
| 2009 | US$ 0 | US$ −1.967.337.677 |
| 2008 | US$ 0 | US$ −14.394.497.592 |
| 2007 | US$ 0 | US$ −8.130.891.089 |
| 2006 | US$ 0 | US$ −3.069.900.990 |
| 2005 | US$ 0 | US$ 724.526.116 |
| 2004 | US$ 0 | US$ 4.982.327.505 |
| 2003 | US$ 0 | US$ 1.298.219.585 |
| 2002 | US$ 0 | US$ 1.864.970.784 |
| 2001 | US$ 0 | US$ 539.267.698 |
| 2000 | US$ 0 | US$ 1.572.910.572 |
| 1999 | US$ 0 | US$ 1.723.000.057 |
| 1998 | US$ 0 | US$ −952.422.820 |
| 1997 | US$ 0 | US$ −1.534.117.222 |
| 1996 | US$ 0 | US$ −1.137.489.348 |
| 1995 | US$ 0 | US$ −1.486.528.419 |
| 1994 | US$ 0 | US$ −1.663.880.073 |
| 1993 | US$ 0 | US$ −205.438.157 |
| 1992 | US$ 0 | US$ 1.472.159.750 |
| 1991 | US$ 0 | US$ 1.681.537.695 |
| 1990 | US$ 9.061.996.090 | US$ −877.295.839 |
| 1989 | US$ 5.491.872.208 | US$ −53.920.830 |
| 1988 | US$ −3.892.310.345 | - |
| 1987 | US$ −877.193.103 | - |
| 1986 | US$ −251.764.948 | - |
| 1985 | US$ 3.506.506.667 | - |
| 1984 | US$ 4.494.997.625 | - |
| 1983 | US$ 6.526.279.070 | - |
| 1982 | US$ −2.002.883.721 | - |
| 1981 | US$ 3.713.232.558 | - |
| 1980 | US$ 4.658.418.605 | - |
| 1979 | US$ 720.139.535 | - |
| 1978 | US$ −5.176.000.000 | - |
| 1977 | US$ −2.880.558.140 | - |
| 1976 | US$ 270.069.767 | - |
| 1975 | US$ 2.160.418.605 | - |
| 1974 | US$ 6.368.744.186 | - |
| 1973 | US$ 1.620.302.326 | - |
| 1972 | US$ 461.863.636 | - |
| 1971 | US$ 813.750.000 | - |
| 1970 | US$ 516.111.111 | - |
| 1969 | US$ 473.111.111 | - |
| 1968 | US$ 580.600.000 | - |
| 1967 | US$ 903.177.778 | - |
| 1966 | US$ 924.688.889 | - |
| 1965 | US$ 838.644.444 | - |
| 1964 | US$ 998.252.874 | - |
| 1963 | US$ 1.619.952.235 | - |
| 1962 | US$ 1.390.138.323 | - |
| 1961 | US$ 1.191.969.750 | - |
| 1960 | US$ 941.520.090 | - |
Em 2025, a balança comercial da Venezuela teve um superávit de US$ 4,78 bilhões e a da Ucrânia, um déficit de US$ 56,8 bilhões. Em 1989, a balança comercial da Venezuela teve um superávit de US$ 5,49 bilhões e a da Ucrânia, um déficit de US$ 53,9 milhões.
Nos anos de 1989 a 2025 que os dois países informaram, a balança comercial da Venezuela teve superávit em 14 dos 16 anos, e a da Ucrânia, em nenhum. As balanças comerciais da Venezuela e da Ucrânia tiveram déficit ao mesmo tempo em 2 desses anos, o mais recente em 2020.
Venezuela vs Ucrânia: dados da balança comercial
|
Venezuela
|
Ucrânia
|
|
|---|---|---|
| Bens e serviços, US$ | +US$ 4,78 bi (2025) | -US$ 56,8 bi (2025) |
| % do PIB | +4,8% (2025) | −26,5% (2025) |
| Anos com superávit desde 2000 | 12 de 26 | 6 de 26 |
| Saldo de bens entre os dois, dados próprios | n/d | -US$ 1,57 mi (2024) |
| Maior superávit em bens com | n/d | Espanha (+US$ 2,01 bi, 2024) |
| Maior déficit em bens com | n/d | China (-US$ 11,9 bi, 2024) |
Comparar a balança comercial de 2 países quaisquer
Fontes:
- Banco Mundial | Economy & Growth (1960–2025, atualizado em outubro de 2026)
- TradeMap (2001–2024, atualizado em outubro de 2026)
Creative Commons Atribuição (CC BY): você pode copiar, compartilhar, adaptar e reutilizar este conteúdo, inclusive para fins comerciais, desde que cite o statistics.wiki e indique as alterações que fizer. As fontes listadas acima podem ter suas próprias condições de licença.