
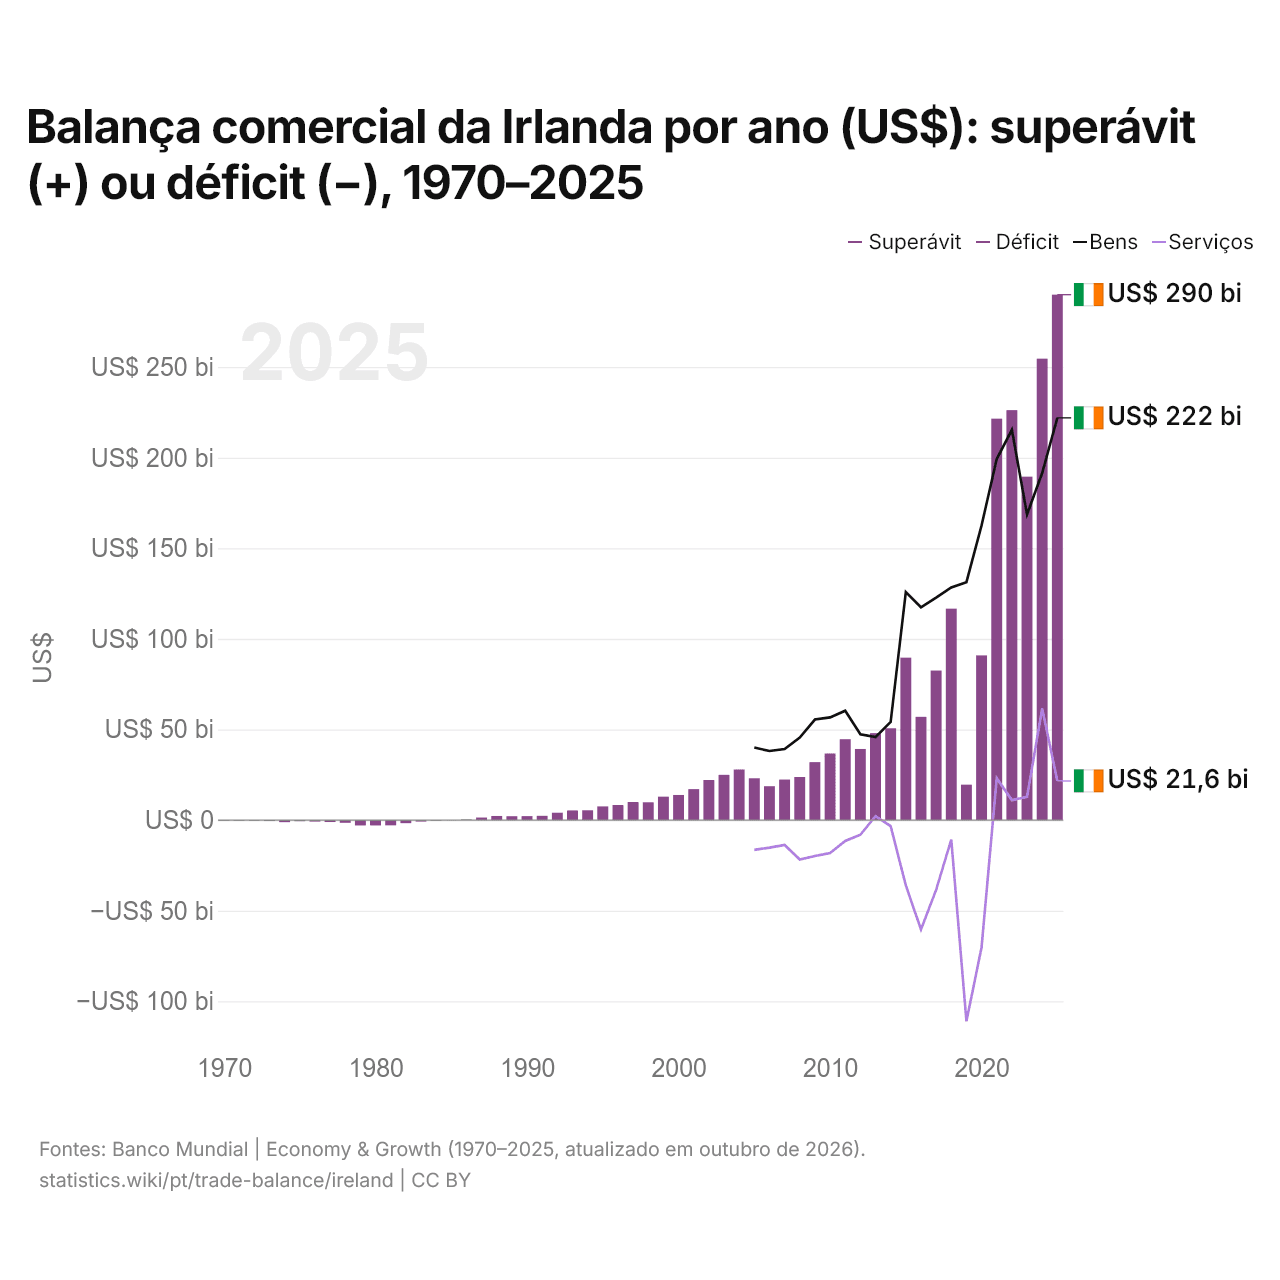
Balança comercial da Irlanda por ano (US$): superávit (+) ou déficit (−), 1970–2025
| Ano | US$ | ||
|---|---|---|---|
| Bens e serviços | Bens | Serviços | |
| 2025 | US$ 289.939.322.234 | US$ 221.972.242.907 | US$ 21.622.502.082 |
| 2024 | US$ 254.623.727.467 | US$ 191.494.349.841 | US$ 61.532.186.157 |
| 2023 | US$ 189.520.115.565 | US$ 168.642.819.803 | US$ 12.833.625.782 |
| 2022 | US$ 226.226.860.149 | US$ 215.361.557.704 | US$ 10.989.890.495 |
| 2021 | US$ 221.508.442.679 | US$ 199.247.511.114 | US$ 23.073.721.186 |
| 2020 | US$ 90.878.856.252 | US$ 162.615.823.104 | US$ −70.174.827.157 |
| 2019 | US$ 19.530.878.451 | US$ 131.292.322.408 | US$ −111.067.909.320 |
| 2018 | US$ 116.690.741.020 | US$ 128.412.055.131 | US$ −10.827.226.887 |
| 2017 | US$ 82.519.979.053 | US$ 122.725.173.547 | US$ −38.534.666.230 |
| 2016 | US$ 56.957.858.132 | US$ 117.398.937.706 | US$ −60.352.364.071 |
| 2015 | US$ 89.639.843.125 | US$ 125.780.522.571 | US$ −36.022.880.013 |
| 2014 | US$ 50.667.638.273 | US$ 54.177.720.366 | US$ −3.391.866.864 |
| 2013 | US$ 47.978.450.103 | US$ 45.761.299.697 | US$ 2.154.477.322 |
| 2012 | US$ 39.229.583.132 | US$ 47.356.205.305 | US$ −8.102.132.370 |
| 2011 | US$ 44.621.241.404 | US$ 60.316.632.293 | US$ −11.503.011.420 |
| 2010 | US$ 36.749.740.973 | US$ 56.654.462.130 | US$ −18.201.451.437 |
| 2009 | US$ 31.969.096.553 | US$ 55.494.181.498 | US$ −19.845.483.507 |
| 2008 | US$ 23.763.202.014 | US$ 45.519.984.660 | US$ −21.806.711.490 |
| 2007 | US$ 22.353.730.250 | US$ 39.236.005.523 | US$ −13.736.503.766 |
| 2006 | US$ 18.684.829.769 | US$ 38.113.650.751 | US$ −15.224.889.399 |
| 2005 | US$ 23.051.810.861 | US$ 40.017.994.164 | US$ −16.449.199.632 |
| 2004 | US$ 27.918.902.374 | - | - |
| 2003 | US$ 24.947.120.311 | - | - |
| 2002 | US$ 22.092.289.965 | - | - |
| 2001 | US$ 17.066.865.501 | - | - |
| 2000 | US$ 13.853.052.192 | - | - |
| 1999 | US$ 12.904.847.541 | - | - |
| 1998 | US$ 9.809.846.361 | - | - |
| 1997 | US$ 9.926.325.215 | - | - |
| 1996 | US$ 8.295.972.782 | - | - |
| 1995 | US$ 7.561.709.596 | - | - |
| 1994 | US$ 5.384.972.909 | - | - |
| 1993 | US$ 5.310.547.738 | - | - |
| 1992 | US$ 4.062.749.565 | - | - |
| 1991 | US$ 2.351.692.230 | - | - |
| 1990 | US$ 2.161.072.033 | - | - |
| 1989 | US$ 2.115.397.924 | - | - |
| 1988 | US$ 2.253.683.263 | - | - |
| 1987 | US$ 1.402.758.661 | - | - |
| 1986 | US$ 308.043.663 | - | - |
| 1985 | US$ 66.860.998 | - | - |
| 1984 | US$ −338.802.288 | - | - |
| 1983 | US$ −794.919.252 | - | - |
| 1982 | US$ −1.695.763.470 | - | - |
| 1981 | US$ −2.940.177.462 | - | - |
| 1980 | US$ −2.953.078.168 | - | - |
| 1979 | US$ −2.981.858.478 | - | - |
| 1978 | US$ −1.510.371.489 | - | - |
| 1977 | US$ −1.076.042.039 | - | - |
| 1976 | US$ −795.849.137 | - | - |
| 1975 | US$ −626.193.380 | - | - |
| 1974 | US$ −1.142.008.838 | - | - |
| 1973 | US$ −538.410.187 | - | - |
| 1972 | US$ −363.749.017 | - | - |
| 1971 | US$ −385.203.143 | - | - |
| 1970 | US$ −362.337.932 | - | - |
Em 2025, a balança comercial da Irlanda teve um superávit de US$ 290 bilhões, ante um déficit de US$ 362 milhões em 1970. O maior déficit foi de US$ 2,98 bilhões, em 1979. A balança comercial da Irlanda teve superávit em todos os anos desde 1985.
Em 2025, o superávit comercial da Irlanda foi o maior de 41 países da Europa, à frente dos Países Baixos (superávit de US$ 150 bilhões). De 2016 a 2025, os saldos comerciais da Irlanda somaram um superávit de US$ 1,55 trilhão, ante um superávit de US$ 406 bilhões de 2006 a 2015. Em 2025, a conta corrente da Irlanda teve um superávit de 6,3% do PIB.
Comércio de bens da Irlanda com os seus 10 maiores parceiros comerciais, segundo a Irlanda, 2025
| País | Exportações para | Importações de | Saldo | |
|---|---|---|---|---|
 Estados Unidos |
US$ 124 bi | US$ 25,7 bi | +US$ 98,2 bi | vs EUA |
 Reino Unido |
US$ 23,3 bi | US$ 24,7 bi | -US$ 1,44 bi | vs RU |
 Países Baixos |
US$ 29,0 bi | US$ 7,14 bi | +US$ 21,8 bi | vs Países Baixos |
 Alemanha |
US$ 17,3 bi | US$ 18,0 bi | -US$ 776 mi | vs Alemanha |
 China |
US$ 9,35 bi | US$ 14,5 bi | -US$ 5,11 bi | |
 Bélgica |
US$ 17,7 bi | US$ 3,48 bi | +US$ 14,2 bi | vs Bélgica |
 França |
US$ 6,50 bi | US$ 14,0 bi | -US$ 7,48 bi | |
 Itália |
US$ 7,98 bi | US$ 4,59 bi | +US$ 3,39 bi | vs Itália |
 Espanha |
US$ 4,55 bi | US$ 2,74 bi | +US$ 1,80 bi | vs Espanha |
 Japão |
US$ 4,26 bi | US$ 2,70 bi | +US$ 1,56 bi |
Balança comercial da Irlanda: superávit (+) ou déficit (−)
| Bens e serviços, US$, 2025 | +US$ 290 bi |
|---|---|
| % do PIB, 2025 | +40,2% |
| Anos com superávit, 2000–2025 | 26 |
| Bens, US$, 2025 | +US$ 222 bi |
| Serviços, US$, 2025 | +US$ 21,6 bi |
| Maior superávit em bens, 2025 | Estados Unidos +US$ 98,2 bi |
| Maior déficit em bens, 2025 | França -US$ 7,48 bi |
Comparar a balança comercial da Irlanda com a de outros países
Fontes:
- TradeMap (2025, atualizado em outubro de 2026)
- Banco Mundial | Economy & Growth (1970–2025, atualizado em outubro de 2026)
Creative Commons Atribuição (CC BY): você pode copiar, compartilhar, adaptar e reutilizar este conteúdo, inclusive para fins comerciais, desde que cite o statistics.wiki e indique as alterações que fizer. As fontes listadas acima podem ter suas próprias condições de licença.